
When you see a dog photo up here, you can guess the author.
Vera Vita/Moment via Getty Images
When you see a dog photo up here, you can guess the author. Vera Vita/Moment via Getty Images
Just a quick update today.
There were two speeches by Federal Reserve members today. The bond market is barely changed.
MBSLive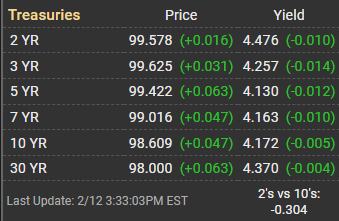
No big deal. What was more interesting was some commentary from last week. Bloomberg reported on two Federal Reserve members wanting a broader reduction in inflation.
Why does that matter? Because that's a different objective.
I've been arguing the Federal Reserve would be slow to cut rates. The Federal Reserve has been saying they will be slow to cut rates. The market still expects cuts to happen faster.
If the economy falls apart, that could happen. I think the Federal Reserve would be wise to be cutting rates faster. But I don't think they will do it.
Over the last few years, the best predictor for the Federal Reserve's action has been their comments. That wasn't always the case. It doesn't mean they will make good decisions. It just means that they've been following through on whatever they said, regardless of what else is happening.
Some investors will be big fans of that. Some won't be. It's not worth my time to coddle feelings.
The Federal Reserve had the opportunity to proclaim success. They could just take the win.
They didn't really slay inflation. The free market did the lion's share of the lifting. The cure for high prices is high prices. Don't we know that yet? If you prevent monopolies and oligopolies, high prices are very effective at driving more production. It can still be stopped by laws that may prohibit production (like cities blocking apartment buildings), but high prices are very effective at stimulating production.
Rather than taking the win and claiming they defeated inflation, they are moving the goal posts.
We'll get back to this. I feel a rant coming on.
If they admitted that inflation was clearly trending down, they would be pushed to lower rates. If they lowered rates, they wouldn't be adding as many hundreds of billions to the national debt by compounding interest expense.
No, higher rates do not stop the government from spending your money.
For those of you who are divorced, did higher rates cause your ex to stop spending your money?
Did anything?
So explain this concept to me:
Anyone see a problem with that theory? Maybe in step 3?
Perhaps I should just ask if anyone actually believes that's how money works. Because raising rates hasn't incentivized a cut in government spending once in the last 80 years. There was a period when raising rates sent deficit spending much higher. That was under Reagan. Surging rates resulted in surging unemployment. Unemployment leads to weaker tax revenues and drives spending on welfare programs.
I don't know if everyone remembers this, but unemployed people tend to pay less in income taxes.
Which party likes deficit spending?
All of them.
The color of their jersey doesn't matter. They all run up the deficit. It's been over 2 decades since we had a surplus. We won't have another in the foreseeable future.
I suspect we'll see deficits break $2 trillion per year (again) before we see them under $500 billion per year.
The new goal posts were related to seeing inflation figures broaden to other categories like housing and services, rather than being concentrated on goods.
Housing data for the CPI (Consumer Price Index) is severely lagged. Consequently, it would take a long time for it to get low.
It helps the Federal Reserve by smoothing out changes in actual market prices. When they can stuff some data into it the calculations that was both delayed and smoothed, it creates the appearance of more stable numbers. One of the funny things here is that higher interest rates actually increase housing inflation.
Remember that "inflation" defines housing based on the rent, not based on the price of the home. When interest rates are higher, it discourages the production of new apartment buildings. New apartment buildings are the most efficient way to increase the total volume of housing. How do you reduce rental rates? You increase the supply faster than the demand.
Some people only want single-family housing, but many people will pick based on the prices.
We currently have a surge of new supply coming to the market. It was started in 2021 and 2022 because of low interest rates.
Now that rates are much higher, there are vastly fewer new projects breaking ground. However, the completions will still be rolling through for over a year.
It should be pretty obvious that when a typical mortgage costs over $4k per month, the landlords can charge higher rents. The tenant wants to live underneath a roof, but the mortgage payment is high. The existing landlord often has cheaper financing locked in, but the tenant cannot buy without paying market rate on a new mortgage.
Yes, I'm excluding buyers who can pay for cash. Why? Because buyers who can pay cash for a home are not living in an apartment today.
Higher rates have pushed down the value of apartment buildings. Did that make housing "cheaper"? No, rents are not cheaper. Single-family homes are not cheaper. What is the long-term impact? Less production. Why? Because profits on producing apartments is lower. I feel like these concepts are pretty obvious.
I wouldn't expect several cuts to the target rates unless the forecast also includes a recession. The credit spreads imply that the market thinks a recession is pretty unlikely, though I haven't ruled it out. I generally encourage investors to avoid basing their investment decisions on trying to forecast interest rates anyway. It's fine for interest rate expectations to influence decisions, but it shouldn't be dominating the thought process. No one knows for sure what the Federal Reserve will do with short-term rates. However, my guess is that they will follow through on their commentary.
We will close out the rest of the article with the tables and charts we provide for readers to help them track the sector for both common shares and preferred shares.
We're including a quick table for the common shares that will be shown in our tables:
Type of REIT or BDC | ||||
Residential Agency | Residential Hybrid | Residential Originator and Servicer | Commercial | BDC |
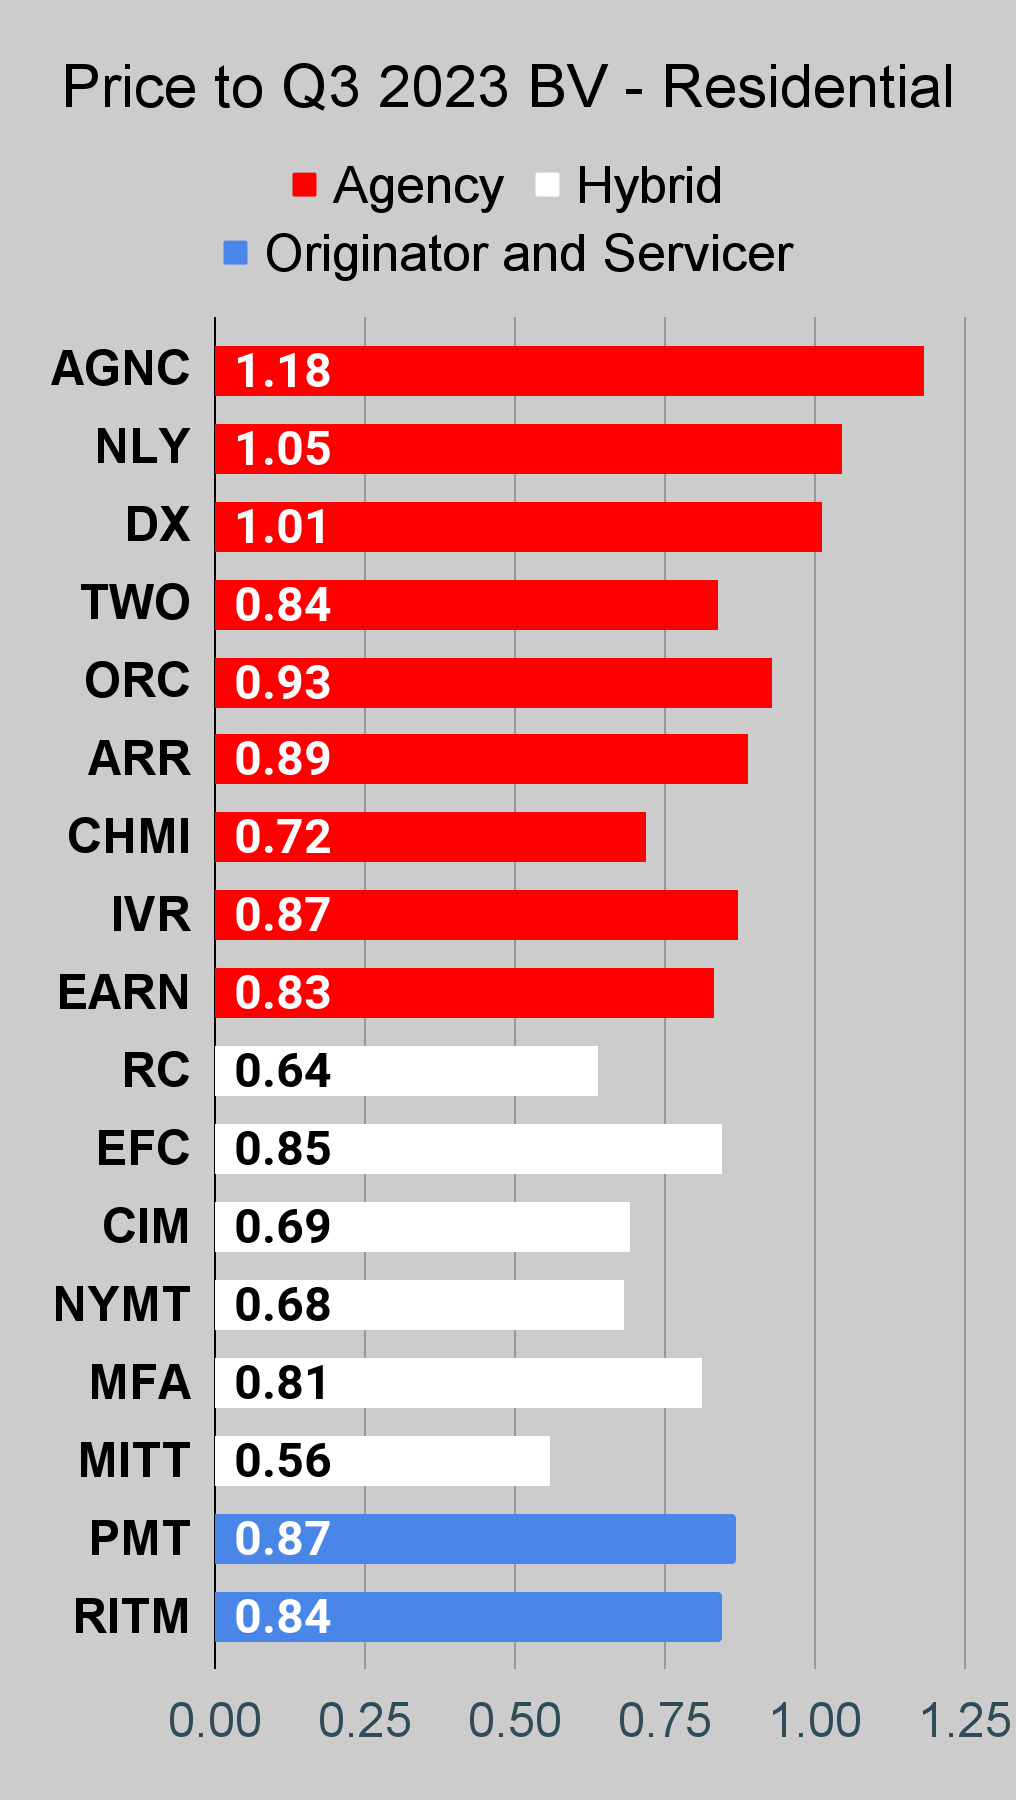
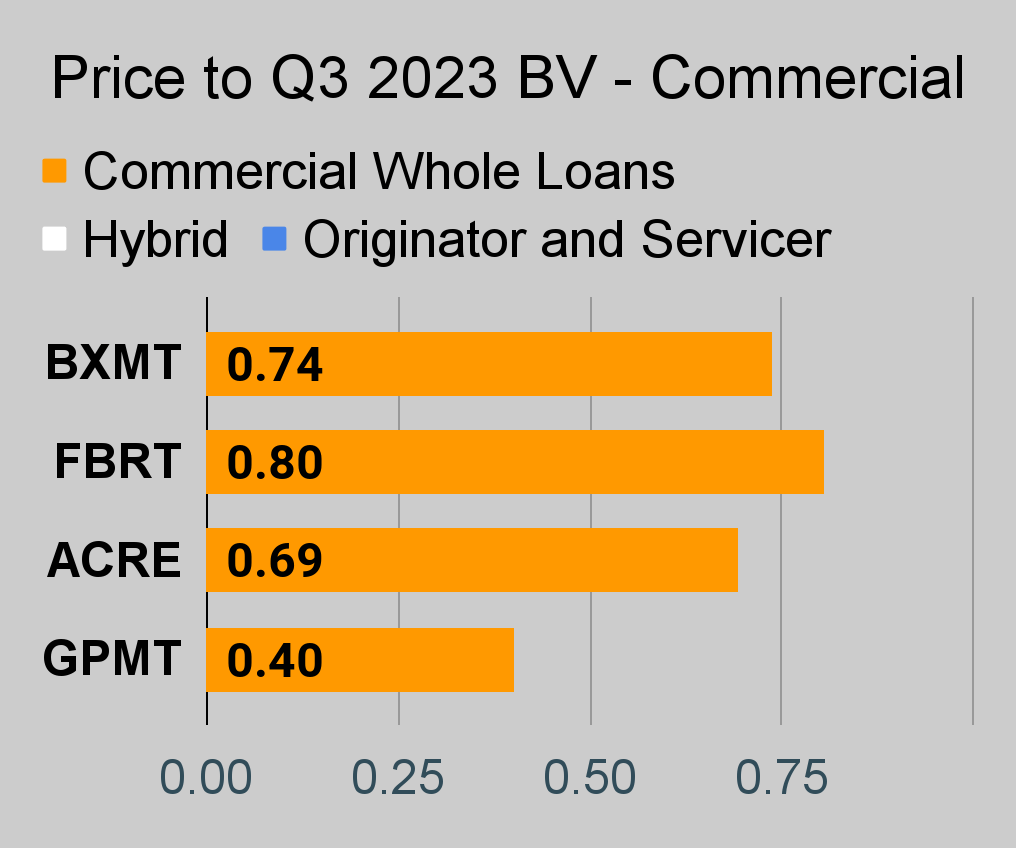
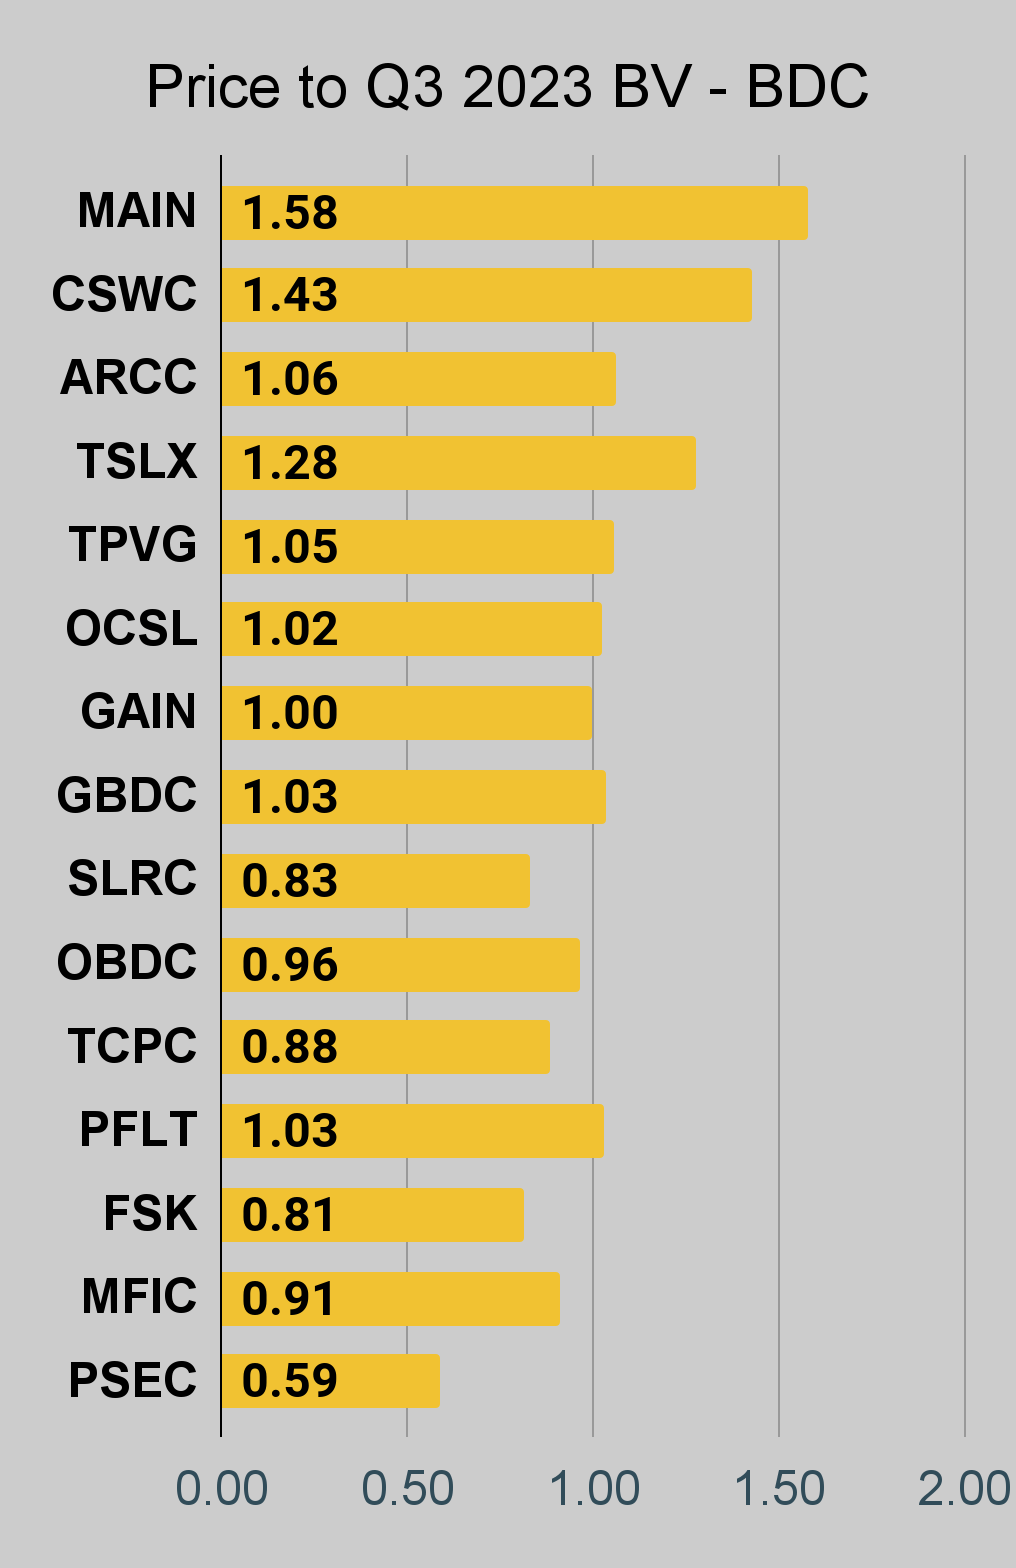
If you're looking for a stock that I haven't mentioned yet, you'll still find it in the charts below. The charts contain comparisons based on price-to-book value, dividend yields, and earnings yield. You won't find these tables anywhere else.
For mortgage REITs, please look at the charts for AGNC, NLY, DX, ORC, ARR, CHMI, TWO, IVR, EARN, CIM, EFC, NYMT, MFA, MITT, AAIC, PMT, RITM, BXMT, GPMT, WMC, and RC.
For BDCs, please look at the charts for MAIN, CSWC, ARCC, TSLX, TPVG, OCSL, GAIN, GBDC, SLRC, OBDC, PFLT, TCPC, FSK, PSEC, and MFIC.
This series is the easiest place to find charts providing up-to-date comparisons across the sector.
Within each type of security, the sorting is usually based on risk ratings. However, it is quite common to have a few shares that are tied. When the shares are tied for risk rating, the sorting becomes arbitrary. There may occasionally be errors where a share's position is not updated quickly following a change in the risk rating. That can happen because the charts come from a separate system. When I update the system we use for members, it doesn't change the order in the charts.
When I say "within each type of security", I'm referencing categories such as "agency mortgage REITs". The "hybrid mortgage REITs" are all listed after the "agency mortgage REITs". However, that does not mean RC (lowest hybrid) has a higher risk rating than the highest agency mortgage REIT. Each batch is presented by themselves.
PMT and RITM are tied for risk rating.
Finally, there's an outlier. We don't cover EARN. However, it was frequently requested for this series. Consequently, I added it to the charts. The important part here is that EARN was never assigned a risk rating. Since it has no assigned risk rating, it got lumped in at the top. However, I do not believe EARN would actually get a higher risk rating than IVR. I believe EARN would actually be less risky than IVR.
This could probably be written better. If someone feels inclined to take it upon themselves to write a section that is objectively better at communicating these points, I would be interested in using it. I'm grateful to have the best readers on SA. I attribute this to self-selection bias. I include enough things to offend the dumb people that I'm left with the best readers.
Note: The chart for our public articles uses the book value per share from the quarter indicated in the chart. We use the current estimated (proprietary estimates) book value per share to determine our targets and trading decisions. It is available in our service, but those estimates are not included in the charts below. PMT and NYMT are not showing an earnings yield metric as neither REIT provides a quarterly "Core EPS" metric. Presently, a few other REITs also have no consensus estimate.
Second Note: Due to the way historical amortized cost and hedging is factored into the earnings metrics, it is possible for two mortgage REITs with similar portfolios to post materially different metrics for earnings. I would be very cautious about putting much emphasis on the consensus analyst estimate (which is used to determine the earnings yield). In particular, throughout late 2022 the earnings metric became less comparable for many REITs.
 The REIT Forum | 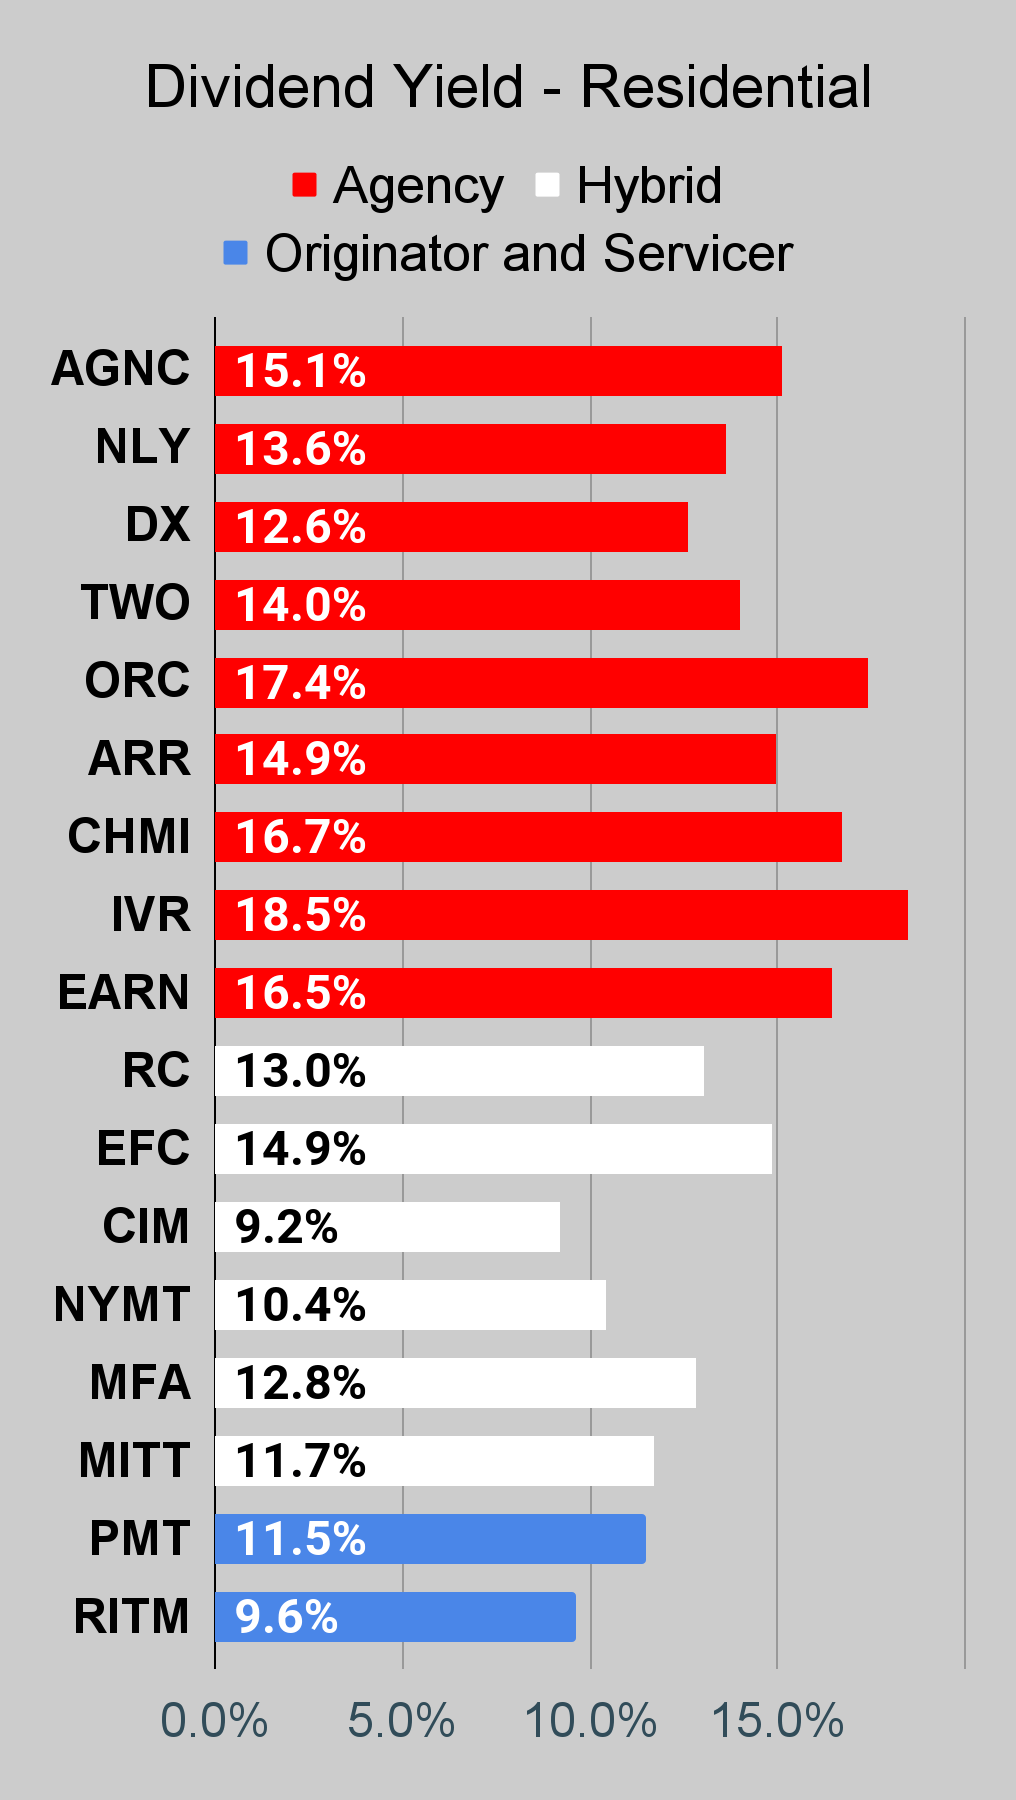 The REIT Forum | 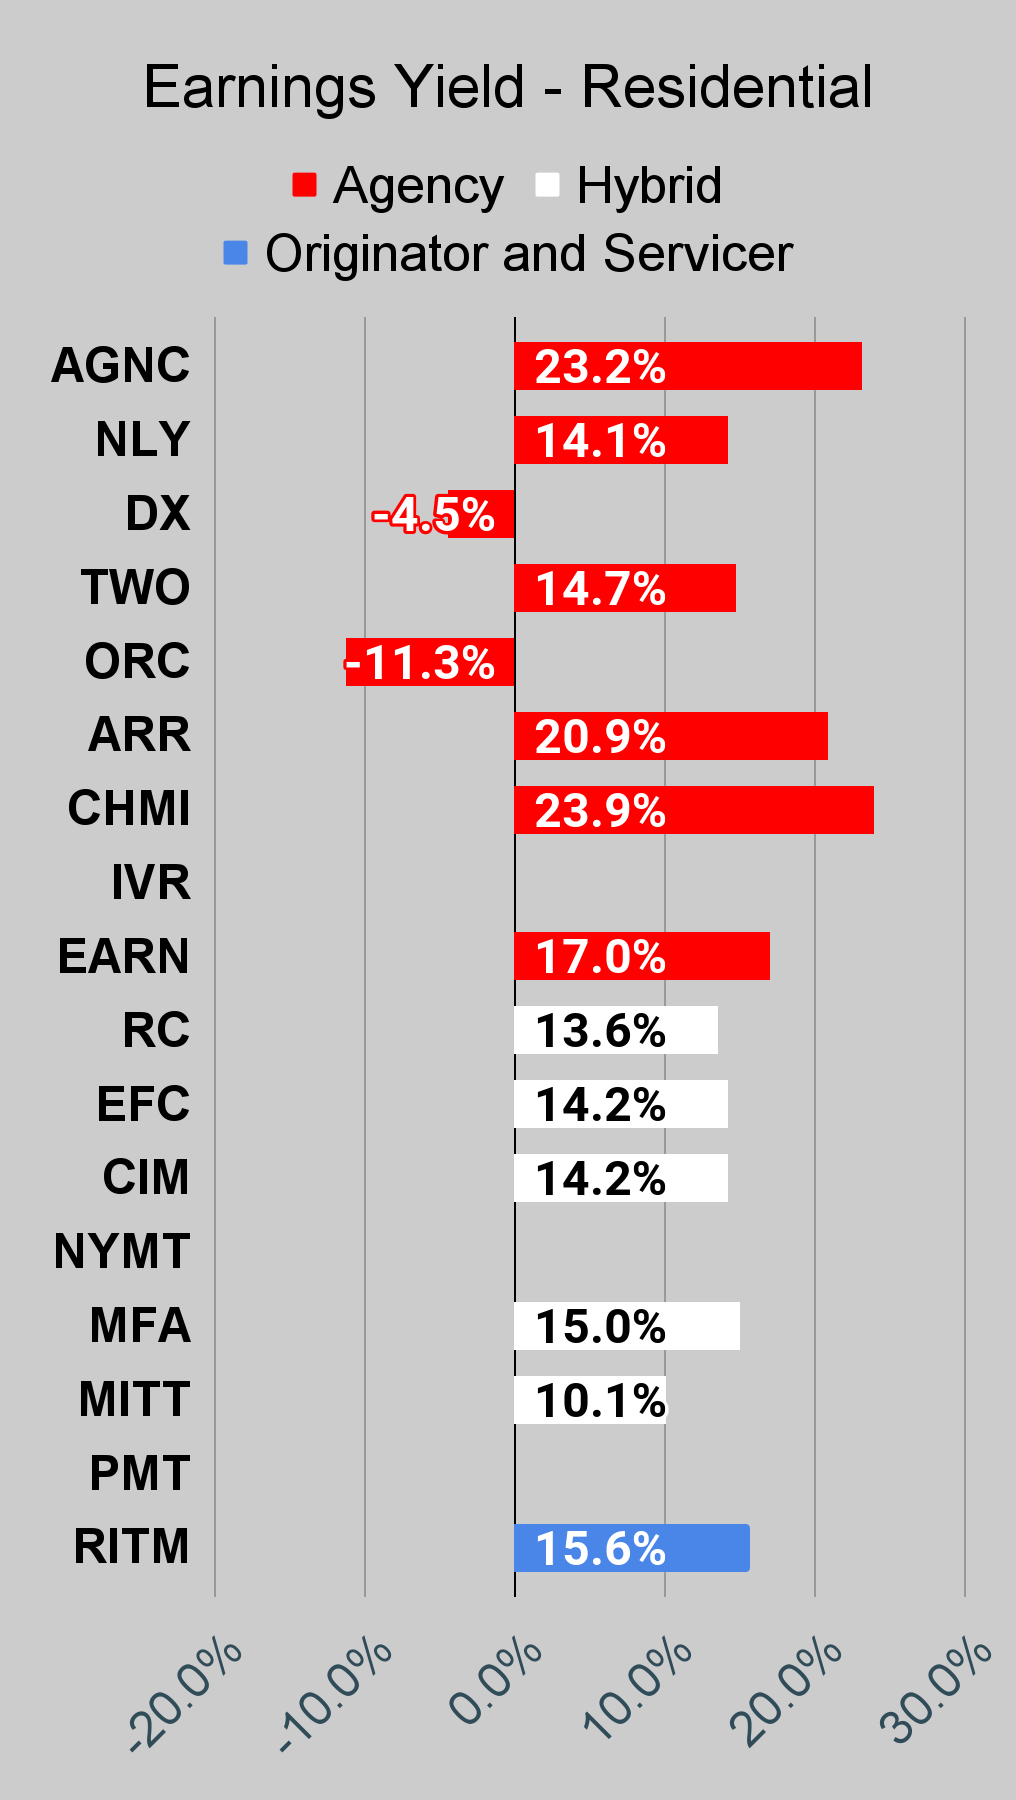 The REIT Forum |
 The REIT Forum | 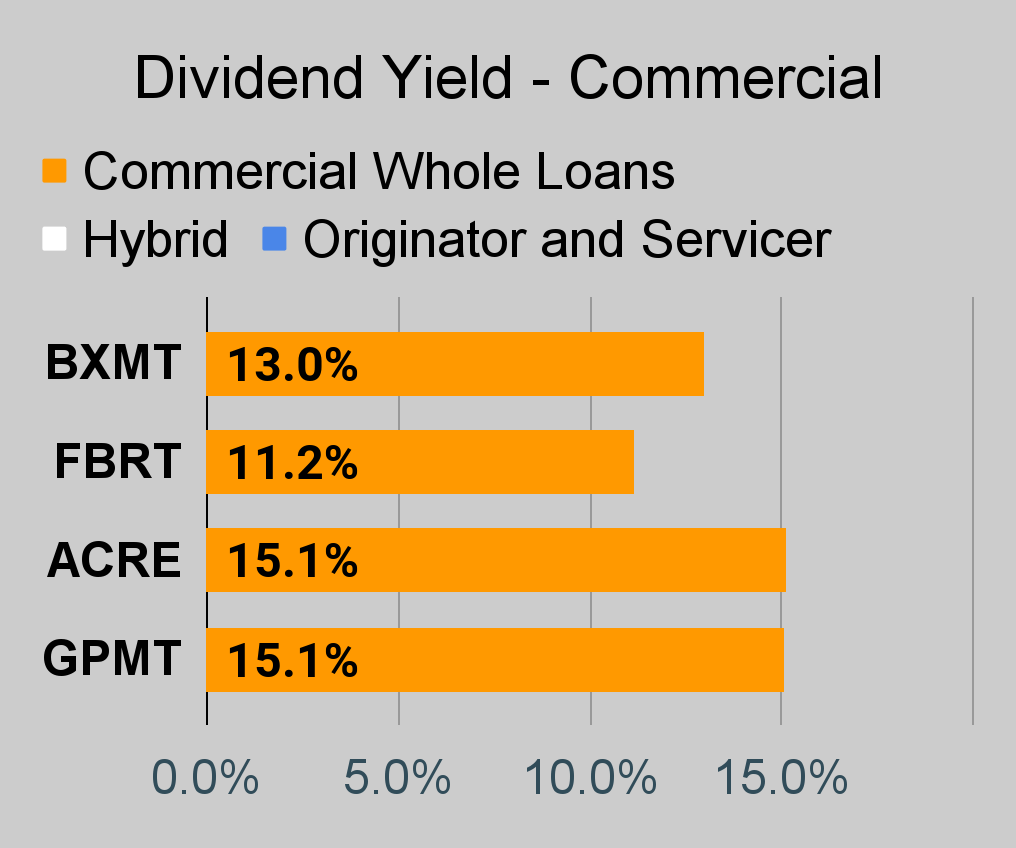 The REIT Forum | 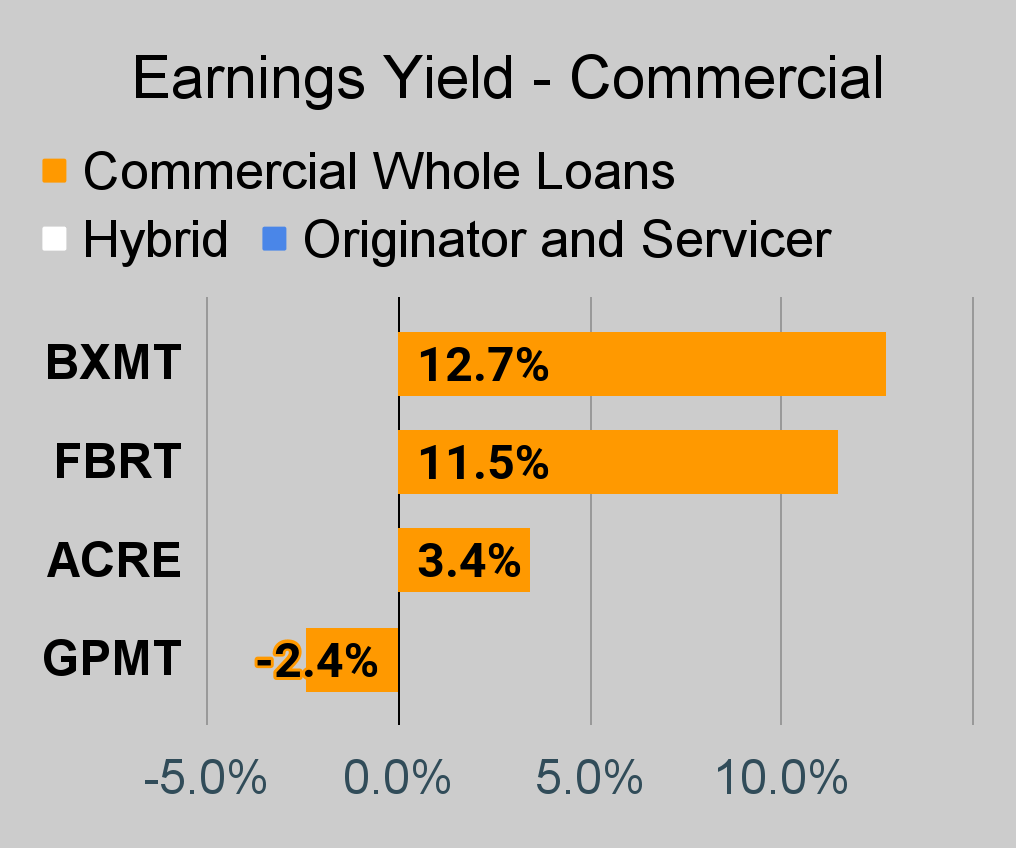 The REIT Forum |
 The REIT Forum | 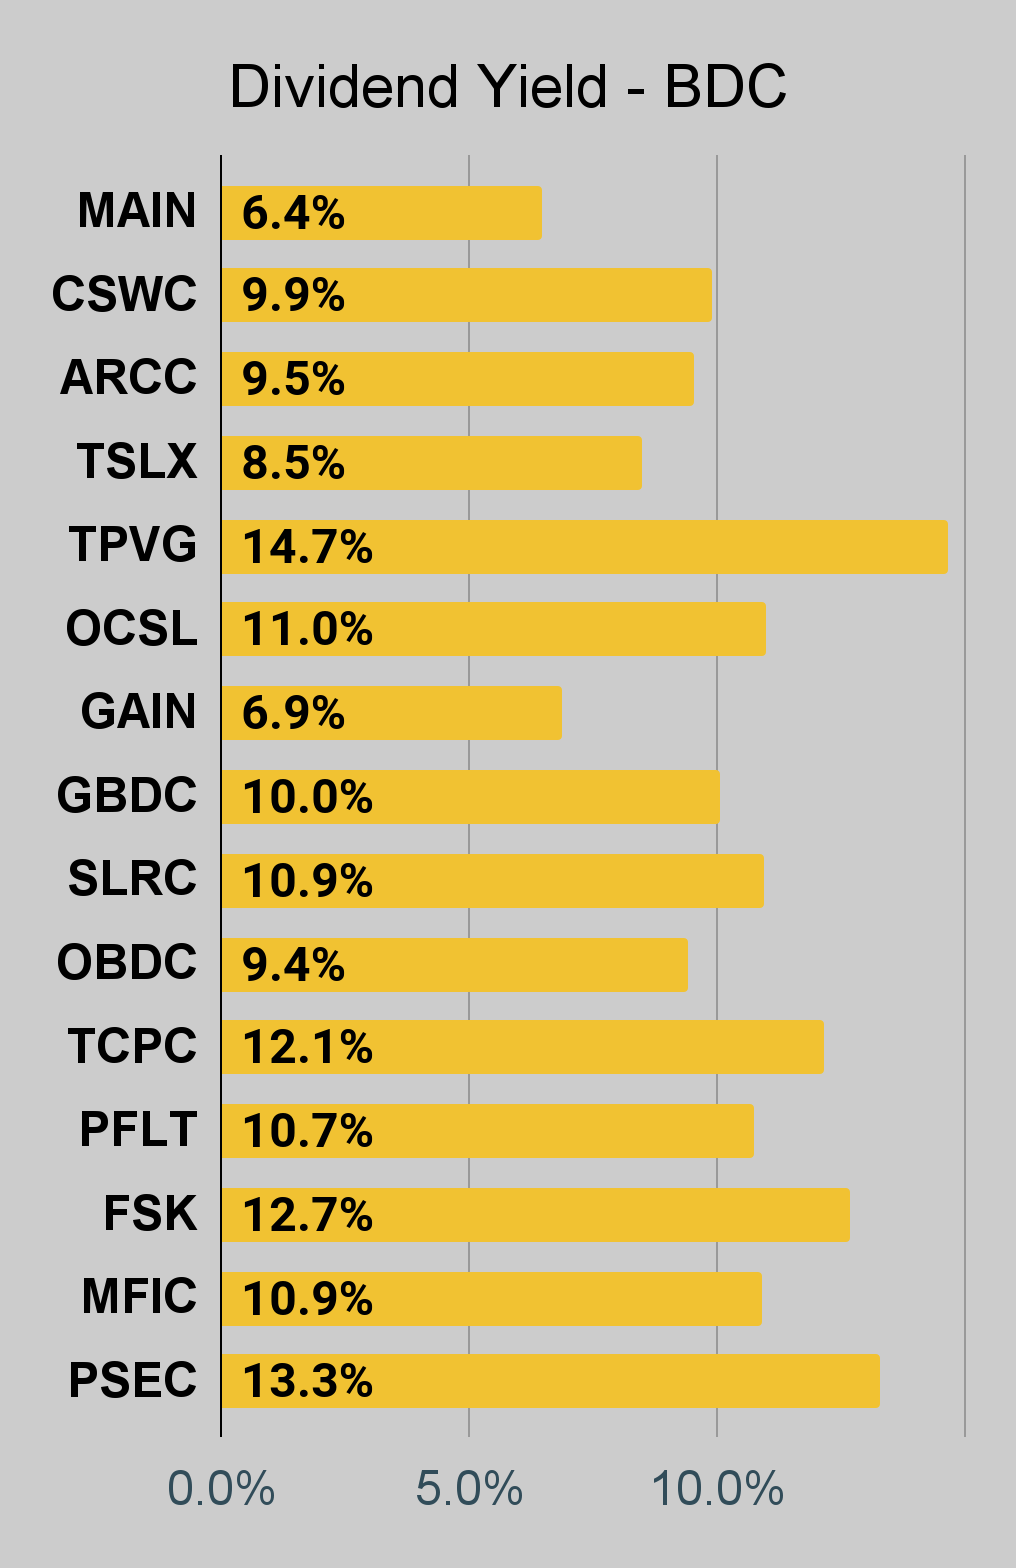 The REIT Forum | 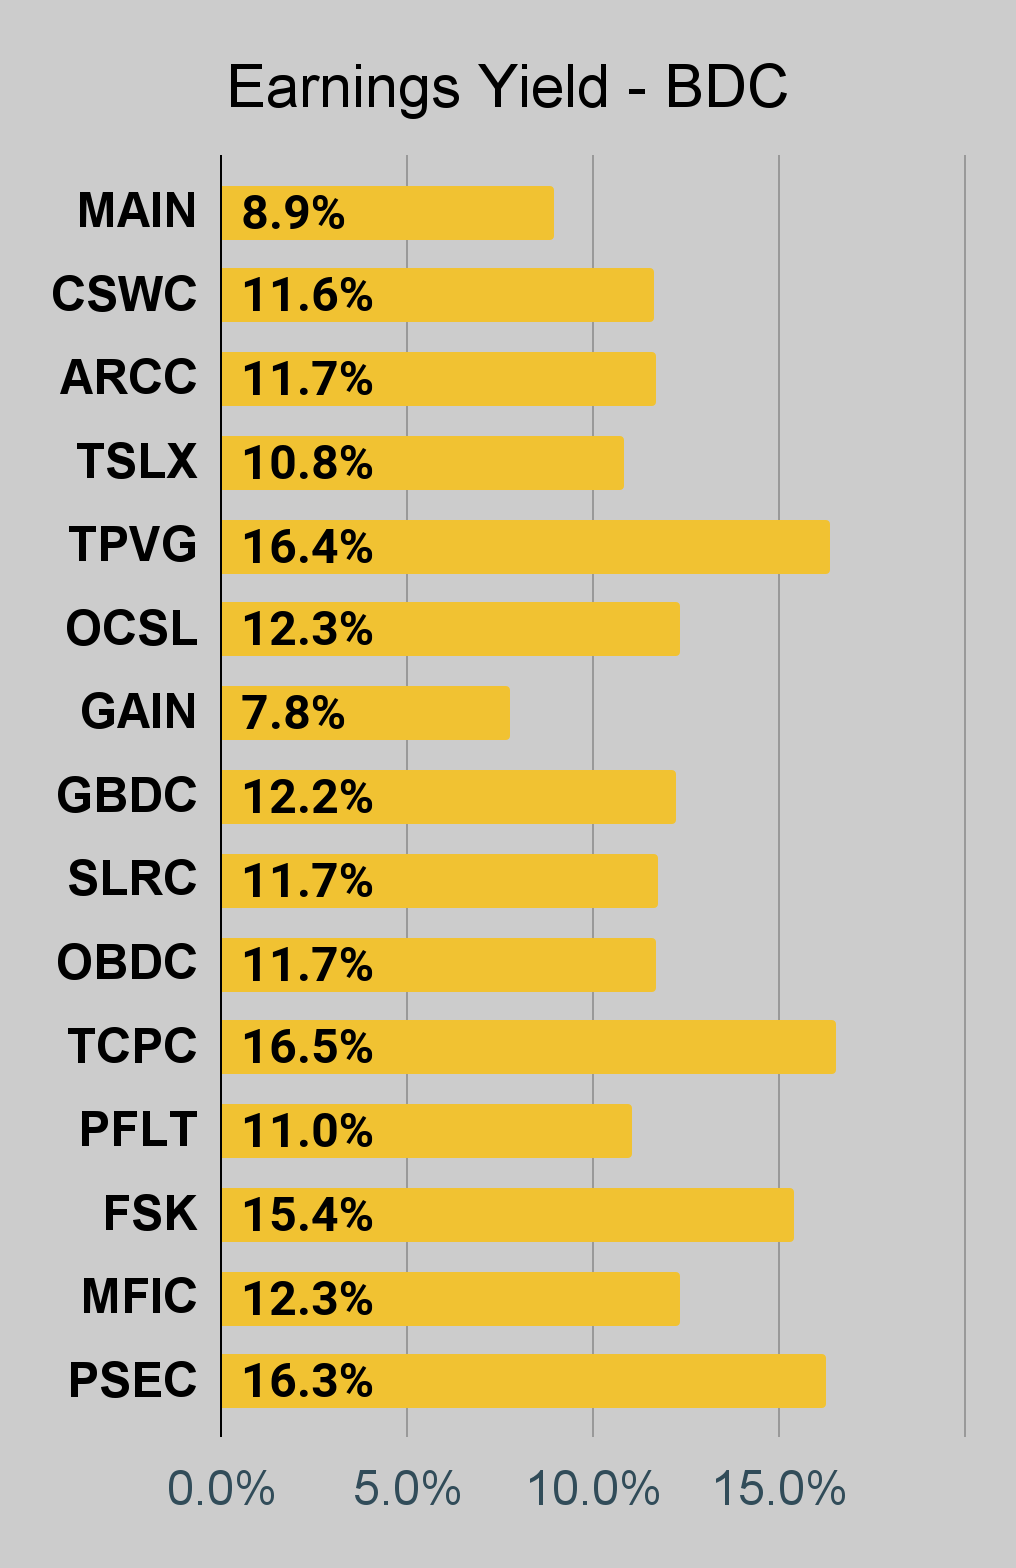 The REIT Forum |
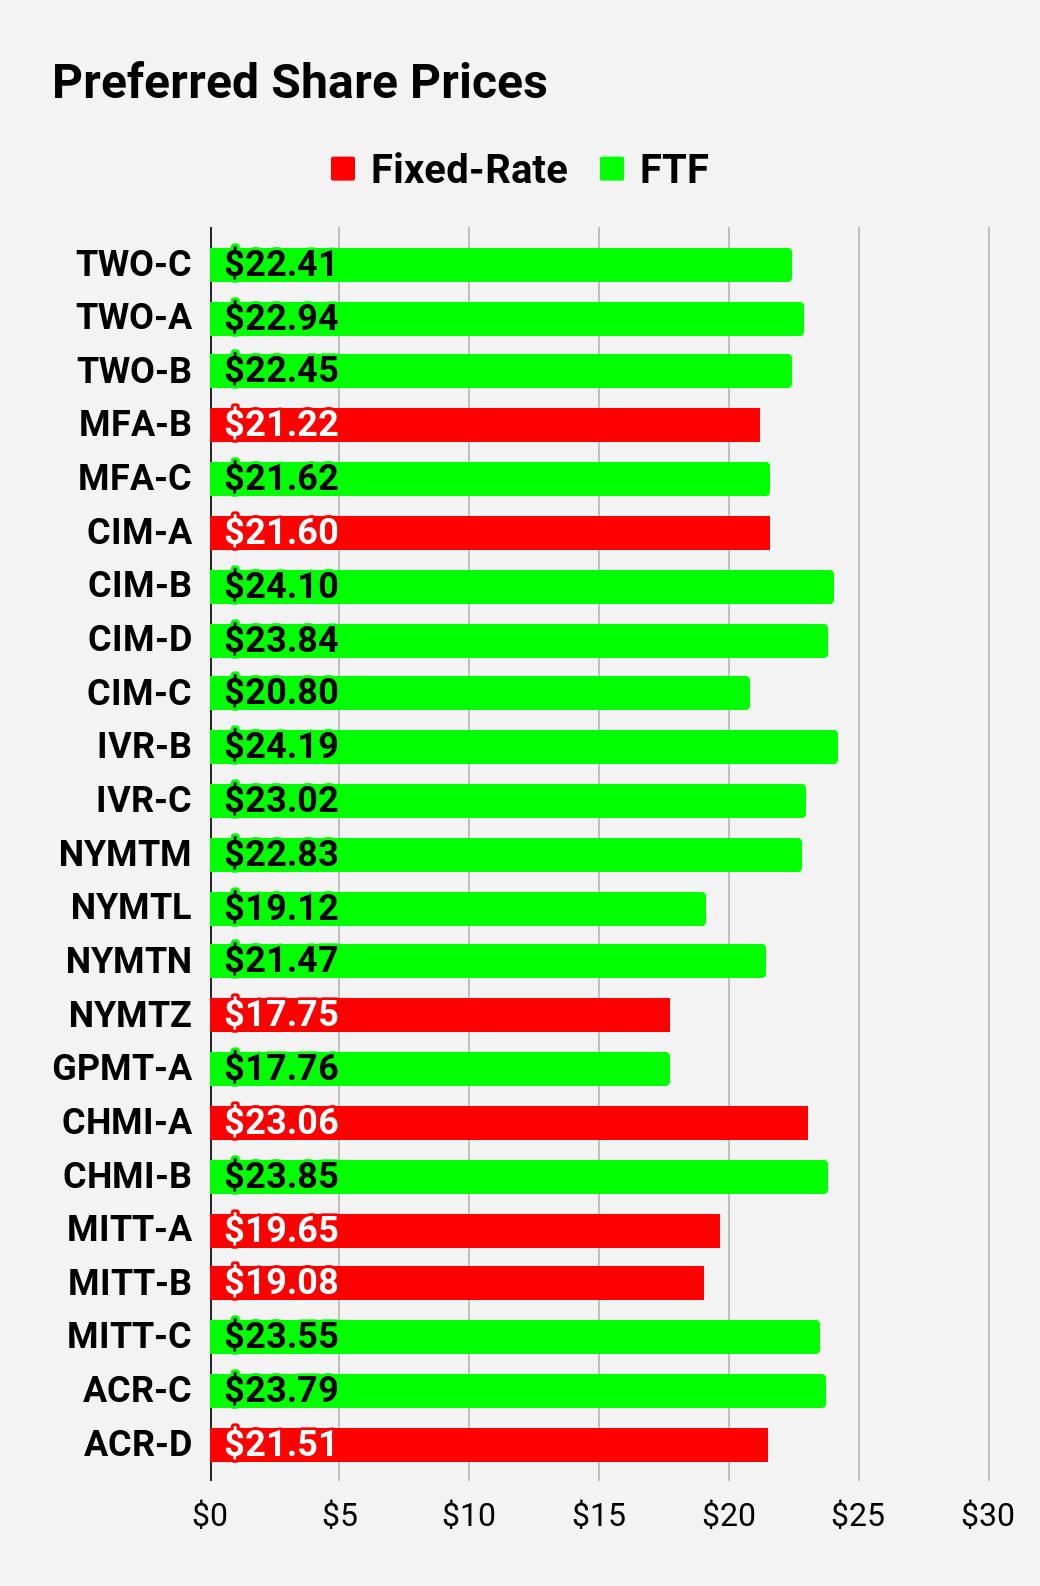
I changed the coloring a bit. We needed to adjust to include that the first fixed-to-floating shares have transitioned over to floating rates. When a share is already floating, the stripped yield may be different from the "Floating Yield on Price" due to changes in interest rates. For instance, NLY-F already has a floating rate. However, the rate is only reset once per 3 months. The stripped yield is calculated using the upcoming projected dividend payment and the "Floating Yield on Price" is based on where the dividend would be if the rate reset today. In my opinion, for these shares the "Floating Yield on Price" is clearly the more important metric.
 The REIT Forum | 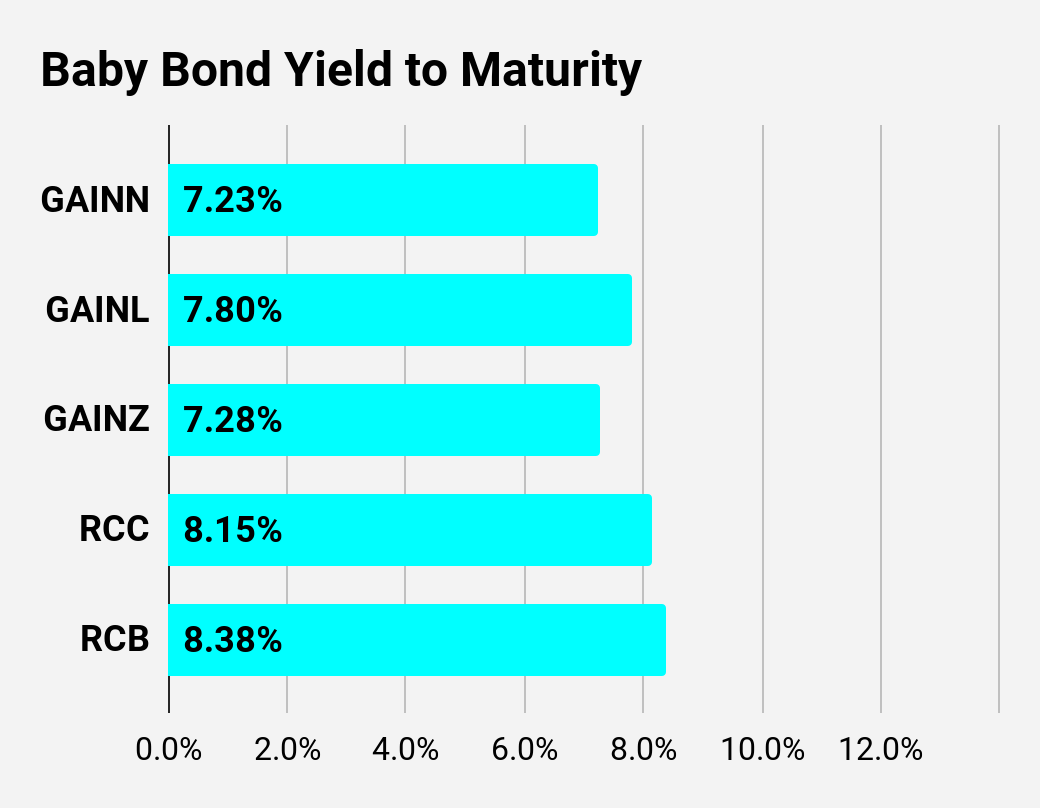 The REIT Forum | 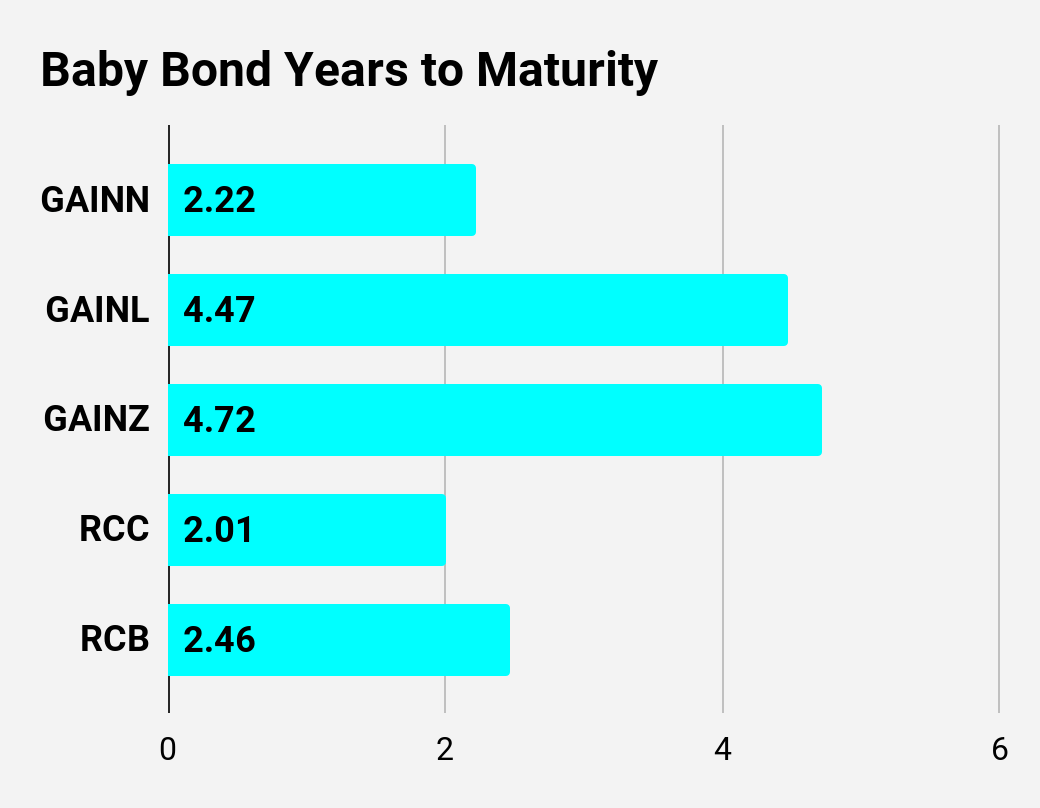 The REIT Forum |
 The REIT Forum | 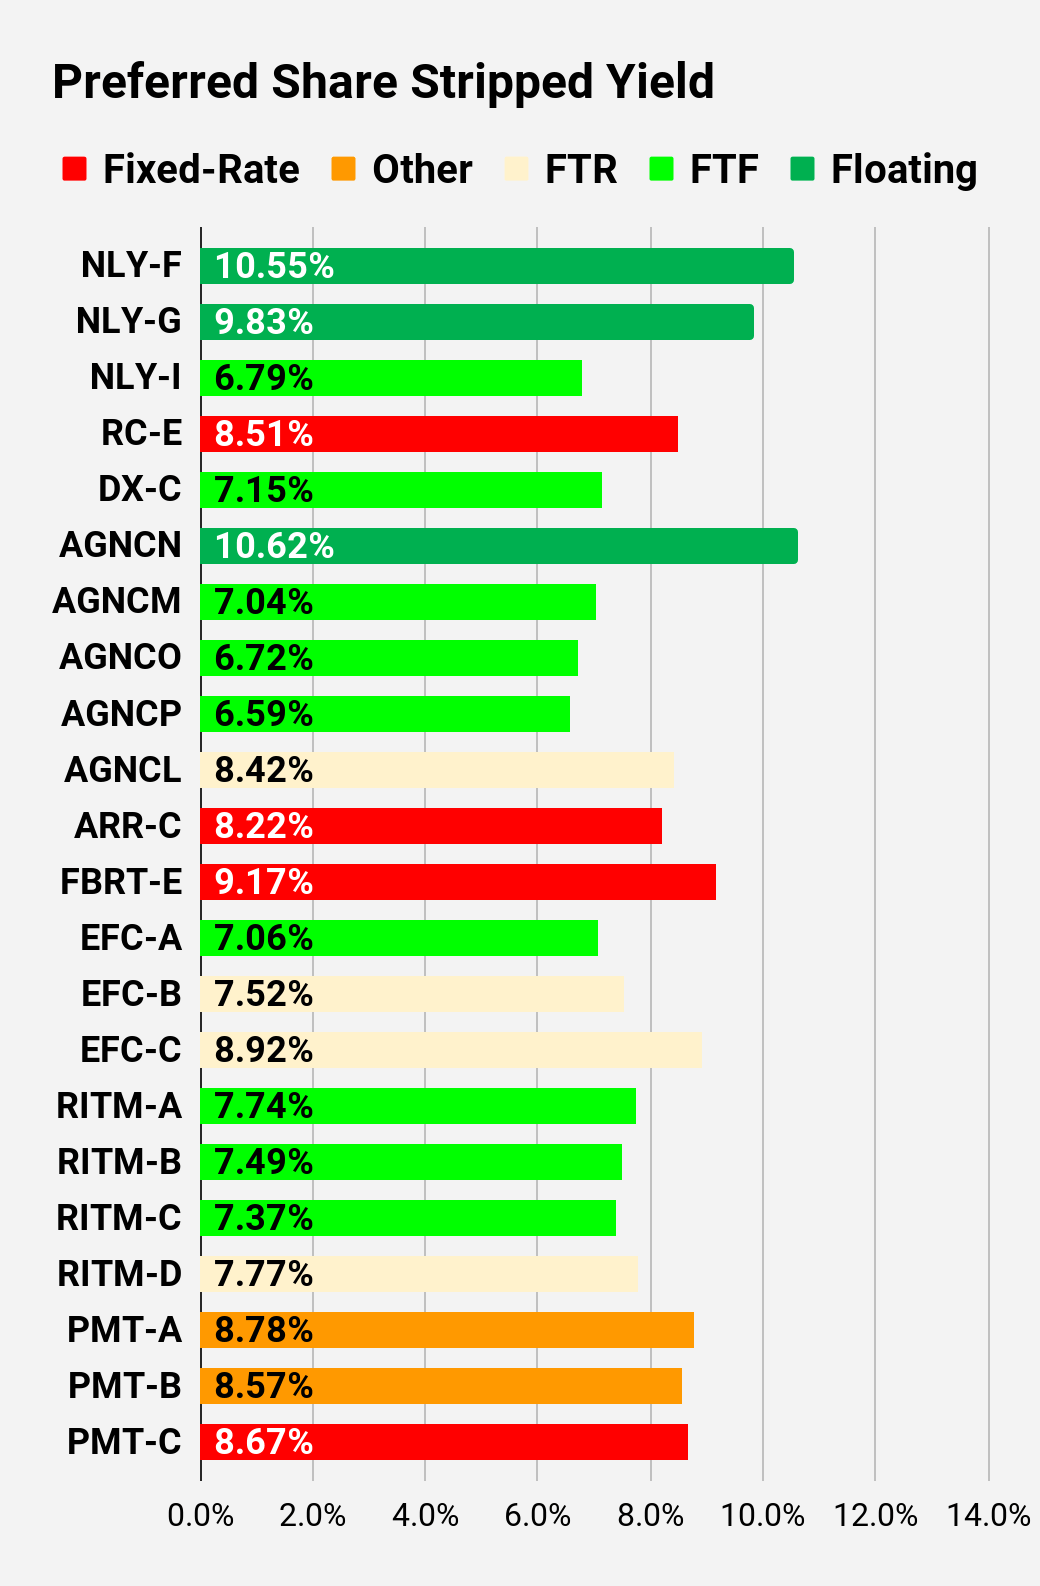 The REIT Forum | 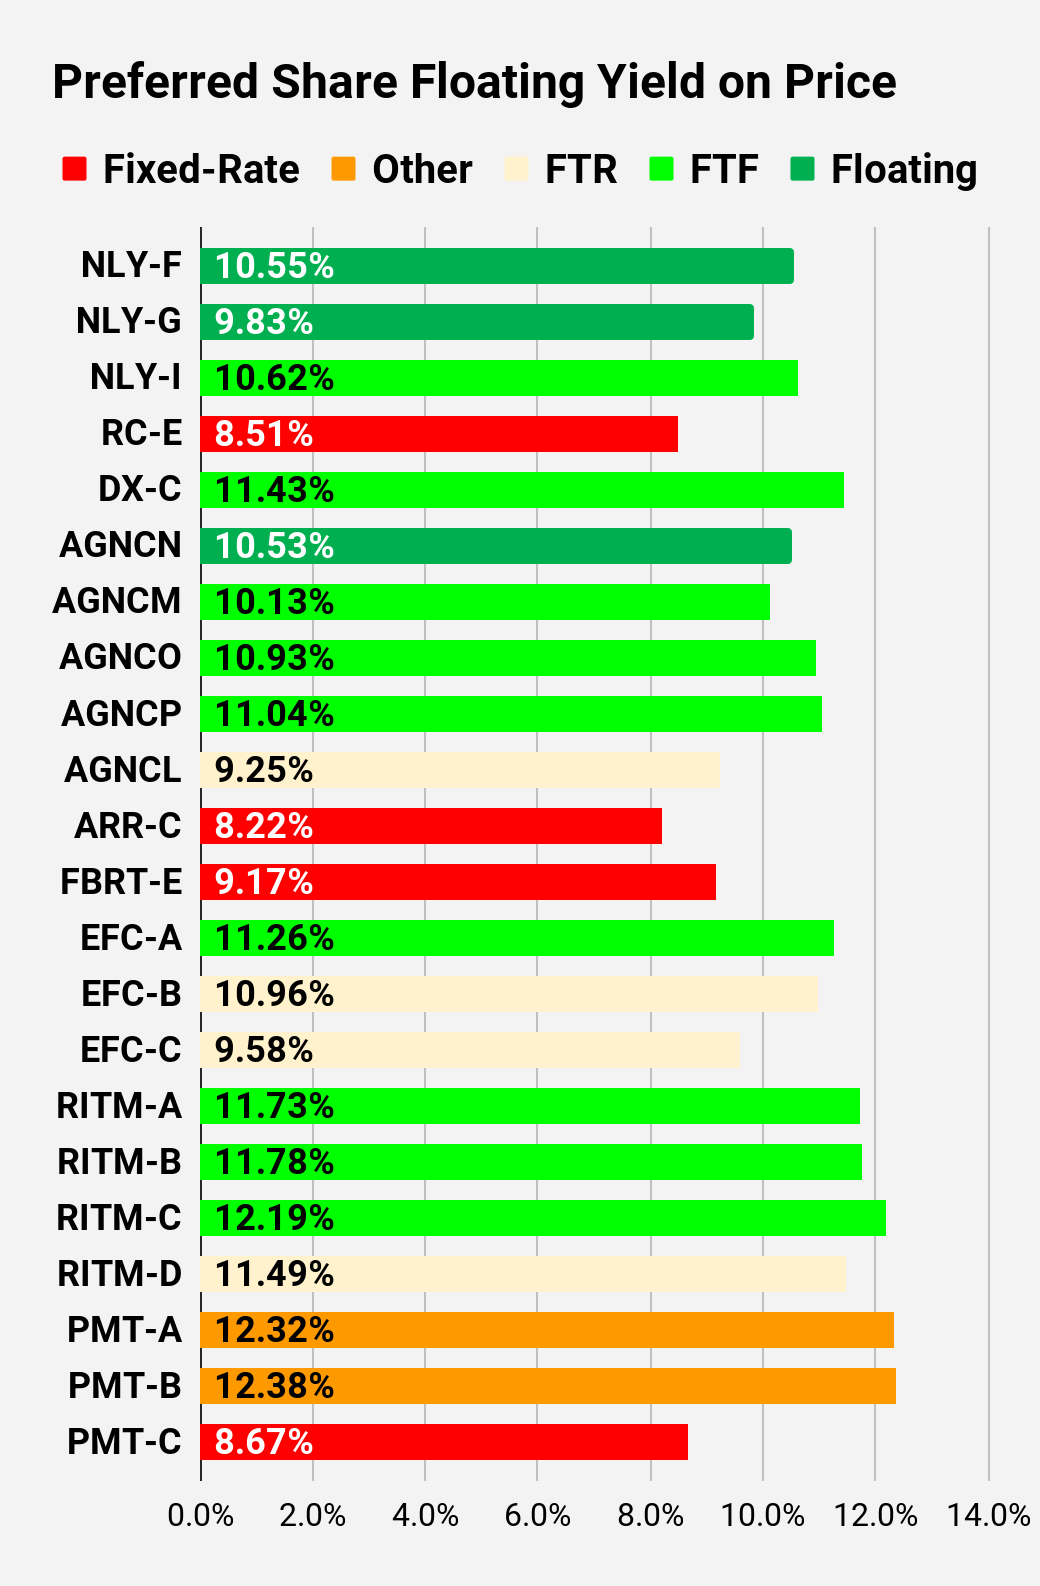 The REIT Forum |
 The REIT Forum | 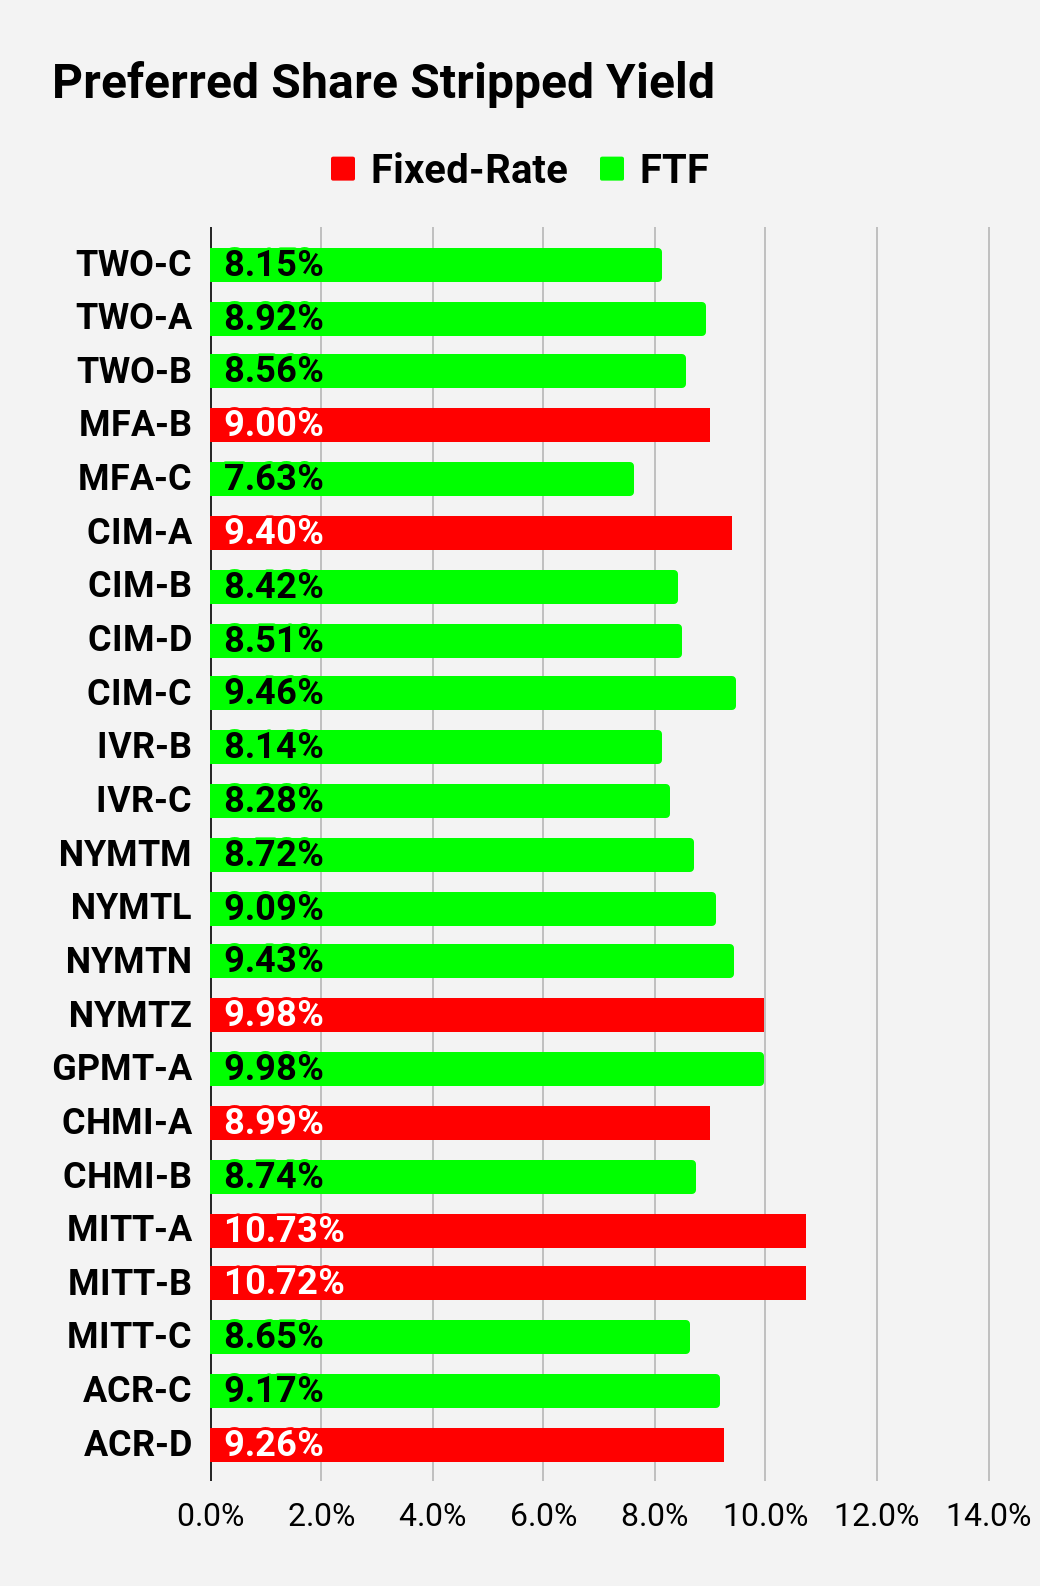 The REIT Forum | 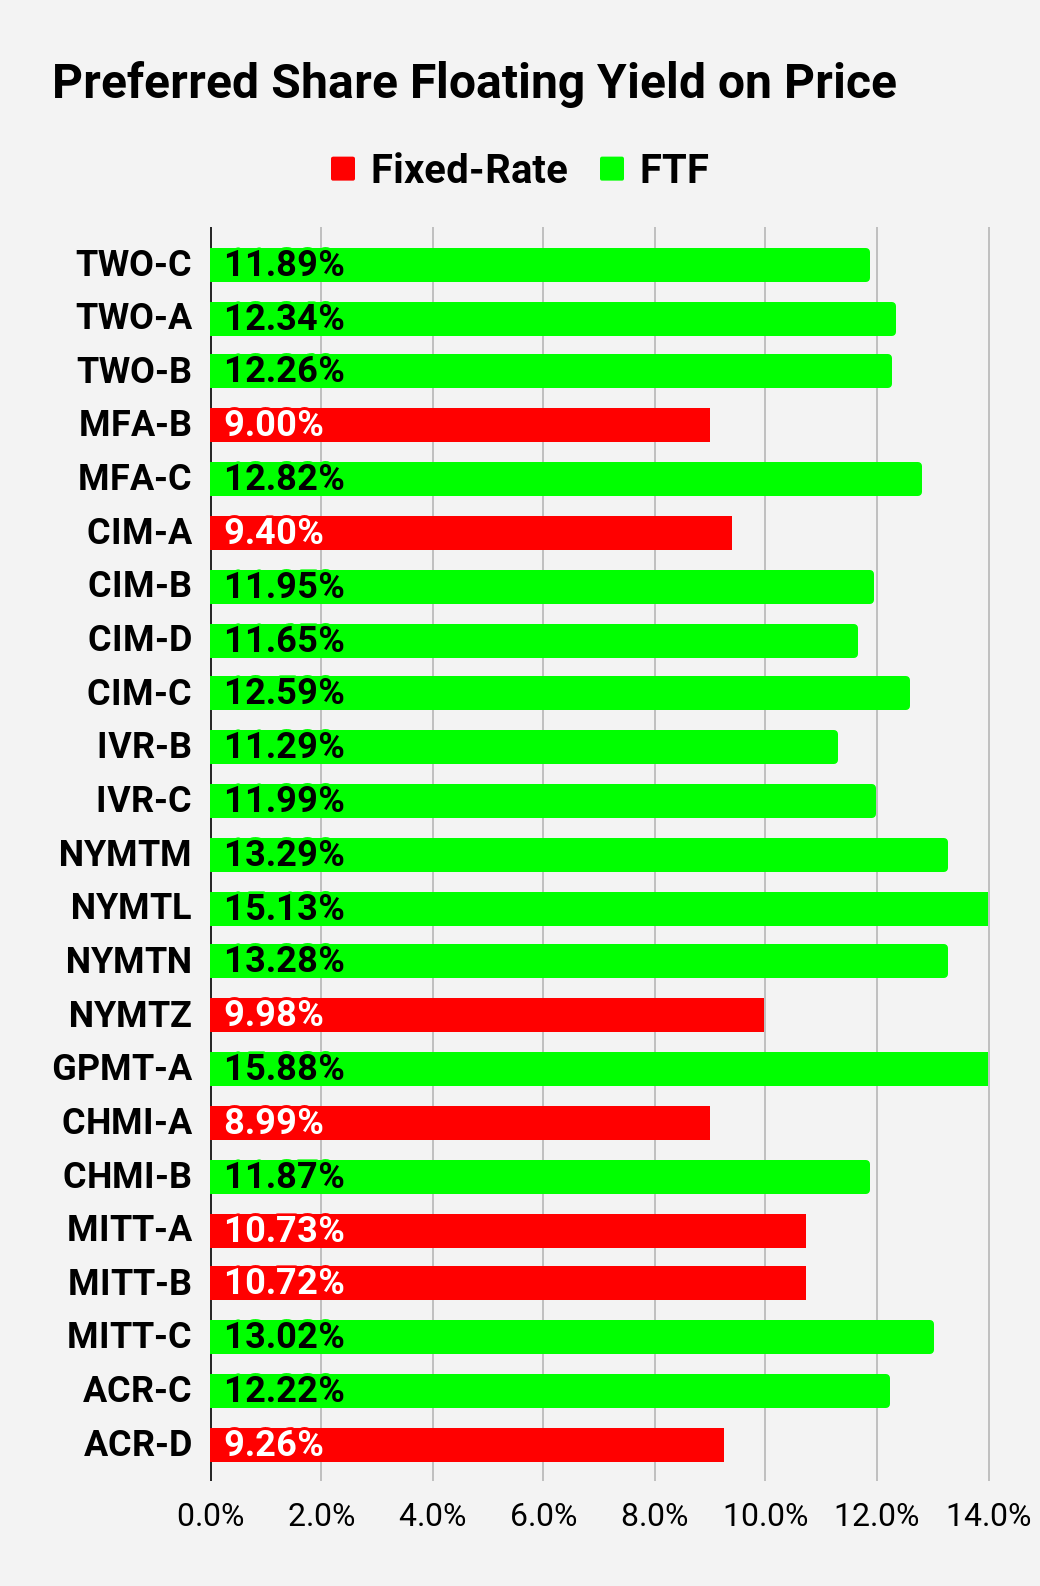 The REIT Forum |
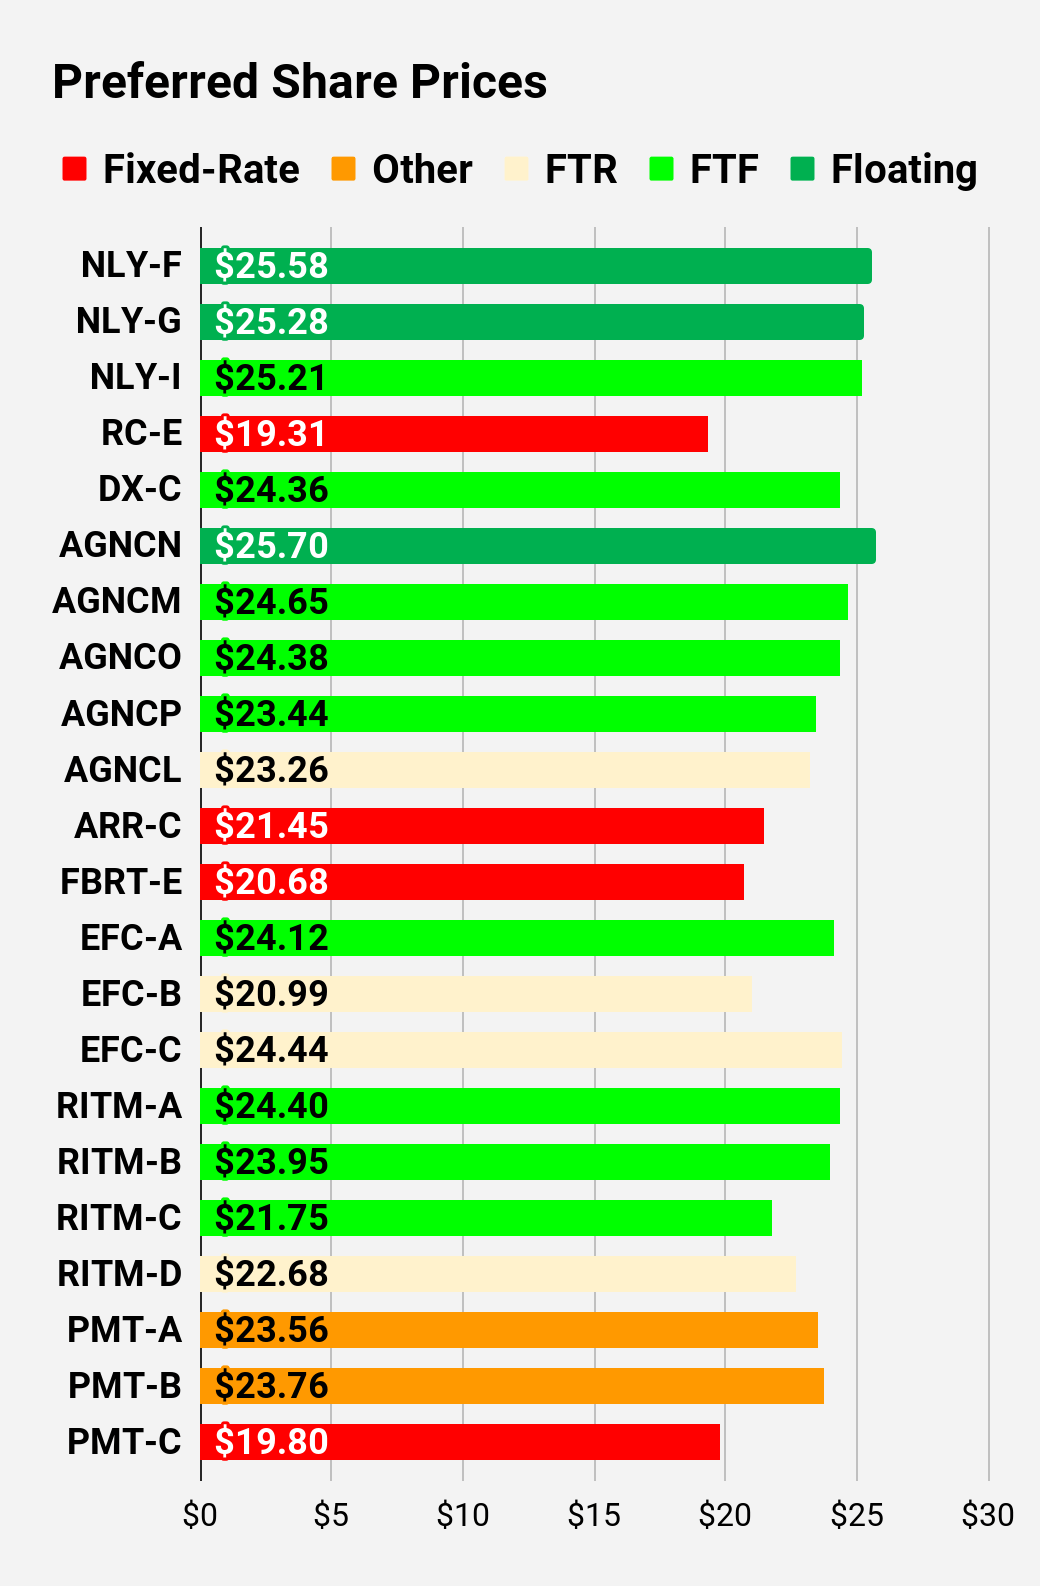
Note: Shares that are classified as "Other" are not necessarily the same. Within our service, we provide further distinction. For the purpose of these charts, I lumped all of them together as "Other". Now there are only two left, PMT-A and PMT-B. Those both have the same issue. Management claims the shares will be fixed-rate, even though the prospectus says they should be fixed-to-floating.
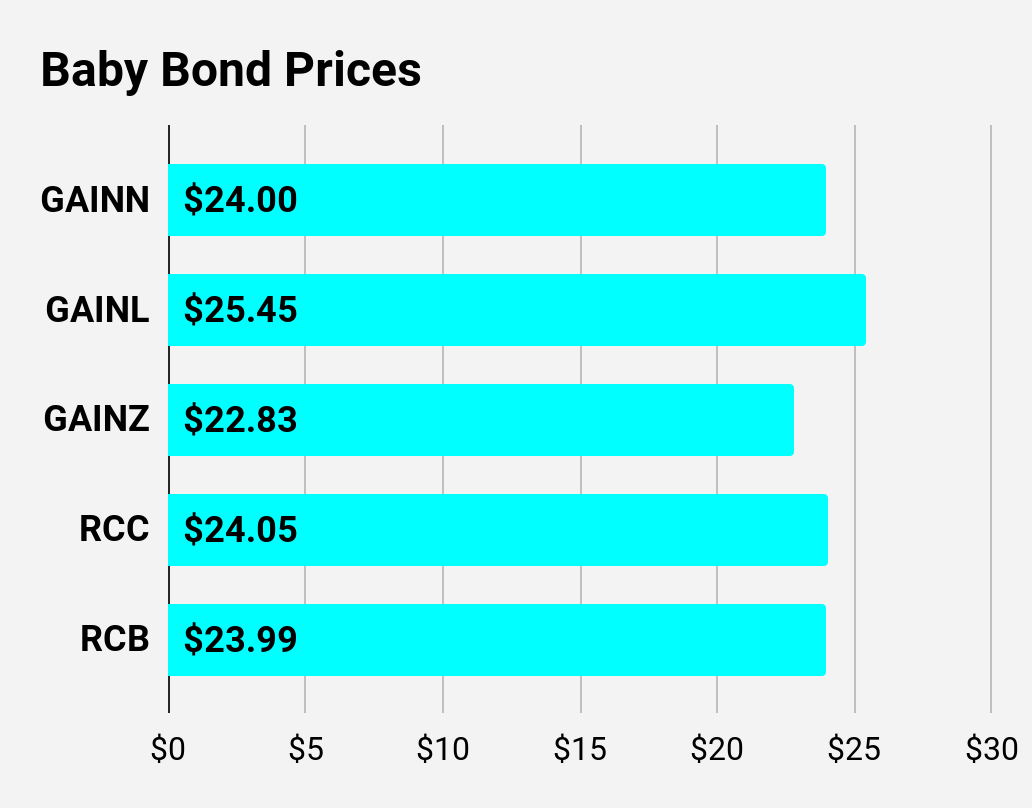
Beyond the charts, we're also providing our readers with access to several other metrics for the preferred shares.
After testing out a series on preferred shares, we decided to try merging it into the series on common shares. After all, we are still talking about positions in mortgage REITs. We don't have any desire to cover preferred shares without cumulative dividends, so any preferred shares you see in our column will have cumulative dividends. You can verify that by using Quantum Online. We've included the links in the table below.
To better organize the table, we needed to abbreviate column names as follows:
Ticker | Price | S-Yield | Coupon | FYoP | NCD | WCC | QO Link | P-Link |
$24.00 | 7.23% | 5.00% | 7.23% | 3/13/2024 | $1.15 | |||
$25.45 | 7.80% | 8.00% | 7.80% | 8/1/2025 | $2.56 | |||
$22.83 | 7.28% | 4.88% | 7.28% | 3/13/2024 | $2.32 | |||
$24.05 | 8.15% | 5.75% | 8.15% | 3/13/2024 | $1.12 | |||
$23.99 | 8.38% | 6.20% | 8.38% | 3/13/2024 | $1.20 |
Second batch:
Ticker | Price | S-Yield | Coupon | FYoP | NCD | WCC | QO Link | P-Link |
$25.58 | 10.55% | 10.56% | 10.55% | 3/13/2024 | -$0.04 | |||
$25.28 | 9.83% | 9.74% | 9.83% | 3/13/2024 | $0.22 | |||
$25.21 | 6.79% | 6.75% | 10.62% | 6/30/2024 | $0.64 | |||
$19.31 | 8.51% | 6.50% | 8.51% | 6/10/2026 | $9.54 | |||
$24.36 | 7.15% | 6.90% | 11.43% | 4/15/2025 | $2.80 | |||
$25.70 | 10.62% | 10.78% | 10.53% | 3/13/2024 | -$0.25 | |||
$24.65 | 7.04% | 6.88% | 10.13% | 4/15/2024 | $0.79 | |||
$24.38 | 6.72% | 6.50% | 10.93% | 10/15/2024 | $1.86 | |||
$23.44 | 6.59% | 6.13% | 11.04% | 4/15/2025 | $3.49 | |||
$23.26 | 8.42% | 7.75% | 9.25% | 10/15/2027 | $9.03 | |||
$21.45 | 8.22% | 7.00% | 8.22% | 1/28/2025 | $5.31 | |||
$20.68 | 9.17% | 7.50% | 9.17% | 3/13/2024 | $4.63 | |||
$24.12 | 7.06% | 6.75% | 11.26% | 10/30/2024 | $2.16 | |||
$20.99 | 7.52% | 6.25% | 10.96% | 1/30/2027 | $8.72 | |||
$24.44 | 8.92% | 8.63% | 9.58% | 4/30/2028 | $9.75 | |||
$20.96 | 8.46% | 7.00% | 8.46% | 3/13/2024 | $4.31 | |||
$25.00 | 8.36% | 8.25% | 11.38% | 3/30/2024 | $0.41 | |||
$24.40 | 7.74% | 7.50% | 11.73% | 8/15/2024 | $1.56 | |||
$23.95 | 7.49% | 7.13% | 11.78% | 08/15/2024 | $1.96 | |||
$21.75 | 7.37% | 6.38% | 12.19% | 02/15/2025 | $4.87 | |||
$22.68 | 7.77% | 7.00% | 11.49% | 11/15/2026 | $7.15 | |||
$23.56 | 8.78% | 8.13% | 12.32% | 3/15/2024 | $1.95 | |||
$23.76 | 8.57% | 8.00% | 12.38% | 6/15/2024 | $2.25 | |||
$19.80 | 8.67% | 6.75% | 8.67% | 8/24/2026 | $9.75 |
Third batch:
Ticker | Price | S-Yield | Coupon | FYoP | NCD | WCC | QO Link | P-Link |
$22.41 | 8.15% | 7.25% | 11.89% | 1/27/2025 | $4.40 | |||
$22.94 | 8.92% | 8.13% | 12.34% | 4/27/2027 | $8.66 | |||
$22.45 | 8.56% | 7.63% | 12.26% | 7/27/2027 | $9.22 | |||
$21.22 | 9.00% | 7.50% | 9.00% | 3/13/2024 | $4.17 | |||
$21.62 | 7.63% | 6.50% | 12.82% | 3/31/2025 | $5.42 | |||
$21.60 | 9.40% | 8.00% | 9.40% | 3/13/2024 | $3.81 | |||
$24.10 | 8.42% | 8.00% | 11.95% | 3/30/2024 | $1.41 | |||
$23.84 | 8.51% | 8.00% | 11.65% | 3/30/2024 | $1.67 | |||
$20.80 | 9.46% | 7.75% | 12.59% | 9/30/2025 | $7.61 | |||
$24.19 | 8.14% | 7.75% | 11.29% | 12/27/2024 | $2.76 | |||
$23.02 | 8.28% | 7.50% | 11.99% | 9/27/2027 | $9.03 | |||
$22.83 | 8.72% | 7.88% | 13.29% | 1/15/2025 | $4.15 | |||
$19.12 | 9.09% | 6.88% | 15.13% | 10/15/2026 | $10.61 | |||
$21.47 | 9.43% | 8.00% | 13.28% | 10/15/2027 | $11.04 | |||
$17.75 | 9.98% | 7.00% | 9.98% | 1/15/2027 | $12.51 | |||
$17.76 | 9.98% | 7.00% | 15.88% | 11/30/2026 | $12.27 | |||
$23.06 | 8.99% | 8.20% | 8.99% | 3/13/2024 | $2.20 | |||
$23.85 | 8.74% | 8.25% | 11.87% | 4/15/2024 | $1.60 | |||
$19.65 | 10.73% | 8.25% | 10.73% | 3/13/2024 | $5.81 | |||
$19.08 | 10.72% | 8.00% | 10.72% | 3/13/2024 | $6.36 | |||
$23.55 | 8.65% | 8.00% | 13.02% | 9/17/2024 | $2.92 | |||
$23.79 | 9.17% | 8.63% | 12.22% | 7/30/2024 | $2.30 | |||
$21.51 | 9.26% | 7.88% | 9.26% | 5/21/2026 | $8.04 |
Strategy
Our goal is to maximize total returns. We achieve those most effectively by including "trading" strategies. We regularly trade positions in the mortgage REIT common shares and BDCs because:
We also allocate to preferred shares and equity REITs. We encourage buy-and-hold investors to consider using more preferred shares and equity REITs.