
da-kuk
da-kuk
Palantir Technologies Inc. (NYSE:PLTR) has experienced remarkable growth, surpassing expectations and lifting the stock from its previous low valuation. However, it's crucial to thoroughly analyze the risks and opportunities inherent in the current elevated price levels. This article delves into a potential trading opportunity, examining possible outcomes while maintaining a balanced perspective on risk. It advocates for active risk management, considering factors such as the industry landscape and broader equity market conditions.
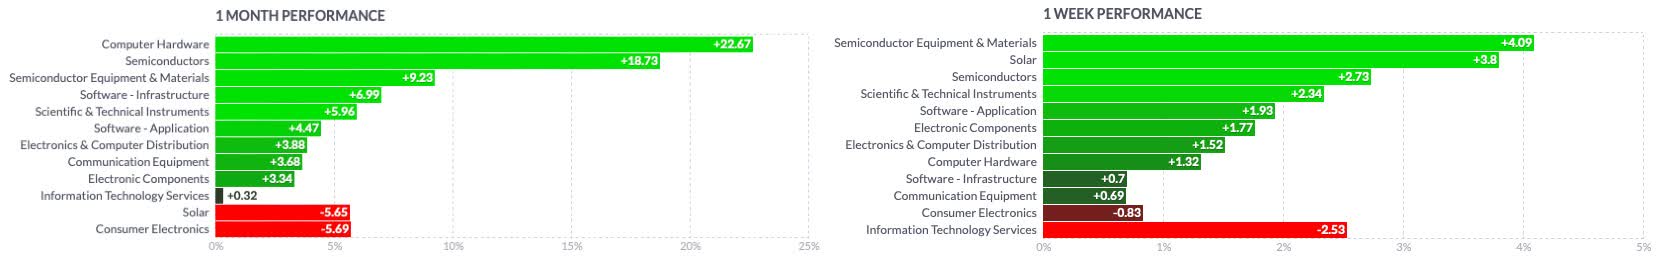
Over the last year, the technology sector in the US has showcased impressive advancement, serving as a pivotal driver of economic expansion and driving the equity market to new historical highs. Notably, industries such as semiconductors, computer hardware, software infrastructure, and application software emerged as standout performers. This remarkable growth owes much to the development and proliferation of Artificial Intelligence (AI) and Machine Learning (ML) technologies, cutting-edge software applications, which are increasingly integrated in many aspects of our lives. These technologies have revolutionized data analytics and decision-making processes, bolstering the efficiency and effectiveness of various industries. Furthermore, the increasing integration of the Internet of Things (IoT) and efforts towards comprehensive network connectivity and digitalization have significantly propelled these sectors towards sustained profitability.
However, as I observed in this article centered on a general market outlook, this exuberant rally could remind the enthusiasm in the equity market witnessed during the dotcom bubble, as especially the S&P 500 (SP500), is held up by a small number of mega-caps, which represent only 1.6% of the total stocks in the index. At this point, it is reasonable to question the sustainability of the past rapid expansion, while some industries have recently given some signs of weakness.
finviz finviz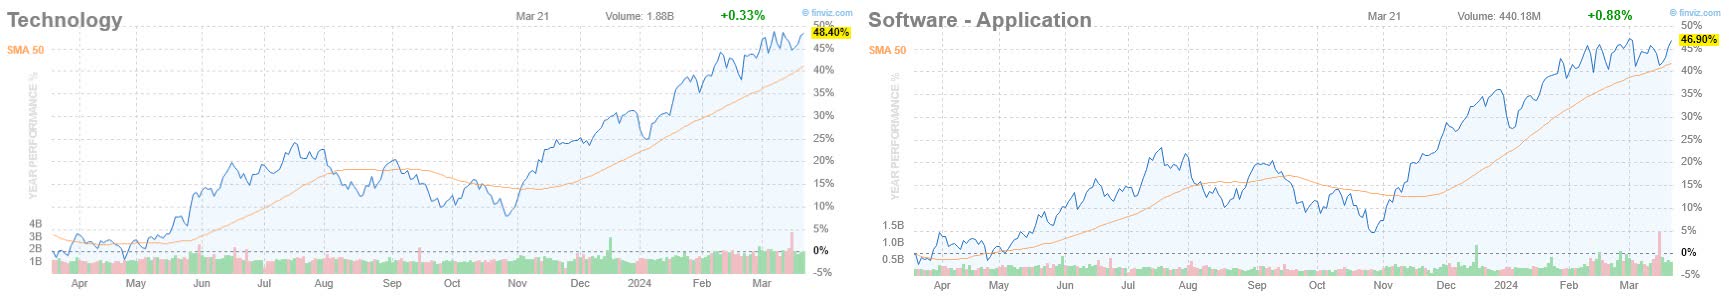
The iShares Expanded Tech-Software Sector ETF (IGV) is currently in the final phase of a five-wave impulse sequence, a pattern confirmed by its wave structure, which has propelled the benchmark close to its All-Time-High (ATH) at $89.76. Following a significant downturn after reaching its peak in November 2021, spurred by a rapid post-pandemic recovery rally, the industry reference experienced substantial losses.
However, recent developments suggest signs of exhaustion in IGV's momentum. Relative strength compared to the broader equity market, as represented by the iShares Russell 2000 ETF (IWM), has peaked, and the extended Moving Average Convergence Divergence (MACD) momentum indicator has experienced a bearish crossdown. It remains to be seen whether the current rally possesses sufficient momentum to propel IGV beyond its ATH or if a substantial correction is necessary for investors to digest the preceding bull run. Additionally, the recent surge lacks robust buying pressure, as evidenced by the peaking On Balance Volume (OBV), which might invert and break down from its moving average, a situation not observed since the peak in 2021, which led to a 47% decline.
Author, using TradingView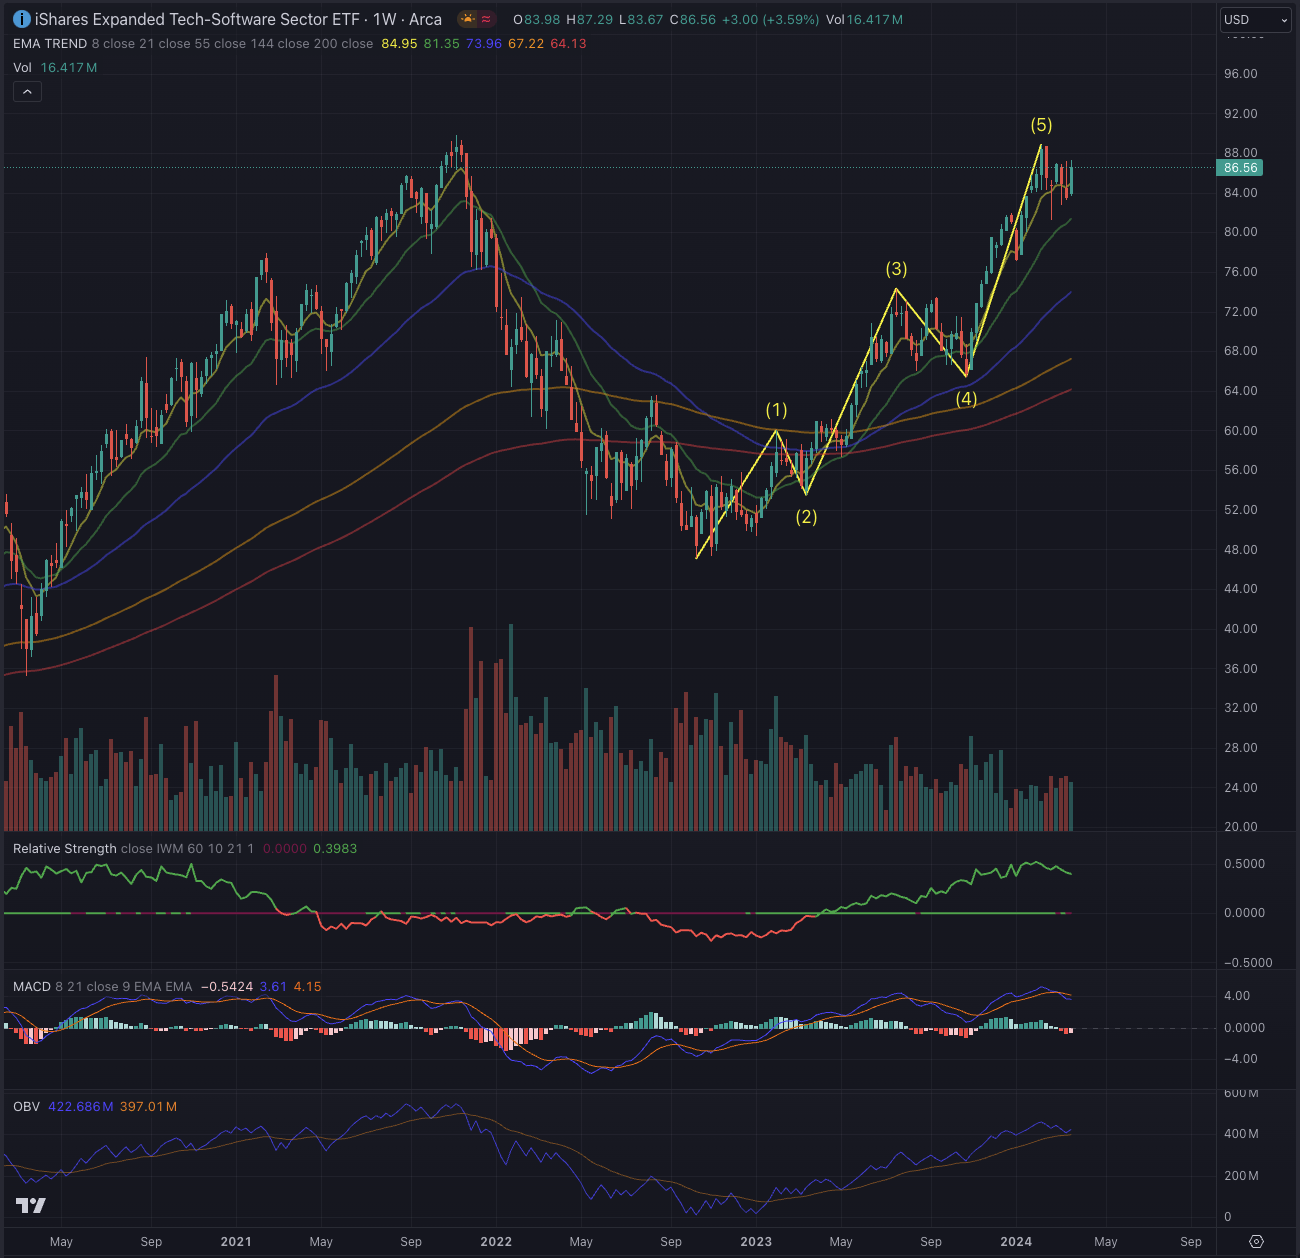
Upon analyzing the weekly chart, it's apparent that PLTR has conformed to a classic cup formation pattern and may be forming the handle phase. The stock's momentum has been fueled by robust buying interest, which is evident in the solid weekly buying volume and a consistent increase in the OBV. This upward trajectory has delineated an up-trending channel, with PLTR reaching the channel's upper boundary for the second time, particularly on days marked by substantial accumulation.
Furthermore, the short-term Exponential Moving Averages (EMAs) spanning 8 and 21 days have consistently provided support, reinforcing the strength of the uptrend. However, it's worth noting their deviation from the longer-term EMA144, suggesting a need for caution regarding the trend's sustainability.
Author, using TradingView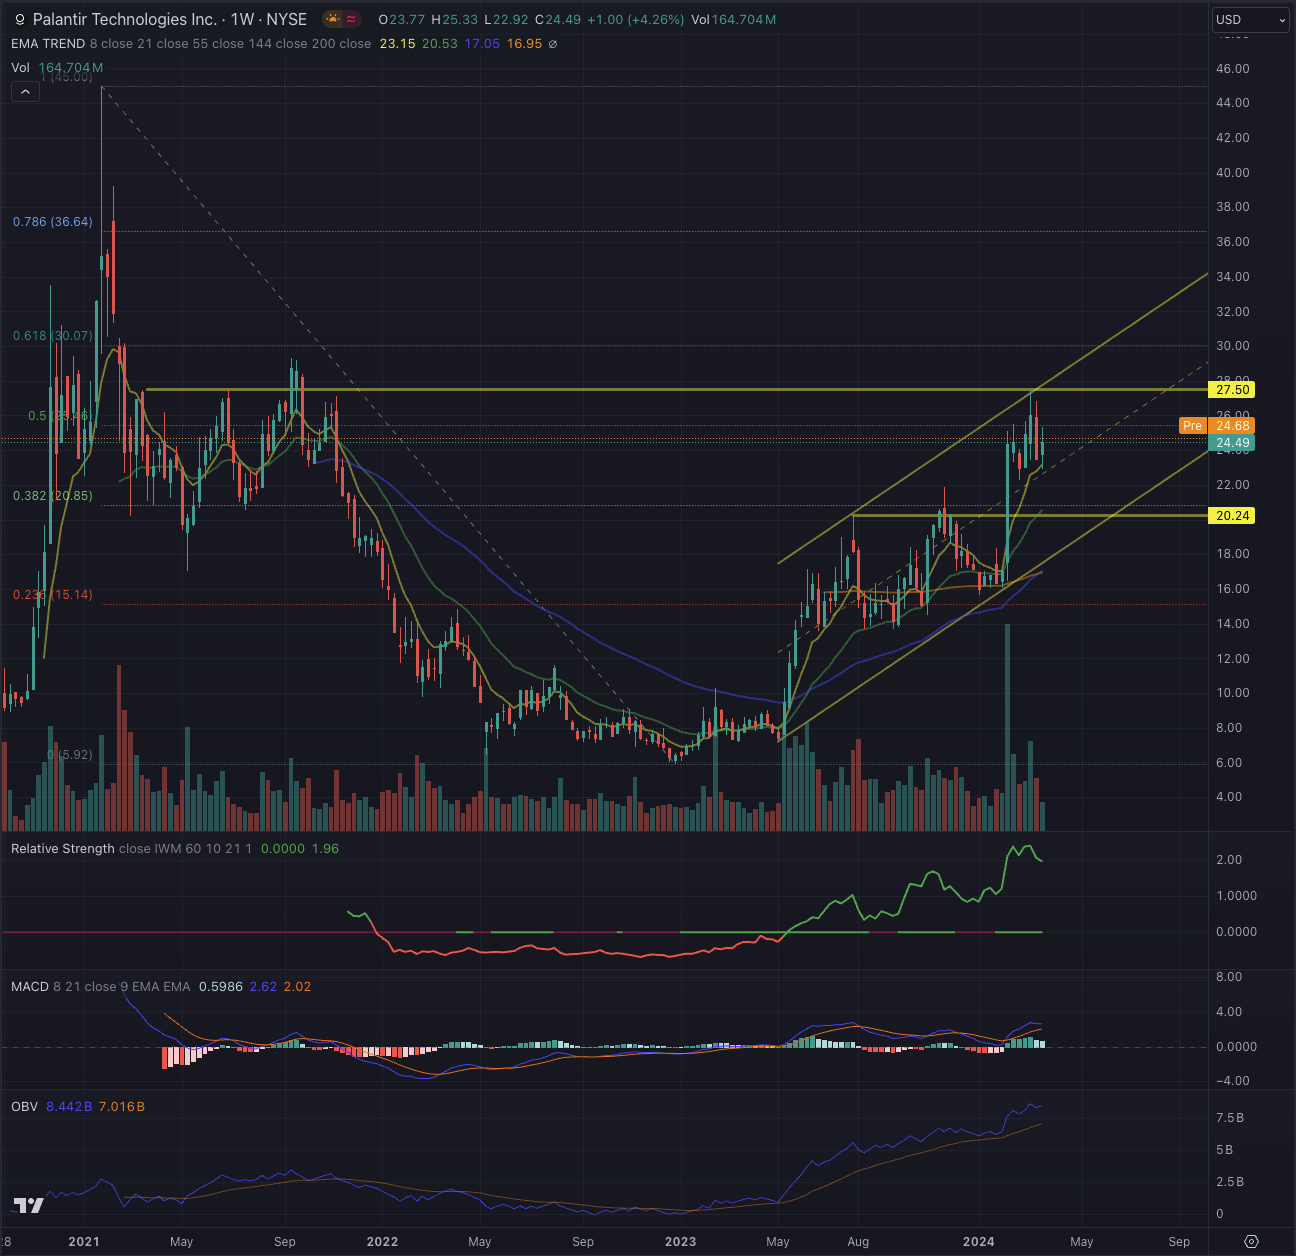
Indeed, despite demonstrating significant relative strength, the current evaluation of PLTR suggests a potential overextension, highlighted by notable expansions in its MACD and a recent peak in relative strength compared to the broader stock market. While these observations were made based on PLTR's weekly chart, it is imperative to zoom in and validate them using the daily chart. This shorter timeframe offers a clearer insight into the structure of the recent rally, which might need to be more evident on the weekly chart. Through a meticulous examination of the daily chart, I can better discern the dynamics at play and determine whether the current trajectory of the stock is sustainable or if a corrective phase is on the horizon.
A closer examination of PLTR's daily chart reveals the distinct five-wave patterns the stock has formed in its trending channel, leading up to the strong overhead resistance, which would represent the breakout level from the cup-formation. The price has consolidated from its recent peak, hinting at a possible corrective wave formation.
Author, using TradingView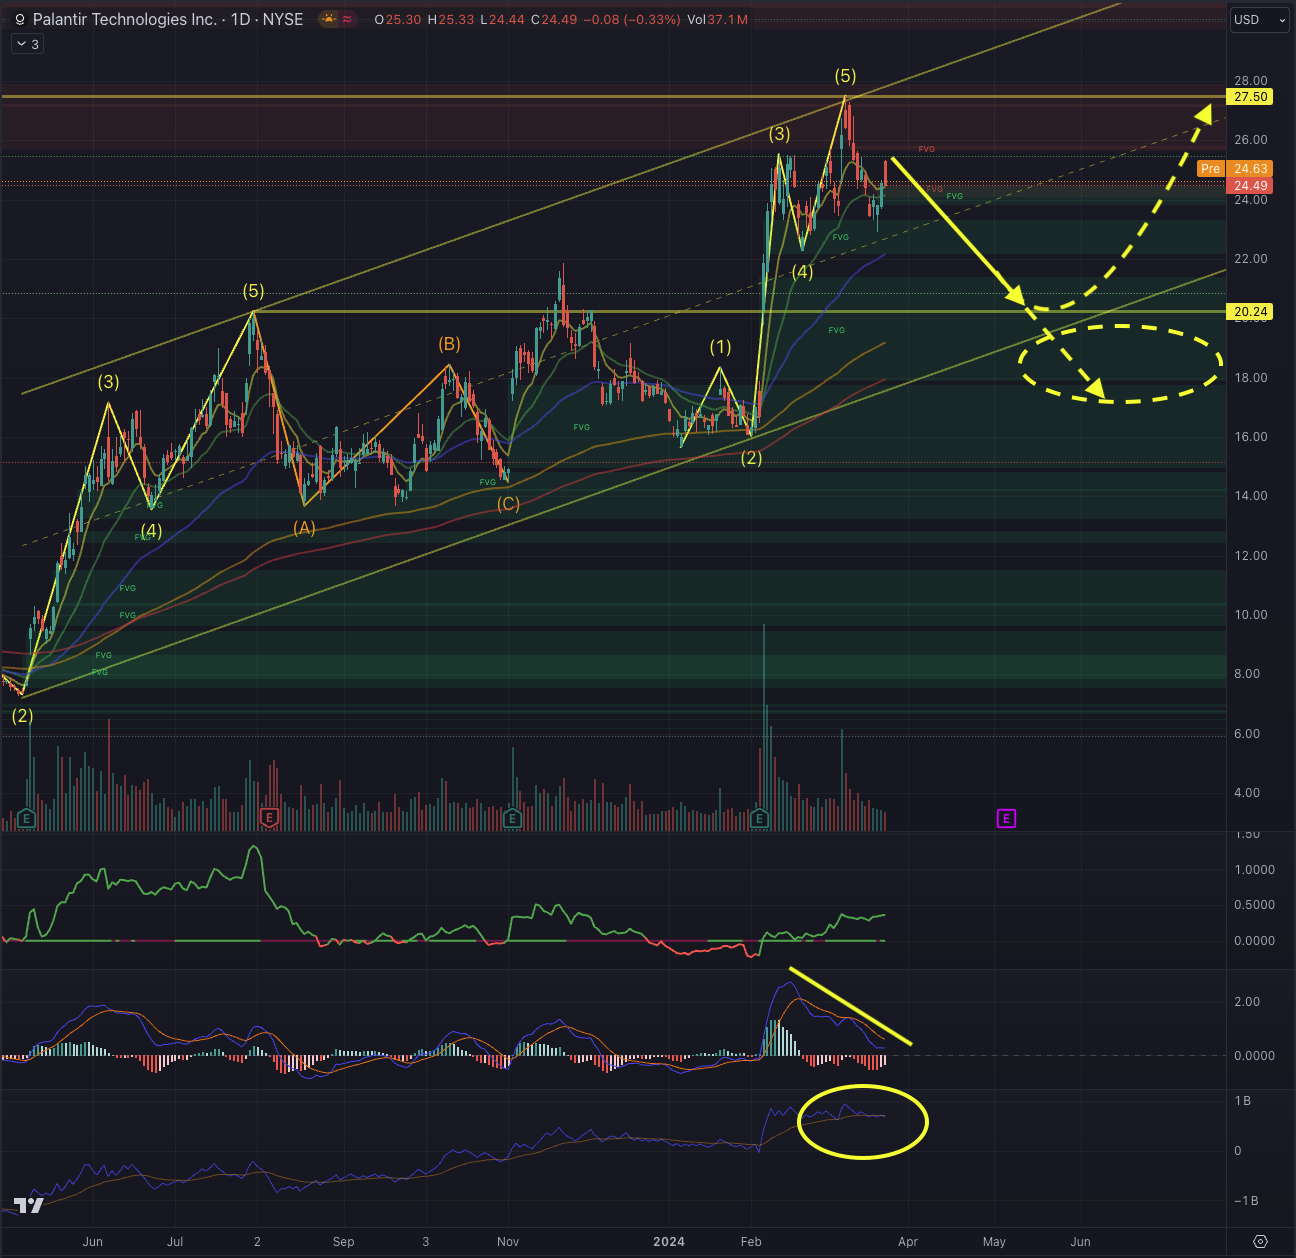
While the prospect of PLTR overcoming overhead resistance remains uncertain, my primary scenario leans towards a higher probability of the stock retracing and testing its prior breakout level. Notably, PLTR has left a notable gap between $19.75 and $17.90, indicative of areas needing pricing balancing, as observed with Fair Value Gaps (FVG). This behavior aligns with typical patterns seen during robust movements.
Supporting this scenario is a pronounced divergence in the MACD, a potential peak in the OBV, and a return of daily volume to more moderate levels following a significant surge in February. Initial price targets for the retracement are set at $20.24, progressing towards $17.90. While this retracement scenario appears most likely, PLTR could find support and resume its ascent, particularly towards the initial price target, confirming the breakout and fostering increased buying interest.
Alternatively, PLTR may consolidate within its current levels, forming a tight range and short handle before breaking out from overhead resistance. This scenario could lead to price targets between $30-31.50 initially, with further targets around $36.70. Such a scenario would necessitate a substantial surge in buying pressure catalyzed by a highly positive event, possibly during the next earnings release.
In light of these observations and recognizing that both PLTR and the industry benchmark have achieved significant targets and are extended, suggesting a likely retracement, it's prudent to consider profit-taking measures. Despite acknowledging PLTR's potential within secular growth trends, the current stock price reflects an excessively optimistic sentiment. From a technical perspective, the risks outweigh the opportunities, prompting to rate PLTR as a sell position.
Technical analysis is a valuable tool for investors, enhancing their prospects of success by navigating the complexities of listed securities. Like consulting a map or using GPS for an unfamiliar journey, incorporating technical analysis into investment decisions provides a strategic guide. I integrate techniques grounded in the Elliott Wave Theory and leverage Fibonacci's principles to evaluate likely outcomes based on probabilities. This method aids in validating or challenging potential entry points, considering factors such as sector performance, industry trends, and price action. My technical analysis aims to comprehensively assess an asset's situation and derive probable outcomes informed by these theories.
Over the past year, the US technology sector has seen significant growth, driven by innovations like AI and ML. However, concerns about market sustainability have emerged, particularly with the dominance of a few large companies. Given these observations and the extended nature of PLTR and the broader market, it's prudent for investors to consider taking profit-taking measures. While PLTR holds promise in long-term growth trends, its current valuation appears overly optimistic from a technical and short-term perspective, warranting a cautious approach and leading to rating PLTR as a sell position.