
MicroStockHub
MicroStockHub
The WisdomTree U.S. Value Fund (NYSEARCA:WTV) seeks to provide investors with above-average income and capital appreciation opportunities by screening for companies that provide a high total shareholder yield and have strong fundamentals in the value space. By looking for high-quality businesses at reasonable valuations combined with buyback programs for the "right reasons" as any ABC Bachelor/ette viewer has often heard, WTF believes it's found the secret sauce of Warren Buffett's investment philosophy: creating excess returns to shareholders through active fundamental analysis and quantitative screenings.
WTV was rebranded in January 2022 from WisdomTree U.S. Quality Shareholder Yield Fund (QSY). What changed? QSY focused on shareholder yield and quality metrics like WTV continues to do, but the new ETF looks for valuation outliers, like forward P/E discounts. In addition, the expense ratio was lowered from 26 basis points (bps) to 12bp, which is fabulous for shareholders. We view this rather small ETF as an interesting participant to the rather small pack of shareholder yield investing space, rating it a Hold.
WTV uses quantitative algorithms to screen its universe of the 800 largest mid- to large-cap US companies. The metrics the managers evaluate are shareholder yield, given a 50% rank, and other traditional valuation ratios like return on equity (ROE) and return on assets (ROA), which comprise the other 50% rank. In a nod to address the level of financial leverage, the managers apply a qualitative look into their stock universe to weed out companies that are issuing debt to finance share buybacks. Their proprietary ranking system produces a list of the top 100-200 companies to include in their ETF.
Screening Process (WisdomTree US Value Fund)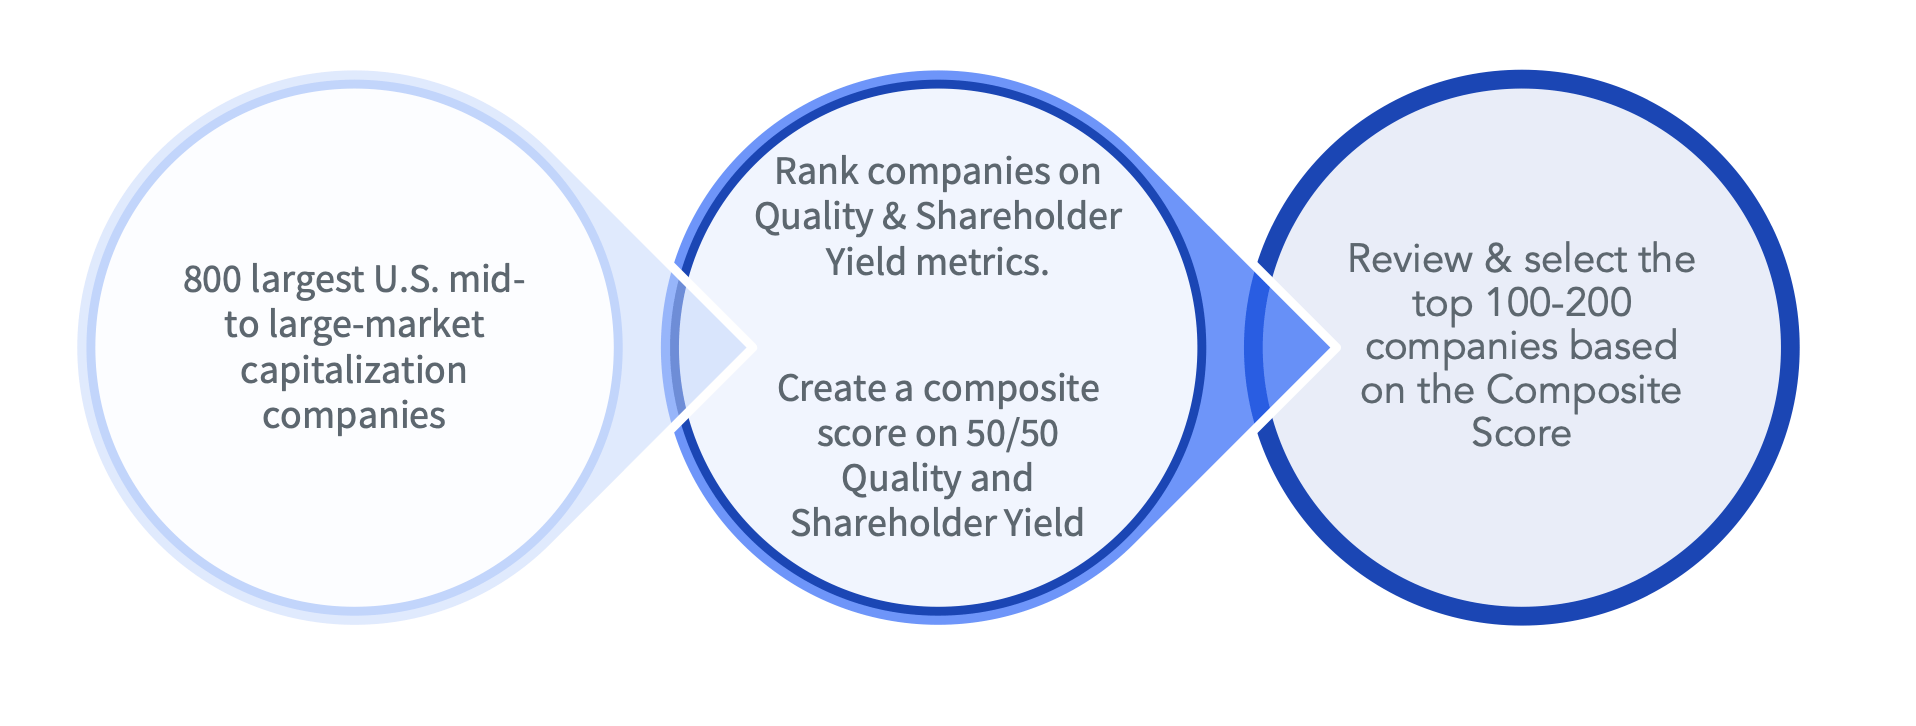
Through this active screening and ranking process, WTV believes it provides exposure to high-quality companies that are valued at a discount to their fundamental characteristics. The emphasis on shareholder yield demonstrates WisdomTree's belief that it is one of the most effective measures of value.
Shareholder yield is a relatively new corporate metric used to measure how companies return capital to shareholders. The term was first coined by the famed investor William Priest in his 2005 white paper " The Case for Shareholder Yield as a Dominant Driver of Future Equity Returns." Priest defines shareholder yield by calculating how public companies can return free cash flow to shareholders using the following formula:
William Priest's Shareholder Yield Calculation (Corporate Finance Institute)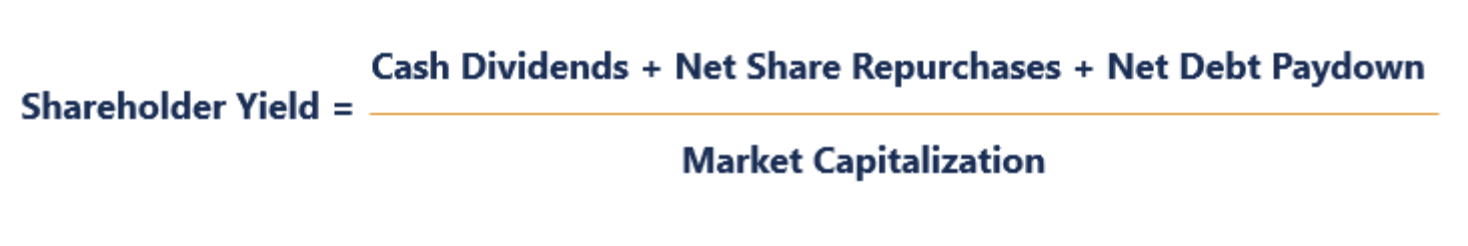
WisdomTree uses a different calculation for shareholder yield, which leaves out free cash flow used to pay down debt. As a fundamental analyst, we would prefer for WisdomTree to use Priest's formula as debt reduction is a robust indicator of quality and risk reduction. Despite not including debt reduction in its calculations, we still believe WisdomTree's version provides a strong measure of value and potential total performance.
WisdomTree Shareholder Yield Calculation (WisdomTree "The Case for US Value Fund")
WTV is a small ETF with only $238 million AUM. This can create drawdown and liquidity risk with lower daily trading volume.
Twenty-seven percent of WTV is represented by large-cap companies, with mid-caps representing 54% and the remaining 19% in the small-cap space. With 162 holdings and the top 10 holdings representing only 10% of the ETF, concentration risk is low. The highest sector concentrations, representing roughly 50% of its composition, are financials (20%), consumer cyclicals (17%) and industrials (15%).
Top 10 Holdings (Seeking Alpha)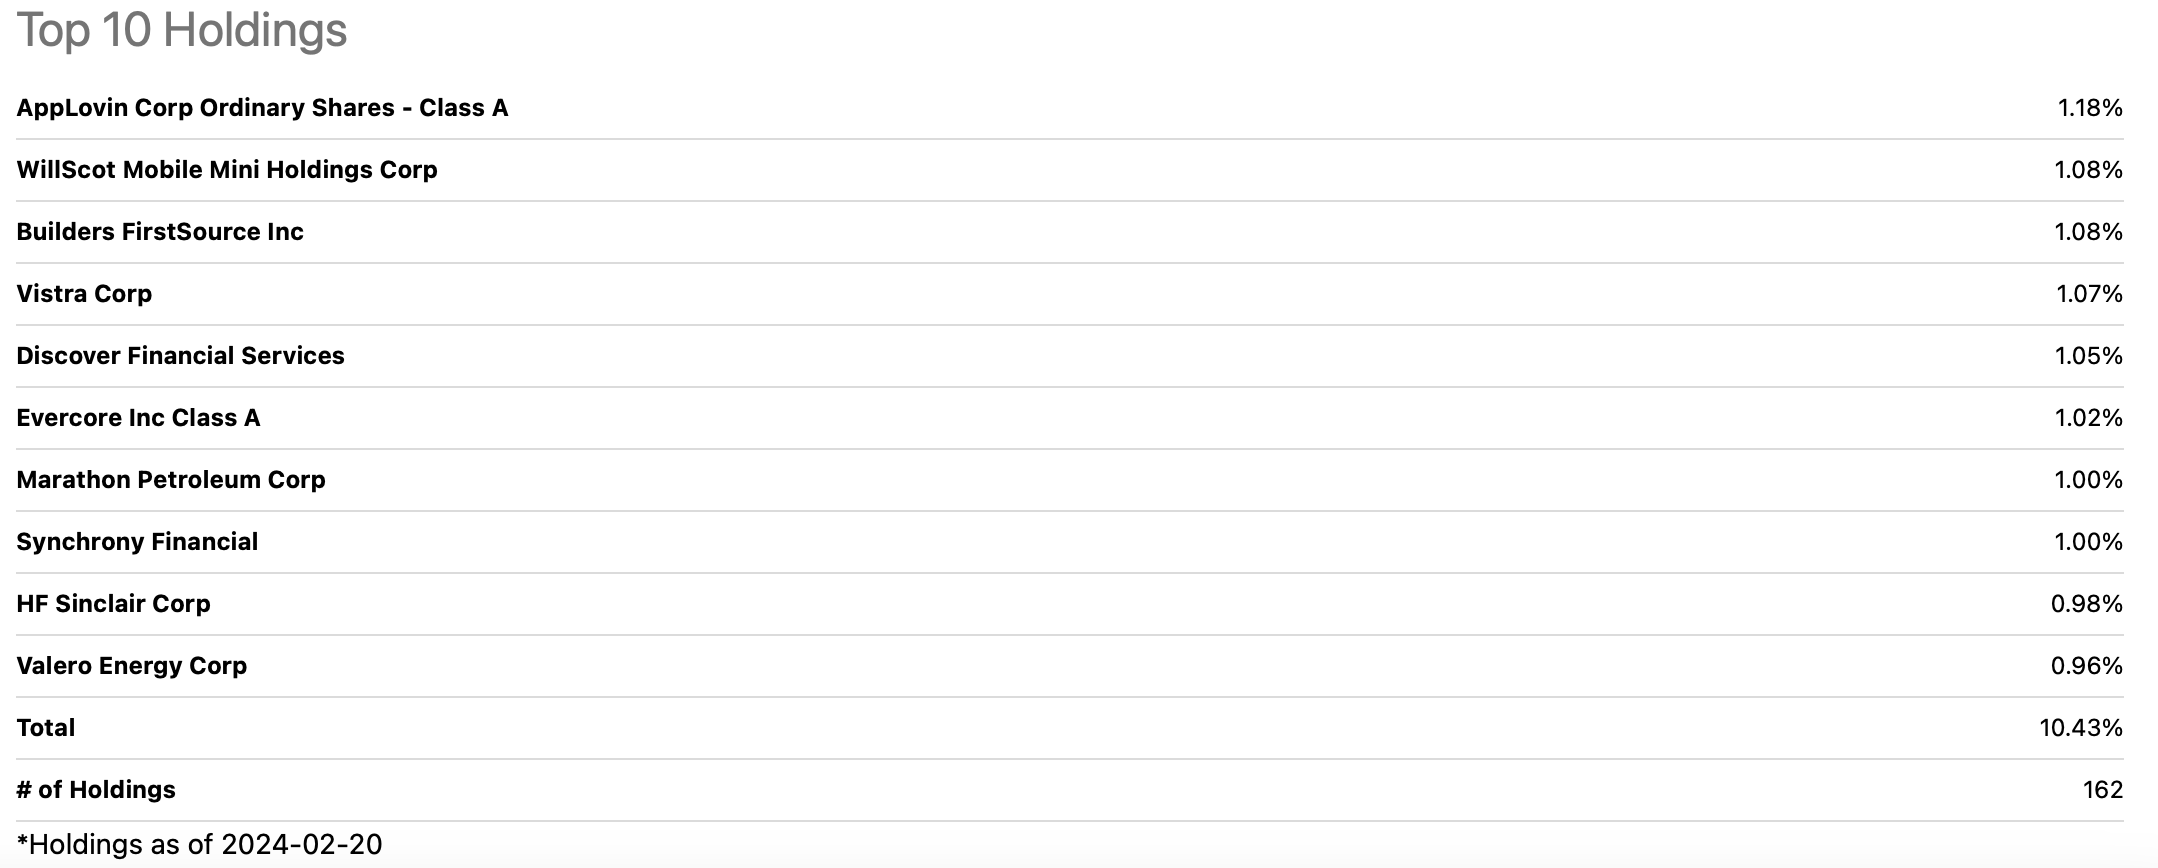
"Shareholder yield focus" is a pretty small ETF space. Therefore, we are including as alternatives Invesco BuyBack Achievers ETF (PKW), iShares Core Dividend ETF (DIVB), Cambria Shareholder Yield EFT (SYLD), which we recently commented on, and iShares S&P 500 Value ETF (IVE), which is used as a benchmark. Except for SYLD, all the ETFs are comprised of mid to large-cap companies with little small-cap exposure.
| Sector Holdings | WTV | IVE | PKW | SYLD | DIVB |
| Financials | 20% | 22% | 16% | 19% | 18% |
| Consumer Cyclicals | 17% | 6% | 22% | 19% | 7% |
| Industrials | 15% | 11% | 18% | 12% | 9% |
| Technology | 11% | 9% | 6% | 2% | 26% |
| Energy | 11% | 6% | 9% | 23% | 9% |
| Basic Materials | 6% | 3% | 3% | 14% | 3% |
| Communications | 5% | 5% | 10% | 3% | 4% |
| Health Care | 8% | 19% | 14% | 6% | 11% |
| Consumer Defensive | 3% | 10% | 0.3% | 2% | 8% |
| Real Estate | 2% | 4% | 6% | 2% | 3% |
| Utilities | 2% | 5% | 0.6% | 0% | 3% |
*Source Seeking Alpha
While past performance does not guarantee future performance, the 3 and 5 Yr total return performances are comparable relative to the broader market. The outlier is SYLD, which has performed better over the longer run. This could be because SYLD is focused more on the small and mid-cap space and the others have a more mid- to large-cap focused strategy.
3 YR Total Return (Seeking Alpha) 5 YR Total Return (Seeking Alpha)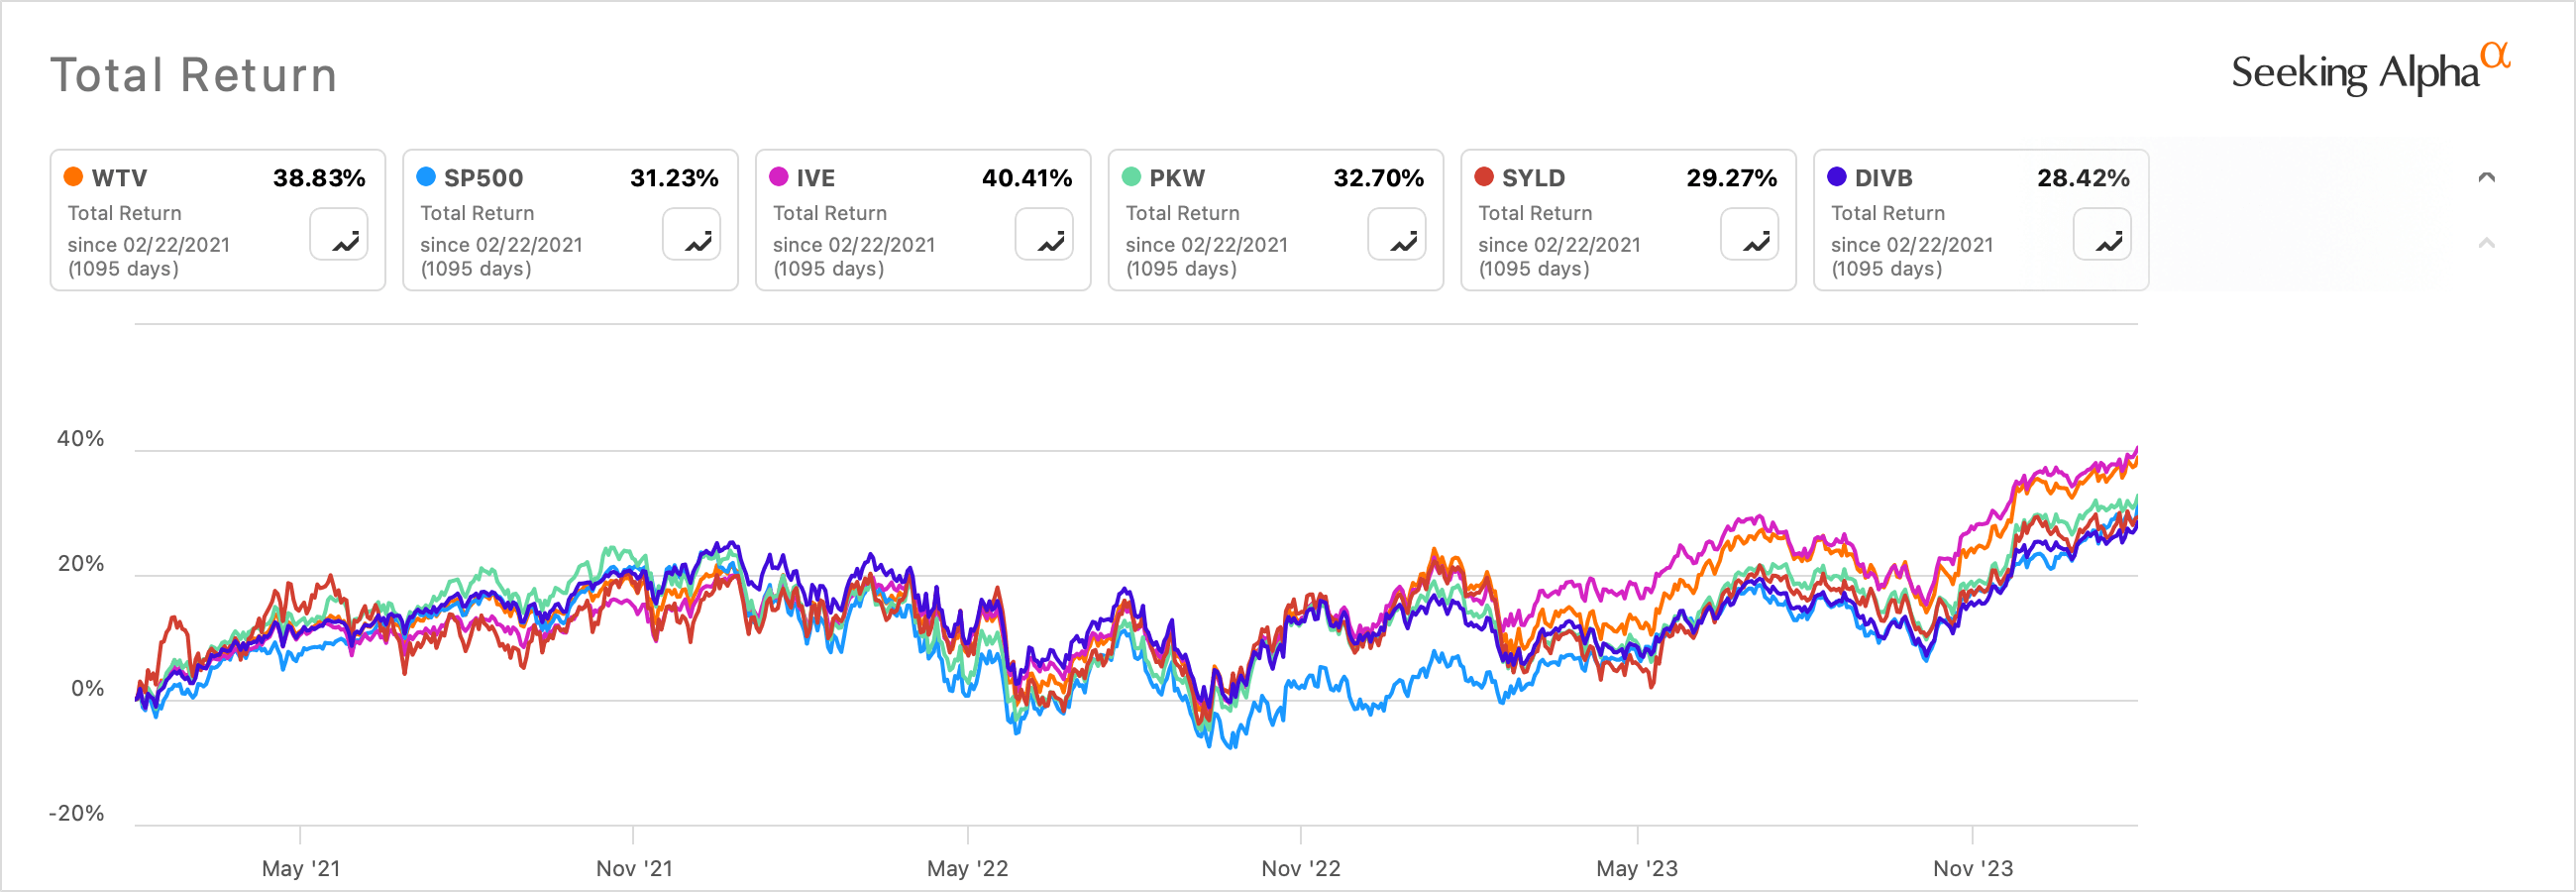
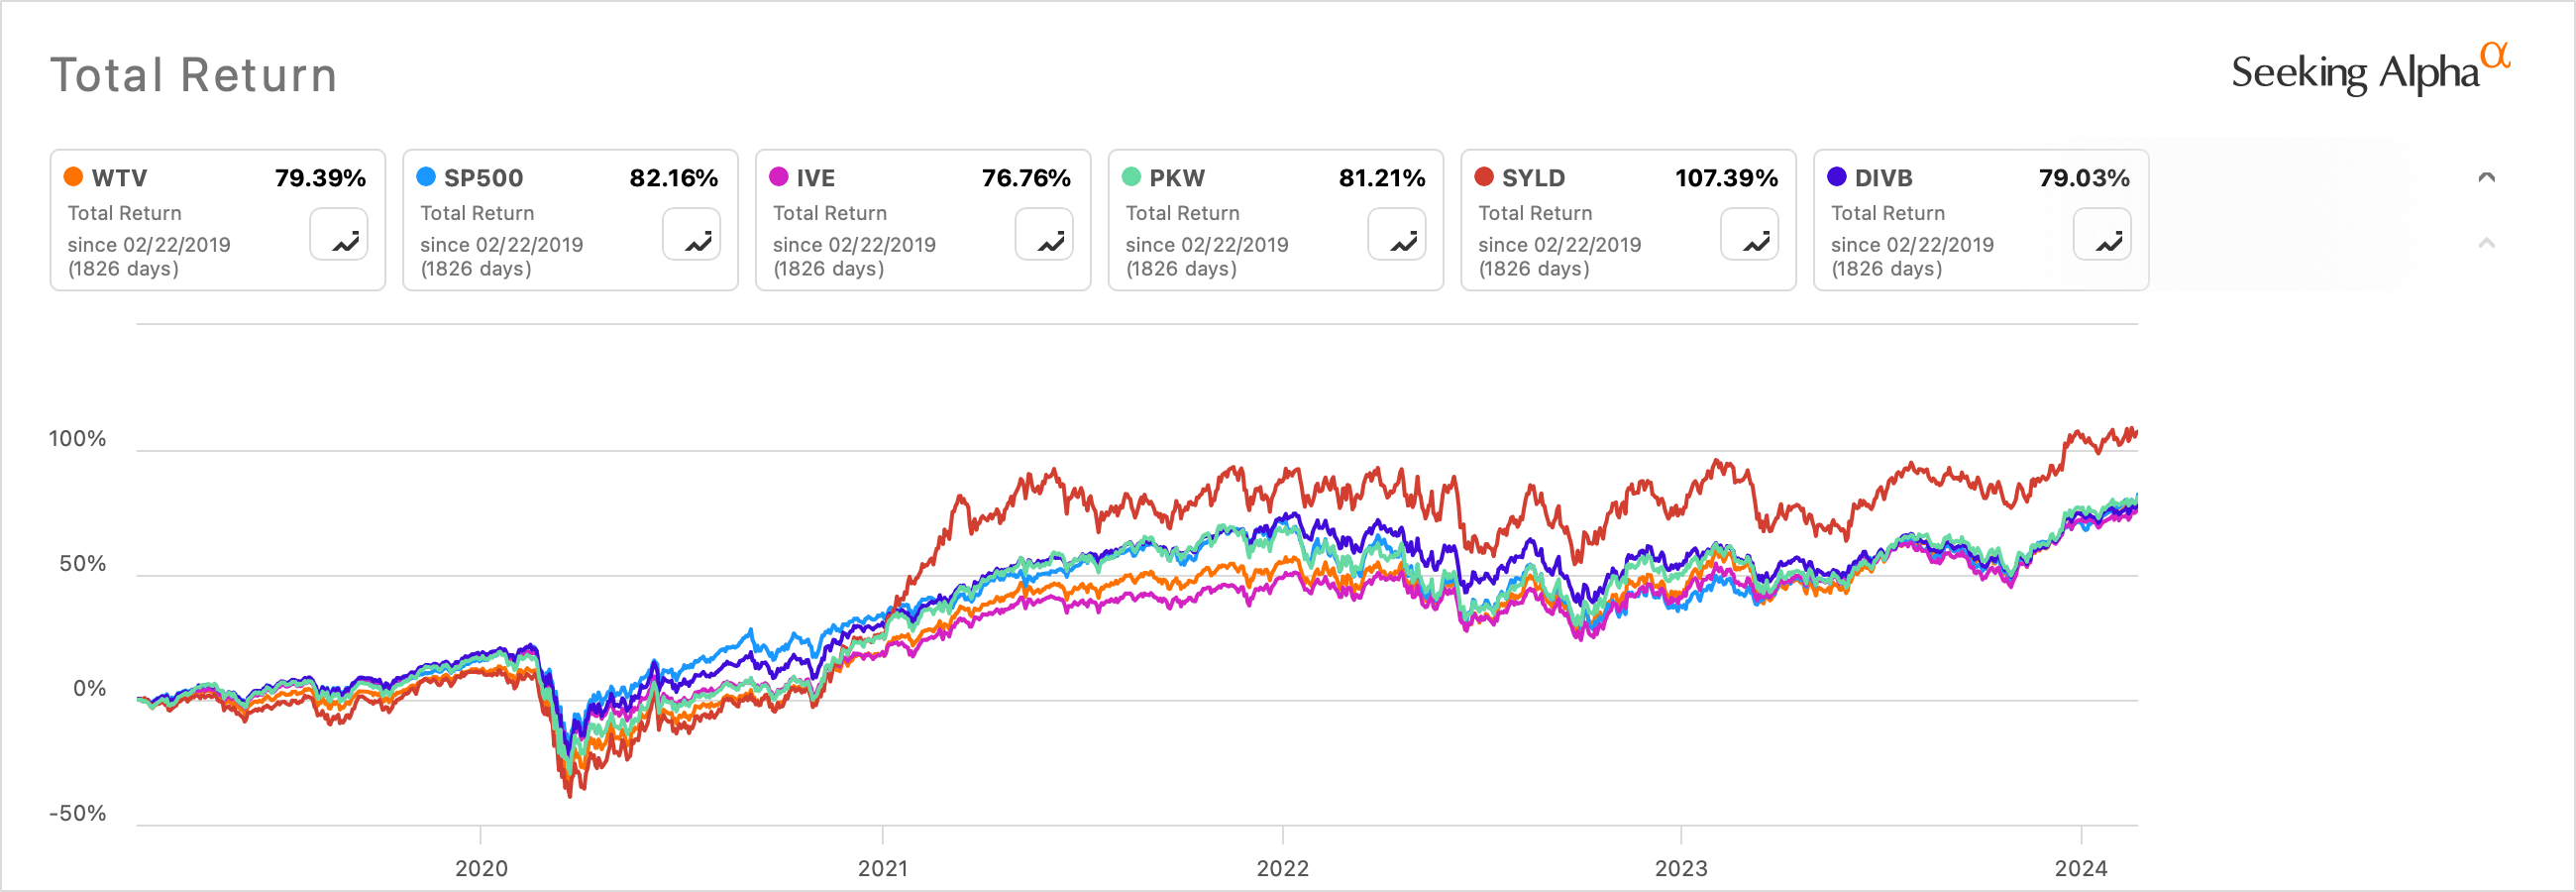
The WTV investment thesis of shareholder yield has not shown outsized returns to investors over the last several years but rather has maintained pace with the broader market. This may be because of the sector bets and the market cap size of the companies it vets. The fundamental analyst in me, however, thinks it has more to do with it leaving out the net debt paydowns in its shareholder yield screenings. Lower debt-to-equity ratios can leave companies more nimble and with lower risk as long as they employ capital for the "right reasons". The WTV managers also look for a forecasted P/E discount to the S&P 500 Index, which we use IVE as a proxy. Note there is a 21% discount, suggesting potential for multiple expansion. But, SYLD is trading at a 38% discount. These two ETFs are apples and oranges, similar yet different. Still, we rate WTV a Hold.
| WTV | IVE | PKW | SYLD | DIVB | |
| Weighted Average Debt/Total Capital | 48% | 43% | 53% | 38% | 48% |
| Forward P/E Estimate | 12.5 | 15.8 | 13.2 | 9.8 | 13.8 |
*Internal Calculations
Interest rate risk is ever present for ETFs composed of publicly traded companies. If rates remain high, company profits/free cash flow can remain restrained as new or floating rate debt can fluctuate higher. This can put pressure on company profitability and therefore the ability to return capital to shareholders.
Corporate buybacks have come under increased negative scrutiny over the last several years. The Inflation Reduction Act of 2022 imposed a 1% tax on buybacks. Should buybacks continue to come under political pressure, companies could reduce or discontinue their use, which could lower shareholder yields.