
deepblue4you
deepblue4you
This article series aims at evaluating ETFs (exchange-traded funds) regarding the relative past performance of their strategies and metrics of their current portfolios. Reviews with updated data are posted when necessary.
Invesco International Dividend Achievers ETF (NASDAQ:PID) started investing operations on 09/15/2005 and tracks the NASDAQ International Dividend Achievers Index. As of writing, it has 49 holdings, a distribution yield of 3.86% and a total expense ratio of 0.53%.
As described in the prospectus by Invesco, the underlying index selects companies that:
The weighting methodology is based on the 12-month dividend yield with a maximum weight of 4% per constituent. The index is reconstituted once a year in March and rebalanced quarterly. A constituent may be excluded at any time if it becomes ineligible. In this case, it is not replaced until the next reconstitution. In the most recent fiscal year, the portfolio turnover rate was 38%.
PID has a tilt to large and mega-cap companies, which represent 75.7% of asset value.
Size segments (chart: author; data: Fidelity.)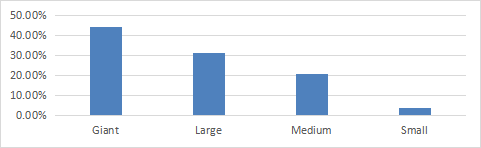
The fund is massively overweight in Canadian companies, which weigh 56% of assets. The next chart plots PID geographical allocation.
Geographical allocation (chart: author: data: Invesco)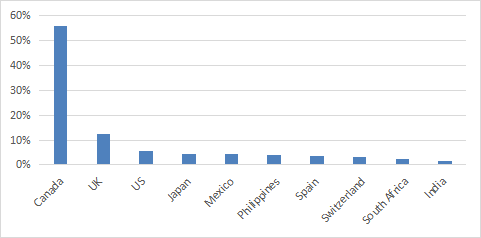
PID concentration in Canada is a consequence of the U.S. or U.K. listing requirement. It is a strong limitation compared to other international funds. Despite a strategy excluding companies incorporated in the U.S., it shows up in third position with 5.6% of assets. Indeed, several large global companies classified as American are incorporated overseas, in particular in Ireland.
The portfolio is well-diversified across sectors: none of them weighs more than 19%. Utilities come in first position with 18.7% of assets, followed by financials (15.5%), communication services (13.6%) and energy (13%). Other sectors are below 9%.
Sector Breakdown (chart: author: data: Invesco)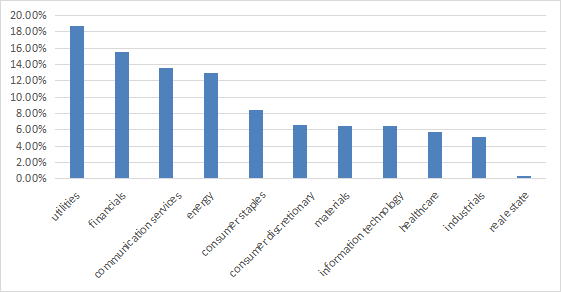
The top 10 holdings, listed below with fundamental ratios, represent 39.7% of asset value. The portfolio is quite concentrated, but risks related to individual companies are moderate: none of them weighs more than 4.2%.
Ticker | Name | Weight% | EPS growth %TTM | P/E ttm | P/E fwd | Yield% |
PLDT, Inc. | 4.19 | 123.76 | 10.90 | 9.15 | 6.98 | |
British American Tobacco PLC | 4.11 | -329.37 | N/A | 6.72 | 9.40 | |
Canadian Imperial Bank of Commerce | 4.11 | 23.85 | 10.27 | 10.01 | 5.35 | |
Enbridge, Inc. | 4.08 | 105.88 | 17.02 | 17.19 | 7.57 | |
TC Energy Corp. | 4.03 | 242.69 | 19.88 | 13.22 | 7.05 | |
Brookfield Infrastructure Partners LP | 3.97 | -53.49 | 200.76 | 35.10 | 5.56 | |
Brookfield Renewable Partners LP | 3.89 | 47.01 | N/A | N/A | 6.48 | |
National Grid plc | 3.81 | 126.81 | 5.34 | 15.53 | 5.25 | |
Atlantica Sustainable Infrastructure plc | 3.81 | 849.82 | 42.47 | 31.98 | 10.31 | |
TELUS Corp. | 3.75 | -52.19 | 38.50 | 21.26 | 6.75 |
PID is cheaper than the US large cap benchmark S&P 500 (SPY) regarding valuation ratios, as reported in the next table. It is inferior regarding growth, though.
PID | SPY | |
Price / Earnings TTM | 18.06 | 24.84 |
Price / Book | 1.78 | 4.36 |
Price / Sales | 1.78 | 2.85 |
Price / Cash Flow | 7.4 | 17.06 |
Earnings growth | 12.71% | 21.01% |
The next chart compares the 10-year total returns of PID and an ex-US equity benchmark: iShares Core MSCI Total International Stock ETF (IXUS). PID has underperformed by 15.5%.
Total returns since March 2014 (Seeking Alpha)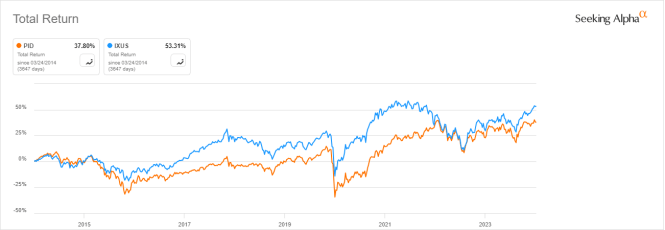
In fact, the share price is close to flat on this period, as plotted on the next chart. In the same time, the cumulative inflation has been about 31% (based on CPI), resulting in a material loss in inflation-adjusted value.
Price returns since March 2014 (Seeking Alpha)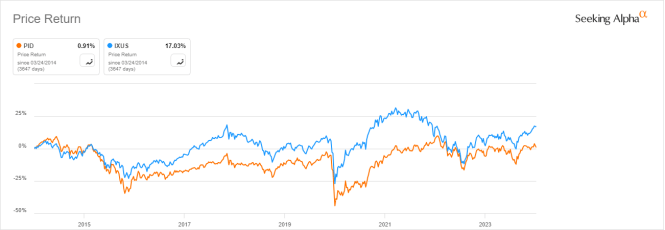
The annual sum of distributions has increased from $0.40 per share in 2013 to $0.61 in 2023. Nonetheless, it went down if we take 2014 as starting point. Despite the dividend growth strategy, there is no uptrend in distributions, as reported on the chart below.
PID distribution history (Seeking Alpha)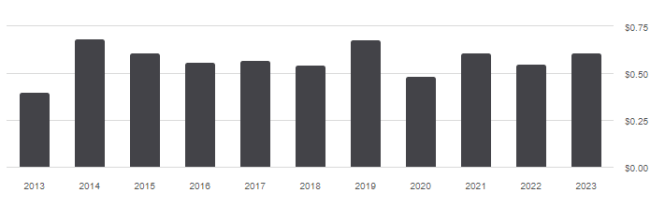
The next table compares characteristics of PID and two non-hedged international funds with a tilt to dividend growth or quality:
PID | IGRO | IQDY | |
Inception | 9/15/2005 | 5/17/2016 | 4/12/2013 |
Expense Ratio | 0.53% | 0.15% | 0.47% |
AUM | $924.23M | $655.28M | $77.37M |
Avg Daily Volume | $3.12M | $2.35M | $311.43K |
Holdings | 49 | 468 | 185 |
Top 10 | 39.70% | 28.28% | 18.09% |
Turnover | 38.00% | 37.00% | 78.00% |
Yield TTM | 3.35% | 2.69% | 6.29% |
4 Year Average Yield | 3.64% | 2.57% | 4.35% |
Div. Growth 5 Yr (annualized) | 2.46% | 4.26% | 6.79% |
PID is the largest and most liquid of these funds. On the downside, it has the highest expense ratio, the lowest dividend growth rate and it is the most concentrated in its top holdings. The next chart compares total returns, starting on 5/16/2016 to match all inception dates. PID has been lagging its peers.
PID vs competitors since 5/16/2016 (Seeking Alpha)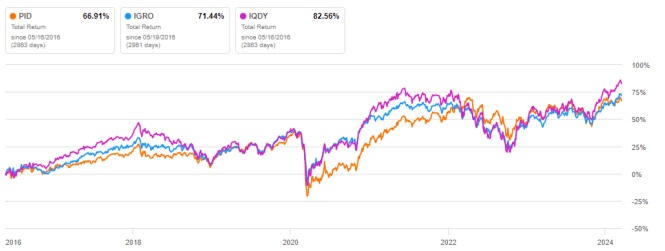
The gap is larger over the last 12 months:
PID vs competitors, last 12 months (Seeking Alpha)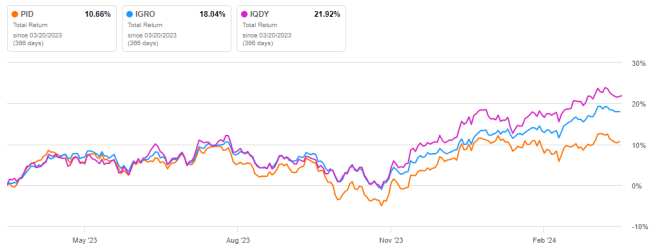
Invesco International Dividend Achievers ETF (PID) invests in international stocks with growing dividends. It is well diversified across sectors and holdings, but very concentrated in Canadian companies. Valuation looks attractive relative to the U.S. market, yet past performance is underwhelming, regarding both return and dividend growth.