
vitapix
vitapix
Invesco Water Resources ETF (NASDAQ:PHO) warrants a hold rating due to the fund’s relatively mediocre prospects. While PHO has several strong holdings and the water resource industry is expected to see strong growth, the fund has a record of performance lower than the market overall, a relatively high expense ratio, and a low dividend yield. Furthermore, several of PHO’s top holdings have high valuations but lack fundamental qualities. Therefore, PHO does not deserve a buy rating currently.
PHO is an ETF that seeks to track the NASDAQ OMX US Water Index. With its inception in 2005, the fund has 40 holdings and $2.04B in AUM. Despite being concentrated on water resource holdings, the fund has a fair amount of market sector diversification with 60.15% weight on industrials, 12.07% in health care, and 10.10% in utilities. PHO is comprised of 98.44% U.S. holdings, but also includes a small number of international holdings.
Other funds examined for comparison purposes are First Trust Water ETF (FIW), Invesco Global Water ETF (PIO), and Ecofin Global Water ESG Fund (EBLU). FIW seeks to track the ISE Clean Edge Water Index. The fund includes holdings that are the largest in the water industry by market capitalization. PIO aims to capture the NASDAQ OMX Global Water Index. Therefore, in comparison to PHO, PIO is more internationally diversified with holdings in the U.S. (52.30%), Japan (13.36%), and United Kingdom (10.12%). In contrast to FIW, PIO includes predominantly mid-cap holdings. EBLU is an ESG fund and therefore incorporates environmental, social, and corporate governance considerations in its holdings. The fund is heavily weighted towards U.S. water infrastructure companies.
Globally, the clean water supply will be an increasingly precious commodity due to population growth as well as increased demand for irrigation, livestock, and manufacturing. Demand for drinkable water is even expected to surpass supply by 40% in 2030. To meet this demand, the water treatment market is expected to grow at a 6.3% CAGR through 2028. This industry includes water and wastewater treatment, sanitation, dispensing, filtration, and transportation. PHO, along with its peer ETFs, contain businesses as holdings that provide these services.
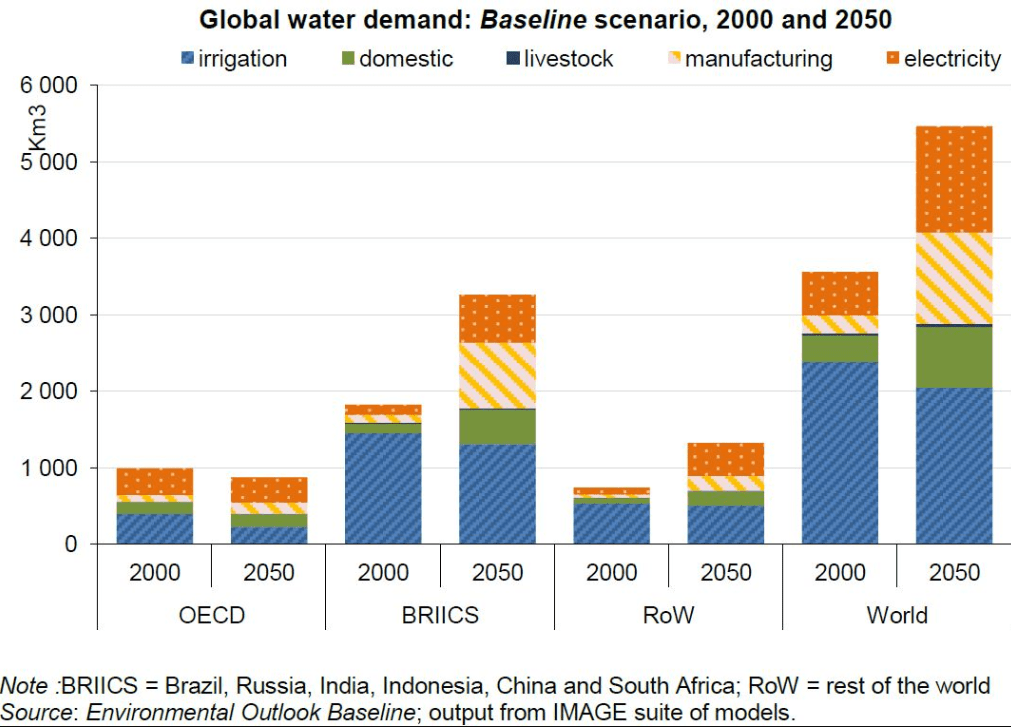
2000 & 2050 Forecast Global Water Demand (Global Sherpa, 7 Mar 24)
Despite strong expected industry growth, PHO and its peer funds have lagged the market overall. PHO has seen a 10-year compound annual growth rate, or CAGR, of 9.62%. By comparison, FIW has seen a 10-year CAGR of 11.67% and PIO has seen a 10-year CAGR of 7.09%. EBLU was initiated in 2017 and therefore does not have a lengthy record of performance but has seen an average annual return of roughly 11.1% since 2017. Using Vanguard’s S&P 500 Index Fund (VOO) as a measure of the market’s returns overall, VOO has seen 10-year CAGR of 12.66%. Personally, I would be willing to accept a slightly lower performance in exchange for lower volatility. However, as I will discuss later, PHO and peer funds are roughly as volatile as the market overall.
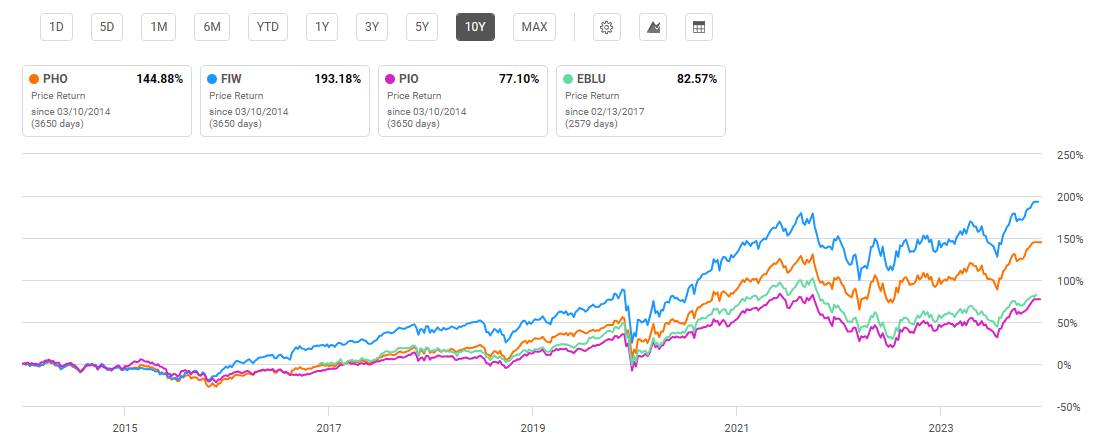
10-Year Total Price Return: PHO and Compared Water Resource ETFs (Seeking Alpha)
Another downside for PHO is its relatively high expense ratio. At 0.60%, the fund is roughly on par with its other water service peers, but higher than the average ETF expense ratio overall. Additionally, PHO has a low dividend yield at just 0.56%. This is the lowest of water resource funds compared. However, PHO’s dividend yield is growing at a 22.72% 5-year CAGR.
Expense Ratio, AUM, and Dividend Yield Comparison
PHO | FIW | PIO | EBLU | |
Expense Ratio | 0.60% | 0.53% | 0.75% | 0.40% |
AUM | $2.04B | $1.58B | $291.39M | $52.09M |
Dividend Yield TTM | 0.56% | 0.66% | 0.79% | 1.41% |
Dividend Growth 5 YR CAGR | 22.72% | 15.09% | -6.39% | 13.05% |
Source: Seeking Alpha, 7 Mar 24
PHO has a fairly high concentration on its top 10 holdings, with 62.17% weight. Due to the specific concentration of water resource ETFs, the funds are not incredibly diversified, with less than 50 holdings each. Due to the different tracked indexes and objectives, each fund’s holdings mix is notably different, with some common trends in holdings bolded below.
Top 10 Holdings for PHO and Compared Water Resource ETFs
PHO – 40 holdings | FIW – 37 holdings | PIO – 46 holdings | EBLU – 42 holdings |
FERG – 8.75% | FERG – 4.79% | PNR – 8.60% | XYL – 8.28% |
ECL – 8.27% | XYL – 4.46% | DHR – 8.08% | FERG – 8.26% |
DHR – 8.04% | WAT –4.45% | VLTO – 7.98% | ECL – 8.17% |
VLTO – 7.93% | ECL – 4.43% | GEBN SW – 5.05% | AWK – 6.18% |
ROP – 7.17% | A – 4.15% | VIE FP – 4.80% | GEBN.SW – 5.58% |
CNM – 4.83% | IDXX – 4.07% | ECL – 4.18% | VEOEY – 5.41% |
WMS – 4.37% | CNM – 4.04% | SBSP3 – 4.13% | PNR – 4.32% |
XYL – 4.28% | WMS – 4.01% | XYL – 3.75% | WMS – 4.29% |
PNR – 4.27% | ROP – 3.96% | FERG – 3.75% | IEX – 4.25% |
WAT – 4.26% | IEX – 3.82% | ROP – 3.61% | AOS – 3.90% |
Source: Multiple, compiled by author on 7 Mar 24
Upon close examination of PHO’s holdings, there are two major disadvantages for the fund looking forward. The first is that several top weighted holdings appear overvalued in comparison to their sector. The second is that a number of these holdings also have shown low or even negative growth. These factors that will drag PHO back are discussed in further detail below along with an alternative option for investors seeking alpha.
The first disadvantage holding PHO back is the heavy weight on a number of overvalued holdings. Ecolab Inc. (ECL), a water hygiene company, is one example of a top holding that is arguably overvalued. Despite a solid 8.96% net income margin with 11.49% YoY EBITDA growth, ECL has a P/E of 47.08, or 136% higher than its sector median. Additionally, lower weight holdings like Advanced Drainage Systems, Inc. (WMS), a pipe and water management company, also have valuations that are not substantiated by fundamental metrics. Despite having a -9.37% YoY revenue growth, WMS has a forward P/E ratio that is 20.6% higher than its sector median. Additionally, WMS has a price/book ratio 293% higher than its sector median. ECL and WMS have a combined 12.65% weight with PHO and therefore represent a disadvantage dragging back future performance for the fund.
The second difference is the lack of growth for a number of its top holdings. Despite the global increase in water demand previously discussed, PHO will likely be held back by the lack of growth for several key holdings, including Danaher Corporation (DHR) and Ferguson PLC (FERG). DHR has seen a -22.29% YoY EBITDA growth and a -38.65% YoY ROE growth. Additionally, Ferguson PLC (FERG), PHO’s #1 holding by weight, has a -6.89% YoY EBITDA growth. FERG has also seen a -20.77% YoY ROE growth. Ferguson is a plumbing and heating product company that will likely see consistent returns. However, with a one-year share price increase of over 40%, any positive qualities appear to be already price in.
Alternatively, investors may see better returns by investing in some of PHO’s individual holdings. The first positive example of an attractive individual holding is Core & Main, Inc. (CNM). The company distributes water and drainage products and has seen an impressive 739% YoY operating cash flow growth. CNM has also seen a 15.01% YoY EBITDA growth, along with a 13.56% EBITDA margin. Despite these metrics, the company has a P/E ratio that is 3.82% lower than its sector median, representing an attractive alternative to PHO’s broader inclusion of less desirable holdings. Another example is Pentair PLC (PNR), a UK-based company delivering water solutions internationally. Pentair is also favorably valued with a P/E of 21.11, 13% below its sector median. However, the holding has demonstrated solid fundamentals, including an 8.02% YoY EBITDA growth and a 15.17% net income margin.
PHO has a current price of $64.60 at the time of writing this article. This price is near the top of its 52-week range of $46.65 to $65.03. Over the past year, PHO has outperformed all compared water resource ETFs. However, similar to the 10-year performance look-back, the funds underperformed the S&P 500 Index, which has seen a one-year return of over 29%.
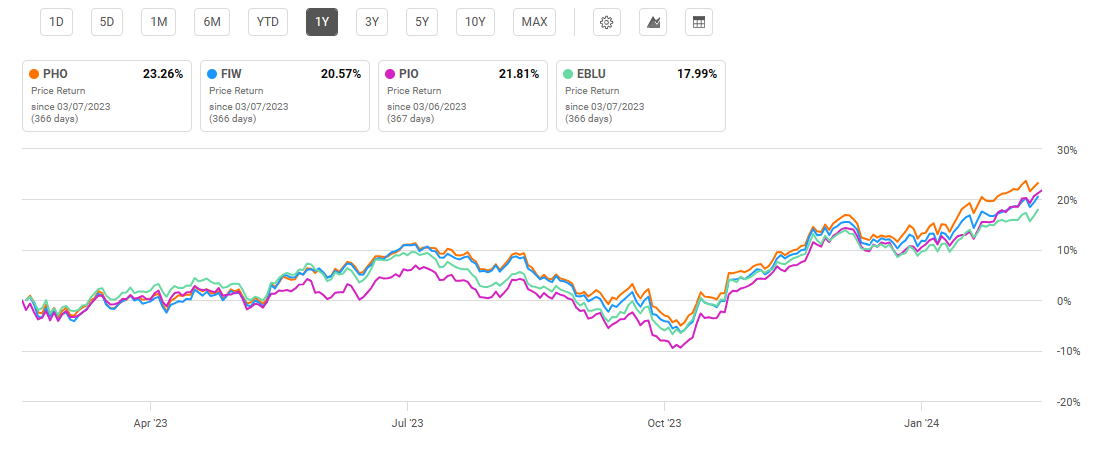
One-Year Price Return: PHO and Peer Examined Water Resource Funds (Seeking Alpha)
In comparison to peer water resource ETFs, PHO demonstrates multiple valuation metrics that are less desirable than its peers. As discussed, this is predominantly due to heavy weight on top holdings with high valuations currently. For instance, PHO’s P/E ratio is 34.29, the highest among peer funds. Additionally, PHO also has the highest P/B ratio at 6.46.
Valuation Metrics for PHO and Peer Competitors
PHO | FIW | PIO | |
P/E ratio | 34.29 | 31.17 | 23.82 |
P/B ratio | 6.46 | 6.11 | 3.57 |
Source: Compiled by Author from Multiple Sources, 7 Mar 24
Despite strong expected industry growth, PHO will likely lag peer funds due to the high valuation for a number of its top holdings. Additionally, the lack of growth previously discussed will also be a factor that holds PHO back from future returns. While I might find this underperformance acceptable in exchange for lower risk, PHO has demonstrated volatility greater than the market overall. Utilizing beta value as an implied volatility metric, PHO has a 5-year beta value of 1.16. By comparison, PIO has a beta value of 1.03 and EBLU also has a 5-year beta of 1.16.
Investors seeking alpha will likely be underwhelmed by the qualities of PHO. Despite the strong industry growth for water services as well as overall global demand for water, PHO has historically underperformed the market overall. One would be willing to accept this underperformance in exchange for low volatility or a higher dividend yield. However, PHO demonstrates volatility roughly on par with the S&P 500 Index with a dividend yield lower than an S&P 500 Index fund. Upon examining PHO’s individual holdings, several are at risk of being overvalued with low growth or profitability. However, a few key holdings of PHO may outperform the fund overall and deserve consideration.