
Richard Drury
Richard Drury
Dividend Growth Investing, or DGI, is a straightforward but popular investment strategy whereby an investor purchases shares of companies with long histories of paying and increasing dividend payments. The strategy works because it shifts the attention to dividend payments over total returns, increasing the odds that you'll stay fully invested for longer. As noted by the Schwab Center For Financial Research, time in the market beats timing the market. If the DGI strategy helps you do that, I have no complaints.
While this strategy works for investors building a portfolio of individual stocks, many attempt to apply the same approach to ETFs. Unfortunately, these investors are making a mistake because they ignore that ETFs and individual stocks are different products. By relying solely on metrics like an ETF's historical three- and five-year dividend growth rate, investors skip other metrics they'd usually scan for with individual stocks, including:
Just like you can't squeeze blood from a stone, a company can't increase dividends without making money or growing sales and earnings. DGI investors know this. Yet, they assume an ETF's 5Y dividend growth rate somehow packages all these metrics together and reflects a portfolio on solid footing. Today, I'll demonstrate that's not always the case and use four popular DGI ETFs to illustrate why. I hope you enjoy the analysis.
First, I want you to consider "DGI," a hypothetical dividend growth ETF holding 100 S&P 500 Index stocks with the highest five-year dividend growth rates. The ETF is yield-weighted, and there is no rebalancing throughout the year, only a reconstitution each January. The ETF had the following sector allocations as of January 1, 2023, detailed here.
Portfolio Visualizer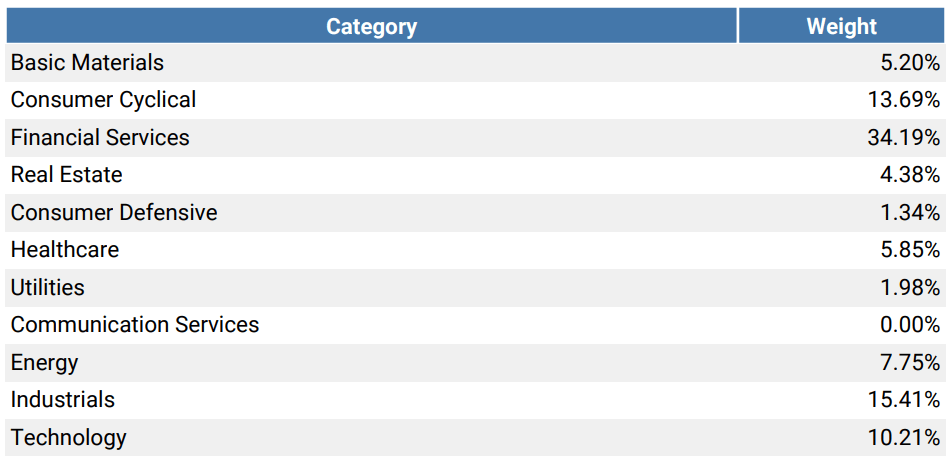
DGI generated $317 in portfolio income for the year on a $10,000 investment or 3.17% in yield. However, the yield improved to 3.34% (5.56% more) when rebalanced quarterly, as detailed here. Since a stock's dividend yield and price move in opposite directions, rebalancing, which involves buying losing stocks, means more of DGI's weight gets allocated to high-yielding stocks.
These results do not mean DGI's dividend growth isn't "real." On the contrary, it's an intelligent way investors can take advantage of the ETF structure, which allows a fund to exchange securities "in-kind" without creating a taxable event. However, it does mean an ETF's dividend growth is partially synthetic. Put differently, an ETF's dividend growth rate is not always consistent with its constituents' growth rate, and aggressive rebalancing schedules can mask potential problems. For example, perhaps those losing stocks DGI kept boosting each month declined in price because they were poor quality. As designed today, ETF screeners don't offer the ability to identify these issues.
Many analysts turn to an ETF's past performance and historical dividend growth rates when deciding if it's worth buying. This approach has limitations because it ignores what the ETF holds today, and I'm assuming it's done out of convenience. However, unless the ETF has specific ways it can filter for future top performers or dividend growers, you could hold a set of stocks with entirely different characteristics than the ones it held before. Funds with simplistic strategies like the SPDR S&P 500 High Dividend ETF (SPYD) are significant risks, as their single screen for yield tells you very little about the quality of the portfolio.
To illustrate, consider another hypothetical ETF with the ticker "WIN," which holds the top 100 best-performing stocks in the S&P 500 Index over the last year. As such, it's a pure momentum play, and there is no rebalancing throughout the year, only a reconstitution at the beginning of each January. In 2023, the ETF overweighted Energy, a sector that did well as inflation skyrocketed the year prior. However, for 2024, it overweighted the Magnificent Seven, which drove nearly all the market's returns last year.
Regardless if the strategy has merit, I would want to know that this year's portfolio is substantially different than the year before. The "WIN" ETF is momentum-focused, but since no consideration is given to other features like growth, valuation, dividends, and diversification, you risk owning a very unbalanced ETF that will only perform well in ideal circumstances.
Now, you might accuse market-cap-weighted ETFs like the SPDR S&P 500 ETF (SPY) as overly simplistic, too. However, the difference is SPY's weighting scheme promotes quality. The market has a way of rewarding highly profitable companies with higher capitalizations, but with many DGI ETFs, size is not a prominent screen. DGI investors need to be more careful.
My solution is simple: look at an ETF's performance and dividend growth features and consider its current composition and fundamentals because that's what you're buying today. A screener can get you started, but you shouldn't stop there. To demonstrate the fundamentals you should try to get your hands on, let's walk through the process using Seeking Alpha's ETF Screener.
The following 11 U.S. Equity ETFs have yields greater than 2.5%, five-year dividend growth rates above 5%, and assets under management above $1 billion. Let's use this as our launching pad to find four ETFs that could offer good future dividend growth potential.
Seeking Alpha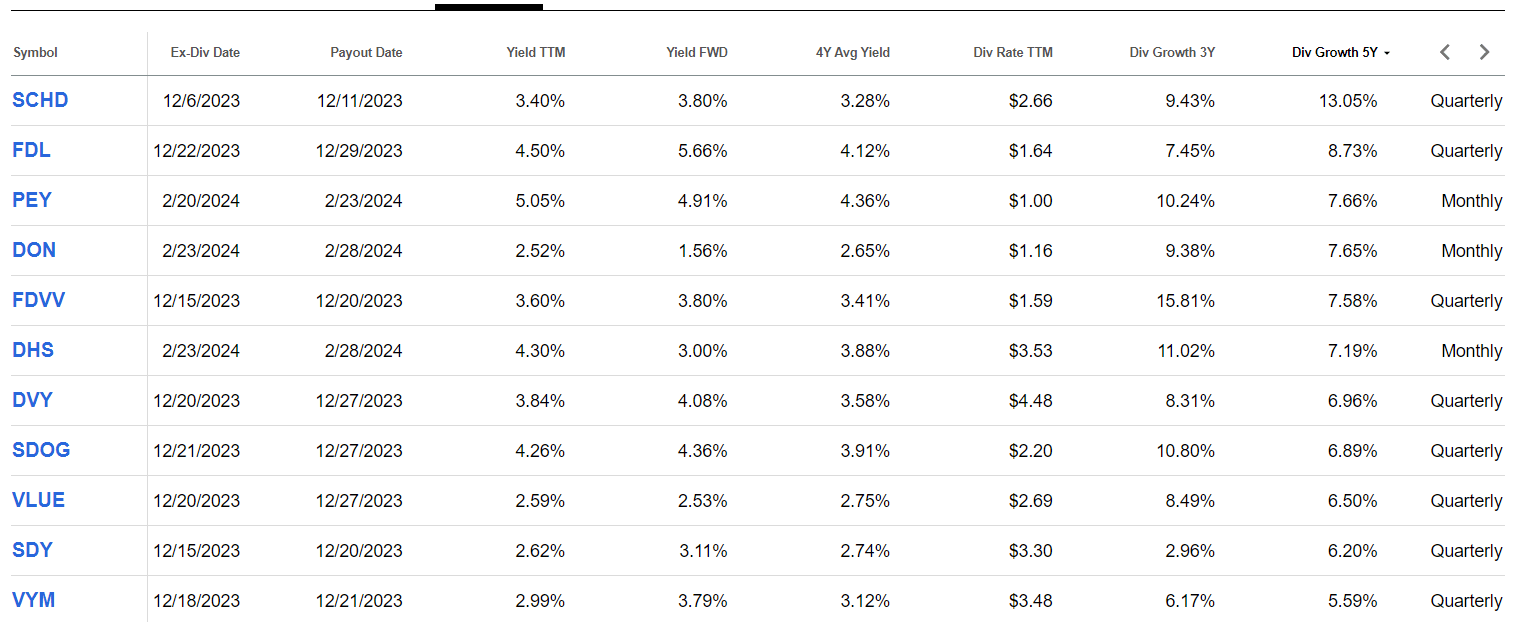
After sorting the list by five-year dividend growth, the Schwab U.S. Dividend Equity ETF (SCHD) is in first place. Its 3.40% dividend yield and 13.05% five-year dividend growth rate is a powerful combination and explains why so many DGI investors turn to it. Next are the First Trust Morningstar Dividend Leaders ETF (FDL) and the Invesco High Yield Equity Dividend Achievers ETF (PEY), which feature higher starting yields and less dividend growth. Finally, consider the Fidelity High Dividend ETF (FDVV) for its 15.81% three-year dividend growth rate. All seem promising, so let's look at each ETF's fundamentals in closer detail next.
The following table highlights select dividend metrics for each fund. The dividend yields and the dividend growth rates align with the screener results above, but I've also calculated several other metrics based on each ETF's current composition and fundamentals.
The Sunday Investor
Here are three takeaways:
1. The forward ETF Dividend Yield is calculated by the fund's weighted average dividend yield (i.e., Index yield) less the fund's expense ratio. They are usually close to the trailing yield, but FDVV is the exception. Its expected dividend yield is now less than 3%, mainly due to a 23% allocation to Technology stocks. Without looking at the holdings, there's no way an analyst would expect such a steep drop in dividend payments. Analysts might even criticize FDVV when the decline inevitably happens when, in actuality, the decline does not mean the holdings have reduced their payments.
2. Technically, an ETF doesn't have a dividend payout ratio. However, you can still learn about an ETF's dividend safety by calculating its constituents' weighted average payout ratio. Notice how SCHD and PEY's ratios are somewhat elevated at 66%, while FDVV's is much lower at 47%. From a dividend safety perspective, you might give the edge to FDVV. FDVV also has a higher Dividend Safety Score (7.70/10 vs. 7.44/10), which I calculated using individual Seeking Alpha Factor Grades.
3. Conversely, SCHD's constituents have shown a greater willingness to increase dividends, evidenced by a higher Dividend Consistency Score (8.38/10 vs. 7.80/10) and the fund's twelve-year dividend growth streak. DGI investors should weigh this willingness against an ETF's ability to increase dividends and, if possible, find one that does both.
There's also a difference between the ETF's five-year dividend growth rate and the five-year dividend growth rates of each ETF's current holdings. Both are listed below but think of the second one as what you'd find had you used an individual stock screener instead.
Among all U.S. Equity ETFs with trailing dividend yields above 2.50%, the difference between the ETF's five-year dividend growth rate and that of its constituents is 1.69% (8.12% vs. 6.43%). This difference is expected, given how regular rebalancing can accelerate dividend growth. However, the gap is wider with SCHD, which could be our first clue that its 13.05% growth rate is unsustainable. The ETF is set to reconstitution later this month, and in my analysis, I will evaluate this possibility.
Next, I want to examine the quality of each fund. DGI investors buying individual stocks look at these metrics, but unfortunately, ETF screeners don't include them.
The Sunday Investor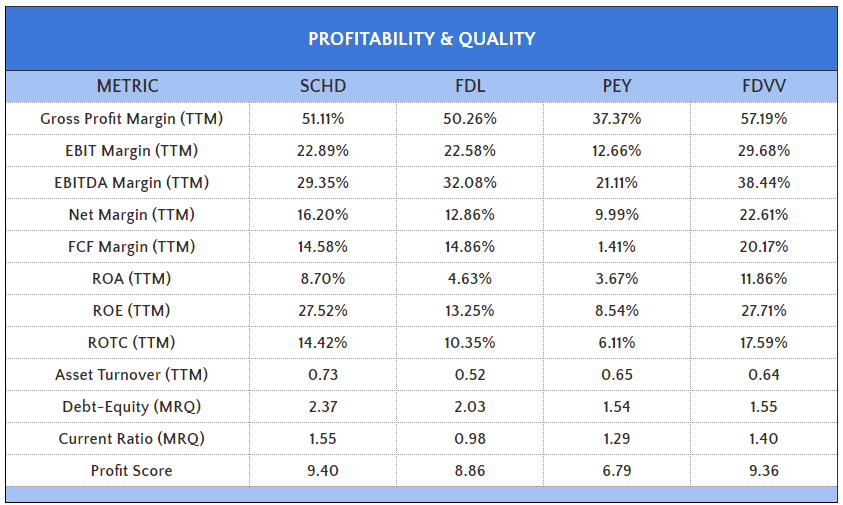
Here are two takeaways from this table:
1. FDVV's 20.17% free cash flow margins are the best, indicating it has the greatest ability to grow dividends the fastest. Furthermore, FDVV's margins are better across the board. Again, you'll have to weigh this against less willingness to increase dividends than SCHD and be satisfied with a lower starting yield.
2. PEY's 1.41% free cash flow margins and weak 6.79/10 profit score underscore how difficult it will be for the ETF to grow dividends organically. PEY is highly concentrated, with only 50 holdings, and relies on quarterly rebalancings to boost yield. Otherwise, the margins don't allow for high dividend growth, and PEY is also one of the worst-diversified by sector, with two-thirds in Consumer Staples, Financials, and Utilities.
3. SCHD's weighted average debt-equity ratio is elevated at 2.37, which may have contributed to its underwhelming performance over the last year. Between March 2023 and February 2024, SCHD's 8.06% total return ranked #66/87 in the large-cap value category. Meanwhile, FDL and FDVV ranked #72 and #24, respectively. For those wondering about the top performers, please check out my review of the Capital Group Dividend Value ETF (CGDV) here. CGDV is up 29.49% over the last year, though its 1.56% yield is unattractive.
As I stated before, companies that don't grow sales and earnings per share will have difficulty increasing dividend payments. Here's how the four ETFs compared on a variety of growth metrics:
The Sunday Investor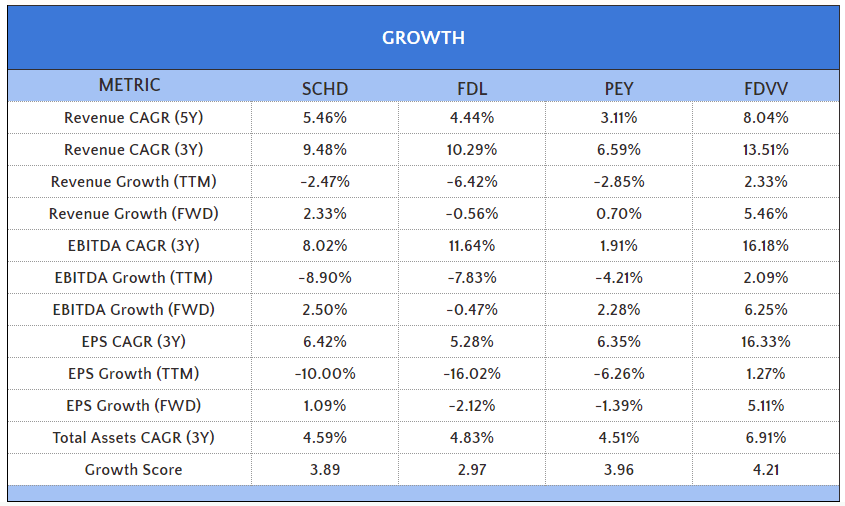
Here are two takeaways from this table:
1. The trailing one-year EPS growth rates are concerning. FDVV's 1.27% growth rate looks excellent by comparison, but when considering its position against 97 large-cap value ETFs, it ranks just #57. SCHD and FDL rank #91 and #94. These weak growth rates explain why dividend funds have lagged in this growth-focused market. However, it's also bad news from a dividend growth perspective. To illustrate, SCHD's trailing payout ratio in March 2023 was approximately 49%, but today, it's 66%. An increased payout ratio must happen if companies insist on growing dividends despite declining earnings. They can keep this up for a bit, but something has to give eventually.
2. Estimated earnings per share growth rates are better but still not enough to support the 5%+ dividend growth rate of each ETF's constituents. Three-year EPS growth rates are about 5-6% for SCHD, FDL, and FDVV, and this is probably a more realistic dividend growth rate moving forward. Otherwise, payout ratios will get stretched too far. The average payout ratio for the 11 ETFs screened initially is 55.41% compared to their 51.57% four-year average. I'd like to see this trend reverse, so that's why I place more emphasis on sales and earnings growth for dividend ETFs compared to other analysts.
Since a company's dividend and share price are inversely correlated, dividend ETFs typically fall into the value category. As such, you'll often get a nice discount to make up for the weak growth. The following table summarizes various valuation metrics calculated using the weighted average method. Please note that this calculation method results in higher values than on sites like Morningstar, which uses the harmonic weighted average method.
The Sunday Investor
To give you an idea of the discount offered, SPY trades at 26.70x forward earnings, so SCHD is discounted by 10.10 points (17.60x vs. 26.70x). You can get an even more significant discount with FDL and PEY, but that likely reflects their weaker growth and quality features.
The purpose of this article was to highlight common mistakes DGI investors in ETFs make during the screening process. ETF screeners are inadequate because they don't include filters for metrics like payout ratios, growth rates, and profitability. Furthermore, the metrics they do include, such as an ETF's five-year dividend growth rate, may not reflect the current constituents due to reconstitutions and portfolio turnover, and aggressive rebalancing schedules can falsely suggest an ETF's holdings are increasing dividends quickly.
This article evaluated four popular DGI ETFs and demonstrated that, while their five-year dividend growth rates are strong, each brings something unique. SCHD nicely blends quality, dividend yield, and dividend growth, but it's unlikely to offer the same dividend growth moving forward. FDL has a low P/E, but its constituents had -16% earnings growth over the last year, so it might be a case of "you get what you pay for." PEY is also deeply discounted, but its free cash flow margins are too low to generate much future dividend growth. Finally, FDVV has solid dividend growth, safety, and consistency features, but its 3% or less expected yield and relatively high P/E might not attract the typical value/dividend investor.
Regardless of your preferred style, this is the analysis framework I recommend. Using ETF screeners as your launching pad is fine, but understand that more due diligence is required, and DGI investors should seek the same type of information with ETFs that they would typically want for individual stocks. I hope you enjoyed this analysis, and I encourage you to reach out with questions on other dividend ETFs in the comments section below. Thank you for reading.