
erdikocak/iStock via Getty Images
erdikocak/iStock via Getty Images
Healthcare Realty Trust Incorporated (NYSE:HR) today trades near a decade low price, down almost 30% over ten years, and almost 50% in the last two years. The current 8.9% yield is attractive, but is also at risk.
HR's strategy to improve results has been to use increased scale to leverage operational and leasing efficiency, driving increased occupancy and eventually revenue. In addition, sharply rising construction costs for new buildings support the value of existing assets.
However, the market appears to have lost patience. The benefits of a major acquisition 20 months ago have been slow to be realized, and improvements are likely to be incremental rather than transformative.
Yet, the business of the REIT, leasing medical office building space, is better understood as competitive rather than in decline. Demand for medical services is expected to grow for decades.
Today's $13.88 price offers a potential 25% capital gain to Wall Street's target price and an 8.9% yield-on-cost with the current dividend. A much safer $1.00 per year (i.e., after a 19% cut) dividend would yield a still attractive 7.2%.
Investors looking for a what should be a relatively stable bond equivalent backed by physical assets may find HR an attractive option at the current price.
I last wrote about Healthcare Realty Trust Incorporated in September 2022. The stock was trading near $25, and I rated it a Hold at the time, but that prognosis was too optimistic - the stock has since declined by over 40%.
Recall that the merger between HR and Healthcare Trust of America, Inc. (“HTA”, no longer traded) was announced on 28 February 2022, and closed on 20 July 2022. Both REITs were leaders in the Medical Office Building "MOB" market (sometimes now called the Outpatient Medical Facility "OMF" market).
The new HR became "the largest pure-play MOB REIT" with nearly twice the MOB market share of its nearest competitor.
The key benefits projected at that time were unmatched scale to drive operation and leasing efficiency, broader and deeper relationships with health systems, an expanded development pipeline, ~$35 million first year savings from synergy, and eventually increased occupancy and rents, lower borrowing costs, and improved per share results.
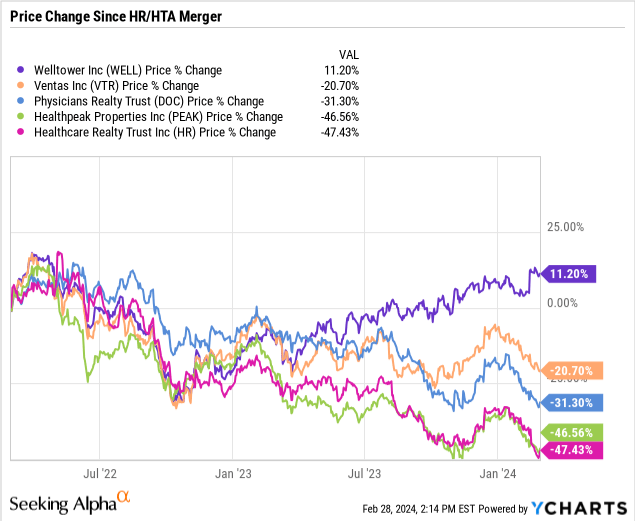
The market has not been impressed with the results delivered to date. The chart below shows the price changes since the February 2022 merger announcement for HR, and major MOB competitors Physicians Realty Trust (DOC), Healthpeak Properties, Inc. (PEAK), Ventas, Inc. (VTR), and Welltower, Inc. (WELL). Note that MOBs make up less than 25% of the WELL and VTR portfolios.
The forward looking assessments, particularly Seeking Alpha's Quant Ratings, are not enthusiastic for HR, or the MOB REITs generally.
MOB REIT Ratings (Seeking Alpha)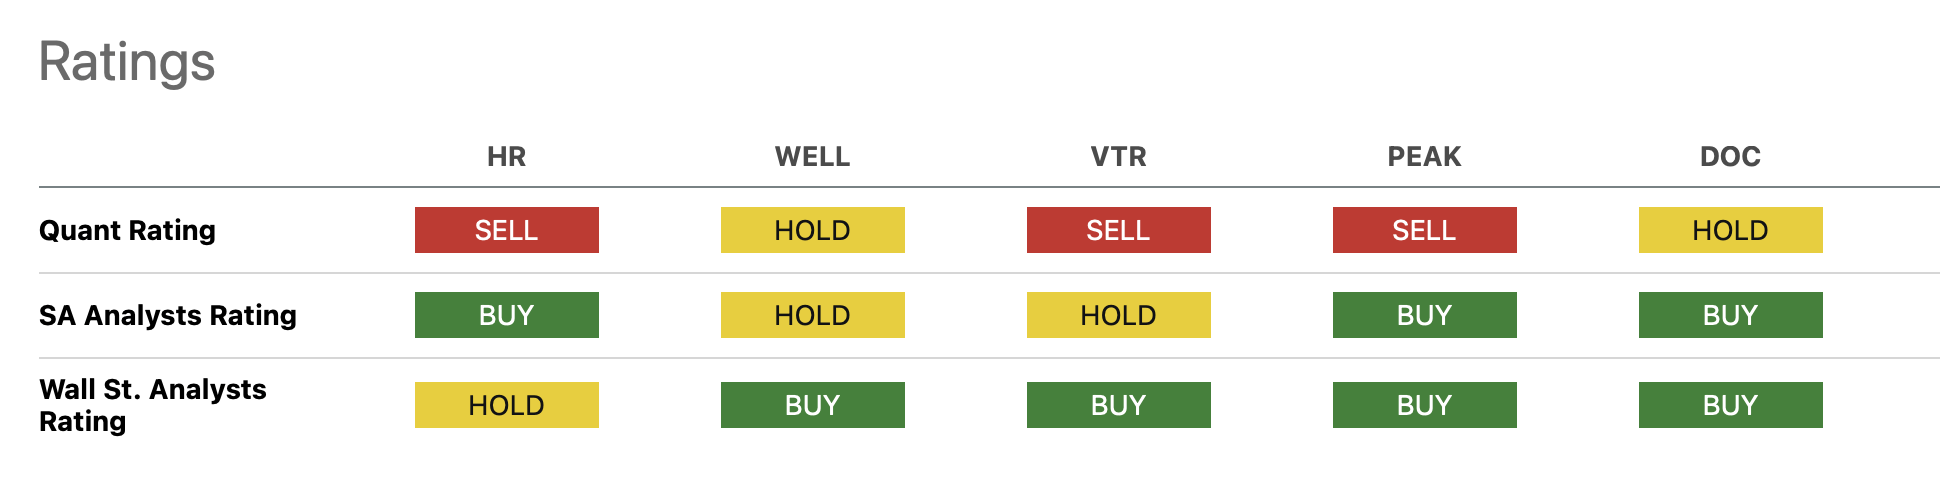
Note that PEAK and DOC merged on 01 March 2024. Effective 04 March, the combined company will be Healthpeak Properties, Inc. (DOC) and will trade under the DOC symbol. The pre-merger names and symbols are used in this article, and charts and comparisons were done immediately prior to the effective date, to maximize the comparison data available.
Primary data sources for this article include HR's 5 October 2023 Investors Day material, and the 2023 Form 10-K Annual Report, the Q4 2023 Supplemental, and the Q4 2023 Earnings Call, all dated 16 February 2024.
Abbreviations used: square feet is SF, MSF million square feet is MSF, net operating income is NOI.
In this article we will look at 2023 results, the question of scale, operational and leasing efficiency, occupancy, debt, the dividend, valuation, risks, and wrap up with an investor takeaway.
Results here are for the year 2023 or status as of 31 December 2023, unless otherwise noted.
In selecting properties, the company focuses on "facilities primarily located on or near the campuses of acute care hospitals associated with leading health systems". About 72% of the portfolio is on or adjacent to hospital campuses.
The portfolio includes 688 total properties, of which 33 are unconsolidated joint ventures "JV" properties with an average 43% HR share. The consolidated properties account for 94.9% of the total SF. The portfolio's 40.2 million SF is spread across 69 markets in 35 states.
MOBs account for 96.5% of the properties and 93.2% of the SF in the consolidated portfolio. Inpatient care accounts for 15 properties (2.3%) and 2.4% of the SF. Office accounts for 8 properties (1.2%) and 4.3% of the SF.
About 232 properties are held under ground leases; the weighted average remaining term of the ground leases is 65 years.
Gross book value of unencumbered real estate assets ~ $13.2 billion.
HR provides property management and leasing for 93% of the portfolio.
(Forecasts shown here are the mid-point of HR's guidance range).
Revenue was $1.3 billion in 2023.
FFO/share was $1.43 in 2023, forecast $1.45 in 2024, up 1%.
Normalized FFO/share was $1.57 in 2023, forecast $1.55 in 2024, down 1%.
FAD/share $1.15 in 2023, no forecast for 2024.
Forecast 4.1% growth in multi-tenant cash NOI for 2024, 1.0% growth for single tenant.
Paid $472 million in dividends 2023. No change is expected in 2024.
Contractual rental rate growth for in-place leases averaged 2.82%, at year end, up from and 2.77% at year end 2022.
Average rental rate growth for renewing leases ("cash leasing spread") averaged 2.6% in 2023. For Q4 2023, weighted average cash leasing spreads on renewals was 3.3%. HR expect expects the majority of its lease renewal rates to increase between 3.0% and 4.0% entering 2024.
HR paid leasing commissions of $36 million in 2023, about 4.3% of cash NOI.
The company's share of operating expense vary by lease type.
Capital expenses were $48 million, or $1.24 per SF, in 2023, flat with $49 million in 2022, amounting to 5.8% and 8.5% of cash NOI respectively. Capital expenses "do not include improvements related to a specific tenant suite, unless the improvement is part of a major building system or common area improvement."
In 2023, the company spend $39 million and $64 million in first and second generation tenant improvements; second generation spending was 7.7% of cash NOI. In addition, the company has commitments to spend $222 million on tenant improvements throughout the portfolio (excluding development properties currently under construction).
Second generation, multi-tenant tenant improvement commitments in 2023 for renewals averaged $1.78/SF per lease year, while commitments for new leases were 3x more expensive at $5.69/SF.
In 2023, HR bought two medical office buildings for $43 million, with a 6.5% cap rate.
HR sold 39 properties for $787 million, with net cash proceeds of $688 million, at a 6.5% cap rate.
HR characterized its 2023 dispositions as "portfolio cleanup"; less likely to be multi-tenant, MOBs, clustered, and on or near a hospital campus than the overall portfolio, and with 70 basis point lower escalators.
By comparison, nationally MOBs traded for an average 7.0 cap rate in Q4 2023, with the gap between on and off campus narrowing during the year.
At year end, HR is actively developing five properties, which will provide 484,000 SF, at an estimated total cost of $216 million ($446/SF).
Nine properties with 801,000 SF are in active re-development, at an estimated total cost of $80 million.
Projected stabilized yields are 6.5-8.0% for development and 9.0-12.0% for redevelopment.
2023 funding was $69 million and $21 million respectively, with an additional $22 million funded for tenant improvements at previously completed projects.
Net debt to adjusted EBITDA was 6.4x at year end; 8% of debt was variable rate.
The dividend is currently $0.31 per quarter. Dividend has varied from $0.29 to $0.325 per quarter from Q4 2014 to today.
Dividends and OP distributions were 108.3% of FAD for 2023, a $37 million shortfall. Dividends and distributions are about $119 million per quarter.
A $750 million at-the-market "ATM" stock sales program in place, and in May 2023 HR authorized a $500 million stock purchase program. No stock was sold or bought under either program in 2023.
HR has about 380 million common shares outstanding, no preferred shares, and is rated BBB by S&P. They employ about 580 people.
The question of scale is central to assessing HR's strategy and prospects.
The primary issue facing HR, and the other MOB REITs, is that MOB space is functionally almost a commodity.
Some landlords, including HR, tout the value of proximity to a hospital. This creates a natural cap on supply - only so many buildings can be actually on, or adjacent (typically within 1/4 mile of campus) to a hospital campus. For some tenants, proximity to a hospital campus is a critical factor, for others it's far down the list.
A September 2023 analysis by Revistamed suggests that generally the proximity premium is real, but not huge - perhaps ~10% based on the data below.
MOB Proximity to Hospital Premium (revistamed blog )
Medical office space is at least to a degree fungible with other office and even non-office space. To quote from my previous article:
The effect in to provide the potential renter with an ever present and usually cheaper alternative to investment grade on-campus / near-campus buildings.
Highly fragmented property ownership amplifies this problem, and often leaves landlords as price takers in a buyer's market.
HR believes scale is an important, perhaps essential, driver for superior financial performance in the MOB space. It's a significant component of their value proposition to investors.
The impact of scale occurs at three levels: corporate, market, and sub-market.
Sounds great. Let's look at why the benefits of scale may be elusive.
The March 2023 HR/HTA merger presentation includes an estimate of the size of the $460 billion outpatient/MOB market (2022 year end data) and the split among four owner types. Hospitals own 52%, provider/government/other own 10%. Investors own 37%, split between non-REITs with 24% and REITs with 13%.
There are five healthcare REITs that materially compete in the MOB space. The emphasis and magnitude of MOB investments varies.
MOB Footprint in Health Care REITs (HR Investor Presentation)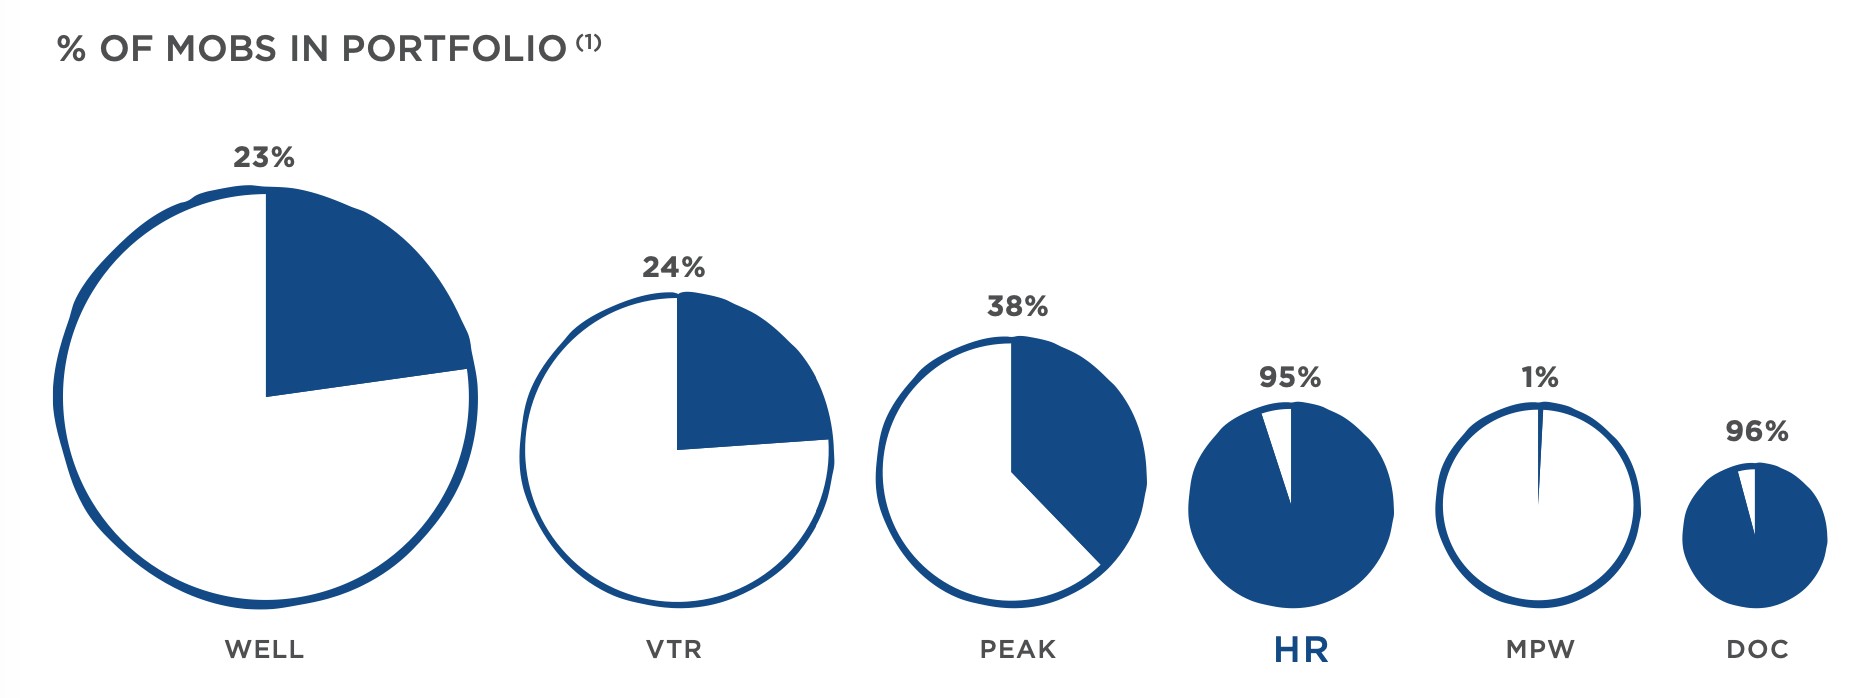
MOB Assets by Market (HR Investor Presentation)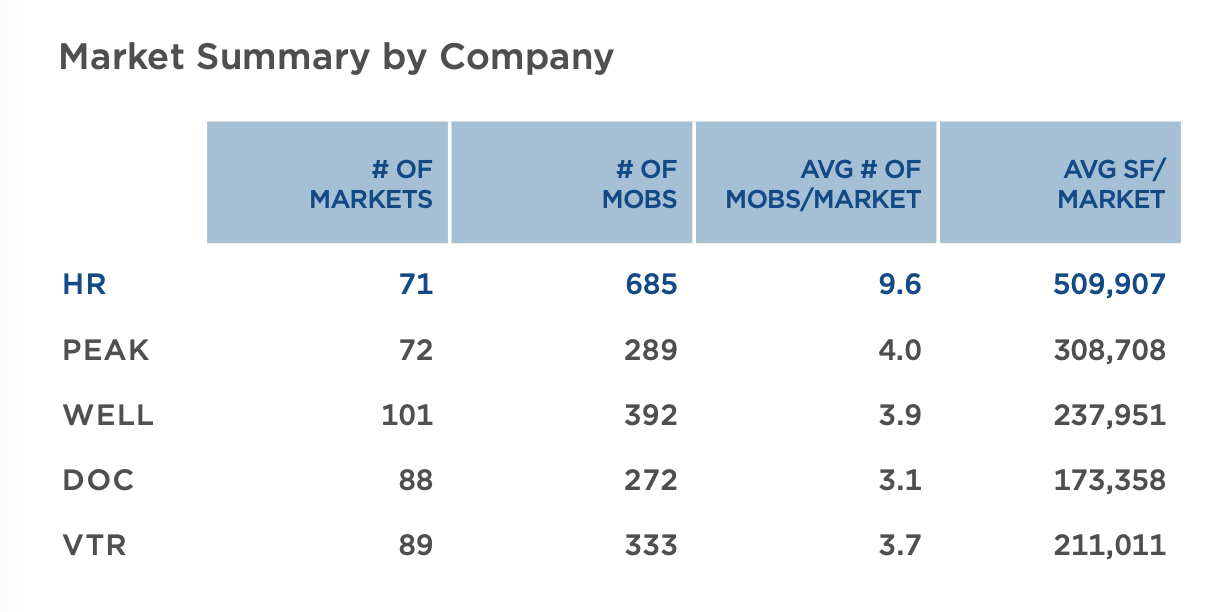
HR owned 35% of these 1,971 buildings, making it the leading, if not dominant REIT in the MOB space. However, in the context of the entire MOB asset class noted above, a 35% share of the REIT market is only about a 4.5% share of the asset class.
This fact looms in the background when HR talks about the advantages of scale.
As the table above notes, the MOB assets for each REIT are spread across 70-100 markets. HR averages more buildings and more SF in each of their markets that the other REITs - typically 2-3x.
HR defines markets at the level of Metropolitan Statistical Areas "MSA." They use one MSF as the benchmark to assess and report scale, and have achieved that in 15 markets. These top 15 markets represent 60% of the portfolio.
In 13 of these 15 markets, HR has the largest market share among public REITs. The merger with HTA was a big step in achieving scale, added 10 markets to this group.
HR Market Share Leadership (HR Investor Day Presentation)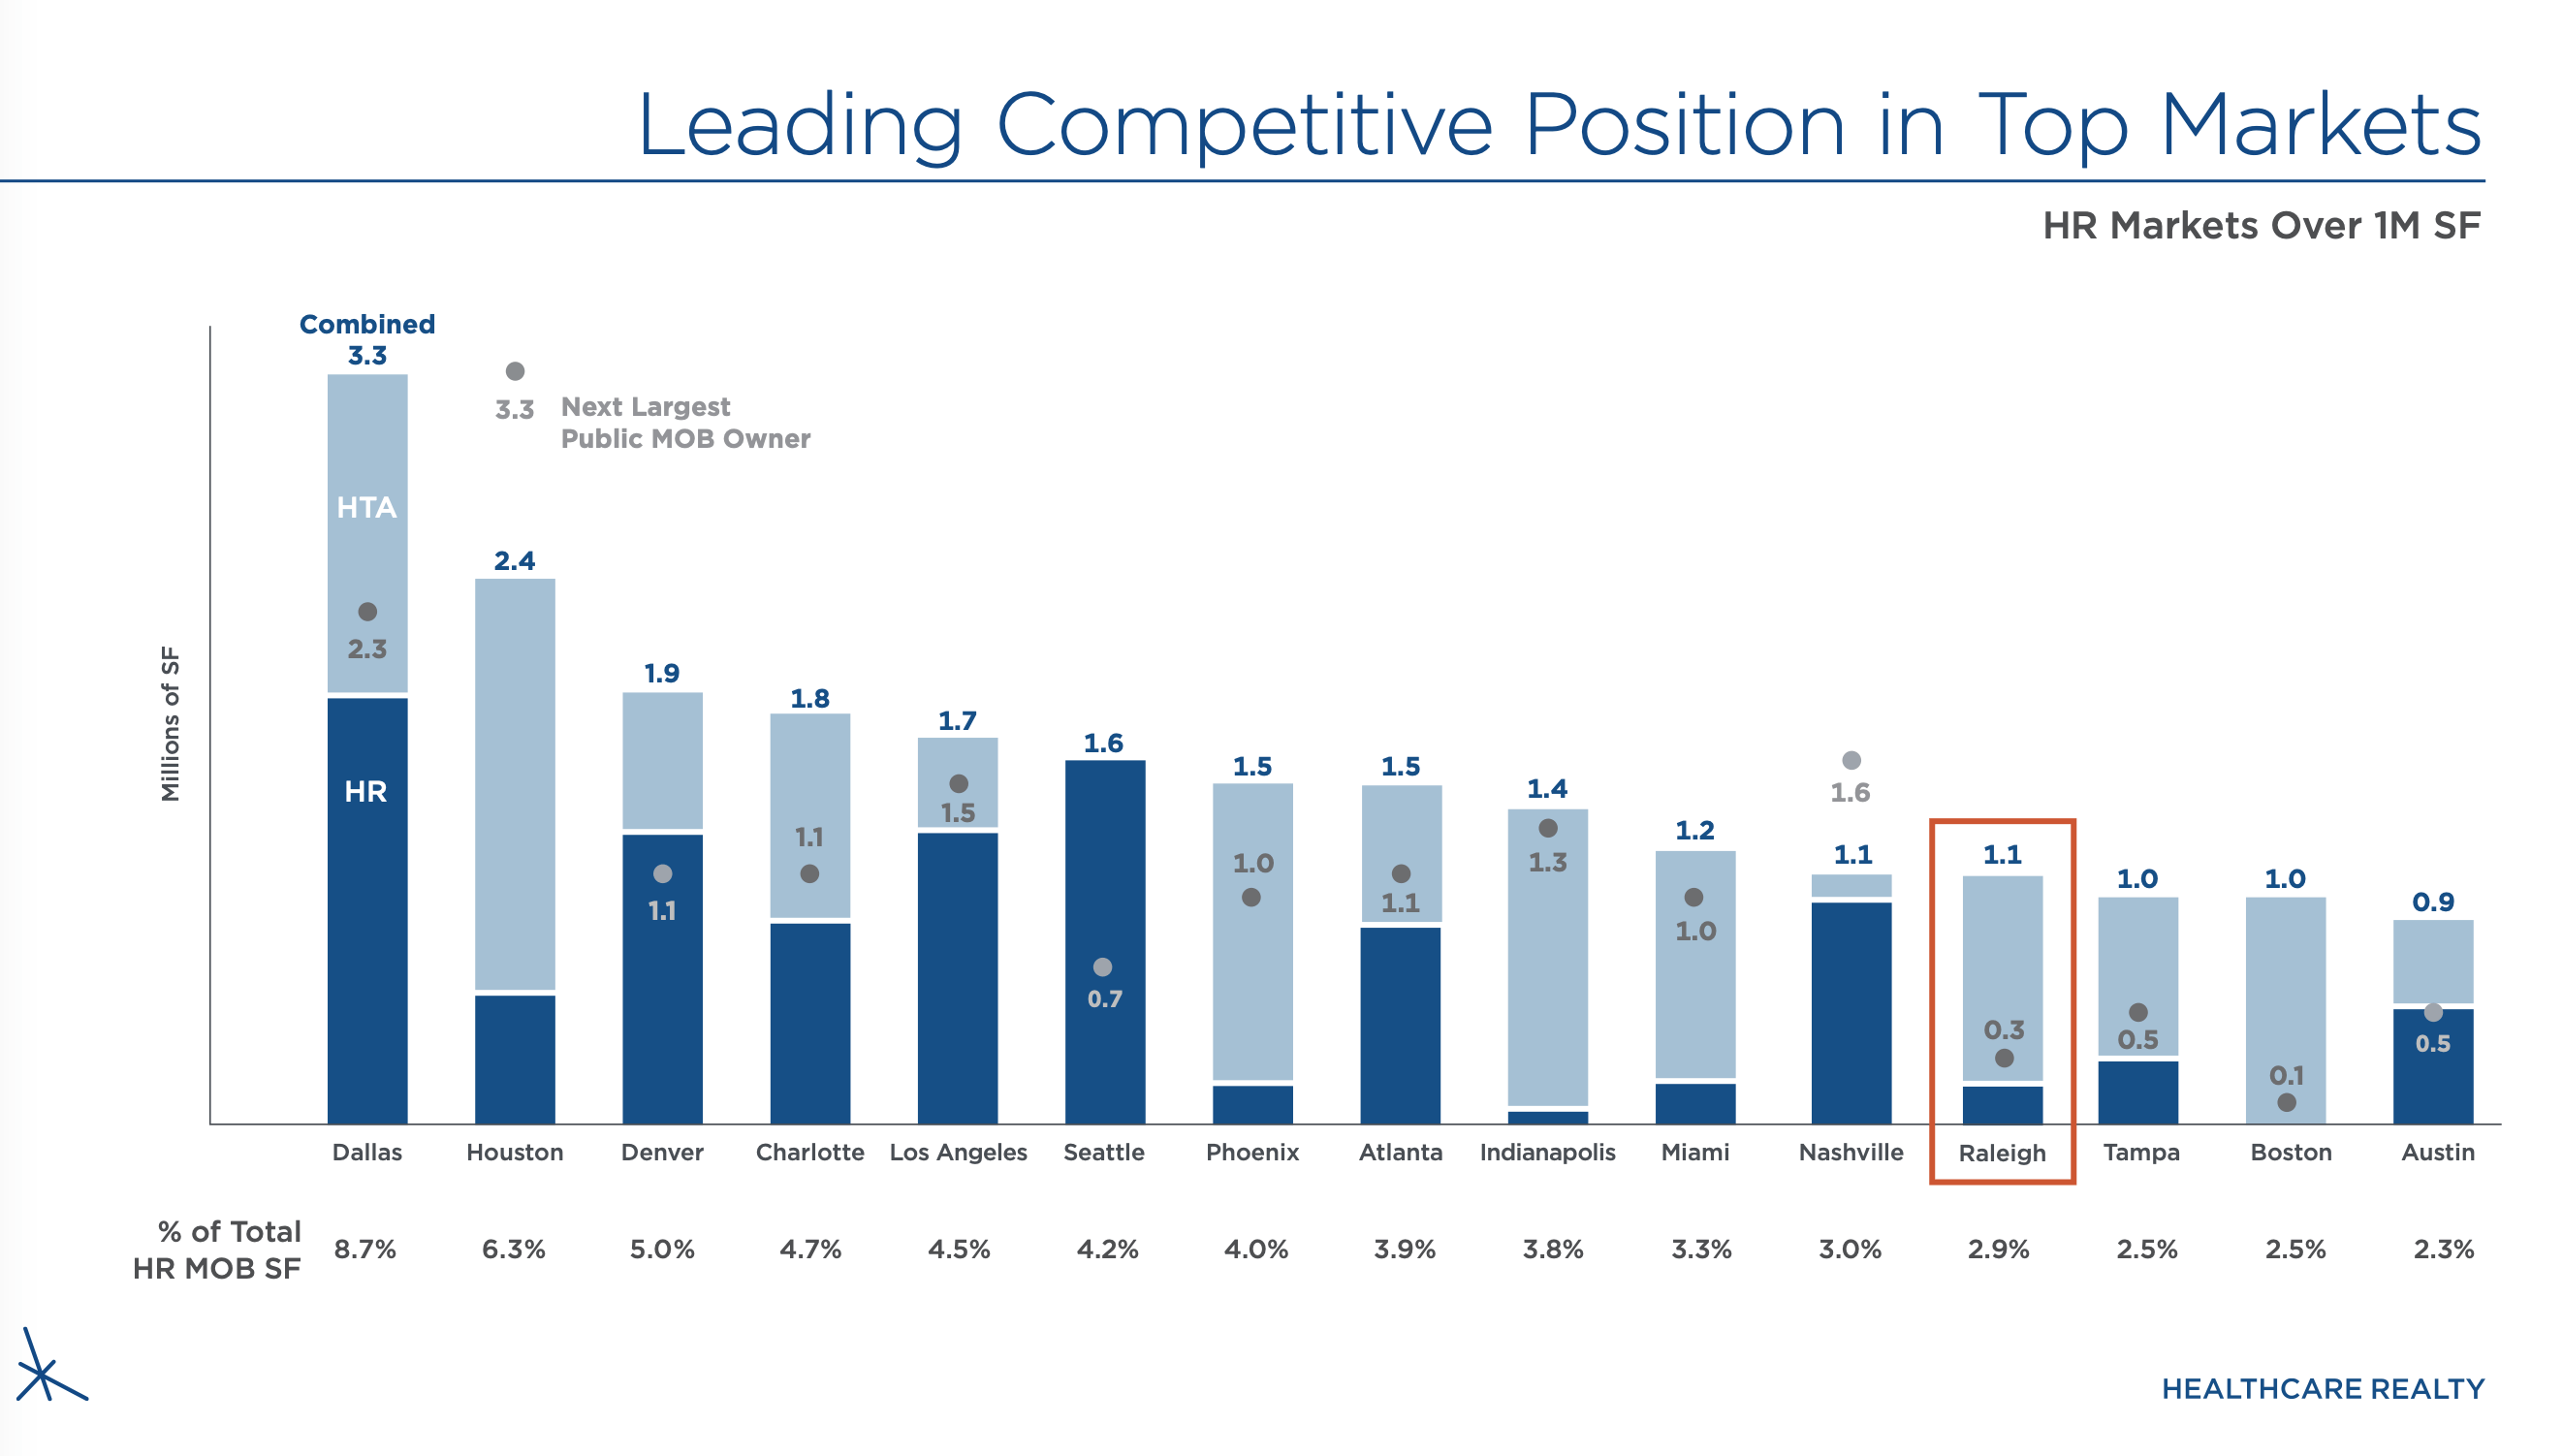
In the Raleigh market for instance, HR owns 27 of 91 competitive MOB properties, for a 29% share (by building count).
Market scale at the MSA level can drive operational and leasing efficiency, but it appears that sub-market concentration is required to provide pricing power.
Top 50 MSA markets (about one million people or larger) typically have multiple sub-markets, each centered around a hospital campus. For example HR's number two market, Houston, the fifth largest MSA is the U.S., is roughly a rectangle 100 miles on a side, with a population of over 7 million. There are dozens of sub-markets in that market.
HR's benchmark for analysis of the concentration in sub-markets is clustering, where "a cluster is defined as at least two properties within a geographic radius of two miles." Ideally clusters have significantly more than two properties.
Based on pre-merger data, HR analysis found that their MSF markets demonstrated more clustering and higher occupancy (170 basis points), cash leasing spreads (227 bps), and annual rent bumps (11 bps).
About 474 properties, accounting for 70% of MOB SF, are clustered.
But as noted during the Investor Day event, the real pricing power advantage to the landlord occur when they have both a footprint concentrated in specific sub-market, and reach 90% or better occupancy.
Reading between the lines, I think the real goal is to dominate sub-markets to the extent that quasi-monopolistic pricing is possible. Or put another way, to build a moat. To do this efficiently means multiple sub-markets per market.
HR has set a target of 90% occupancy for their multi-tenant buildings. They are reluctant to set a schedule, but it's clearly beyond 2024.
The merger (announced 30 October 2023, closed 01 March 2024) between Healthpeak Properties, Inc. and Physicians Realty will create a competitor of similar scale with over 1 million SF in 13 markets.
The combined portfolio includes an outpatient medical segment of 573 buildings with 40 million square feet, including 10 markets with over 1 million square feet, plus a lab segment of 146 buildings with 12 million SF.
Combined PEAK + DOC Scale (PEAK Investor Presentation - Oct 2023)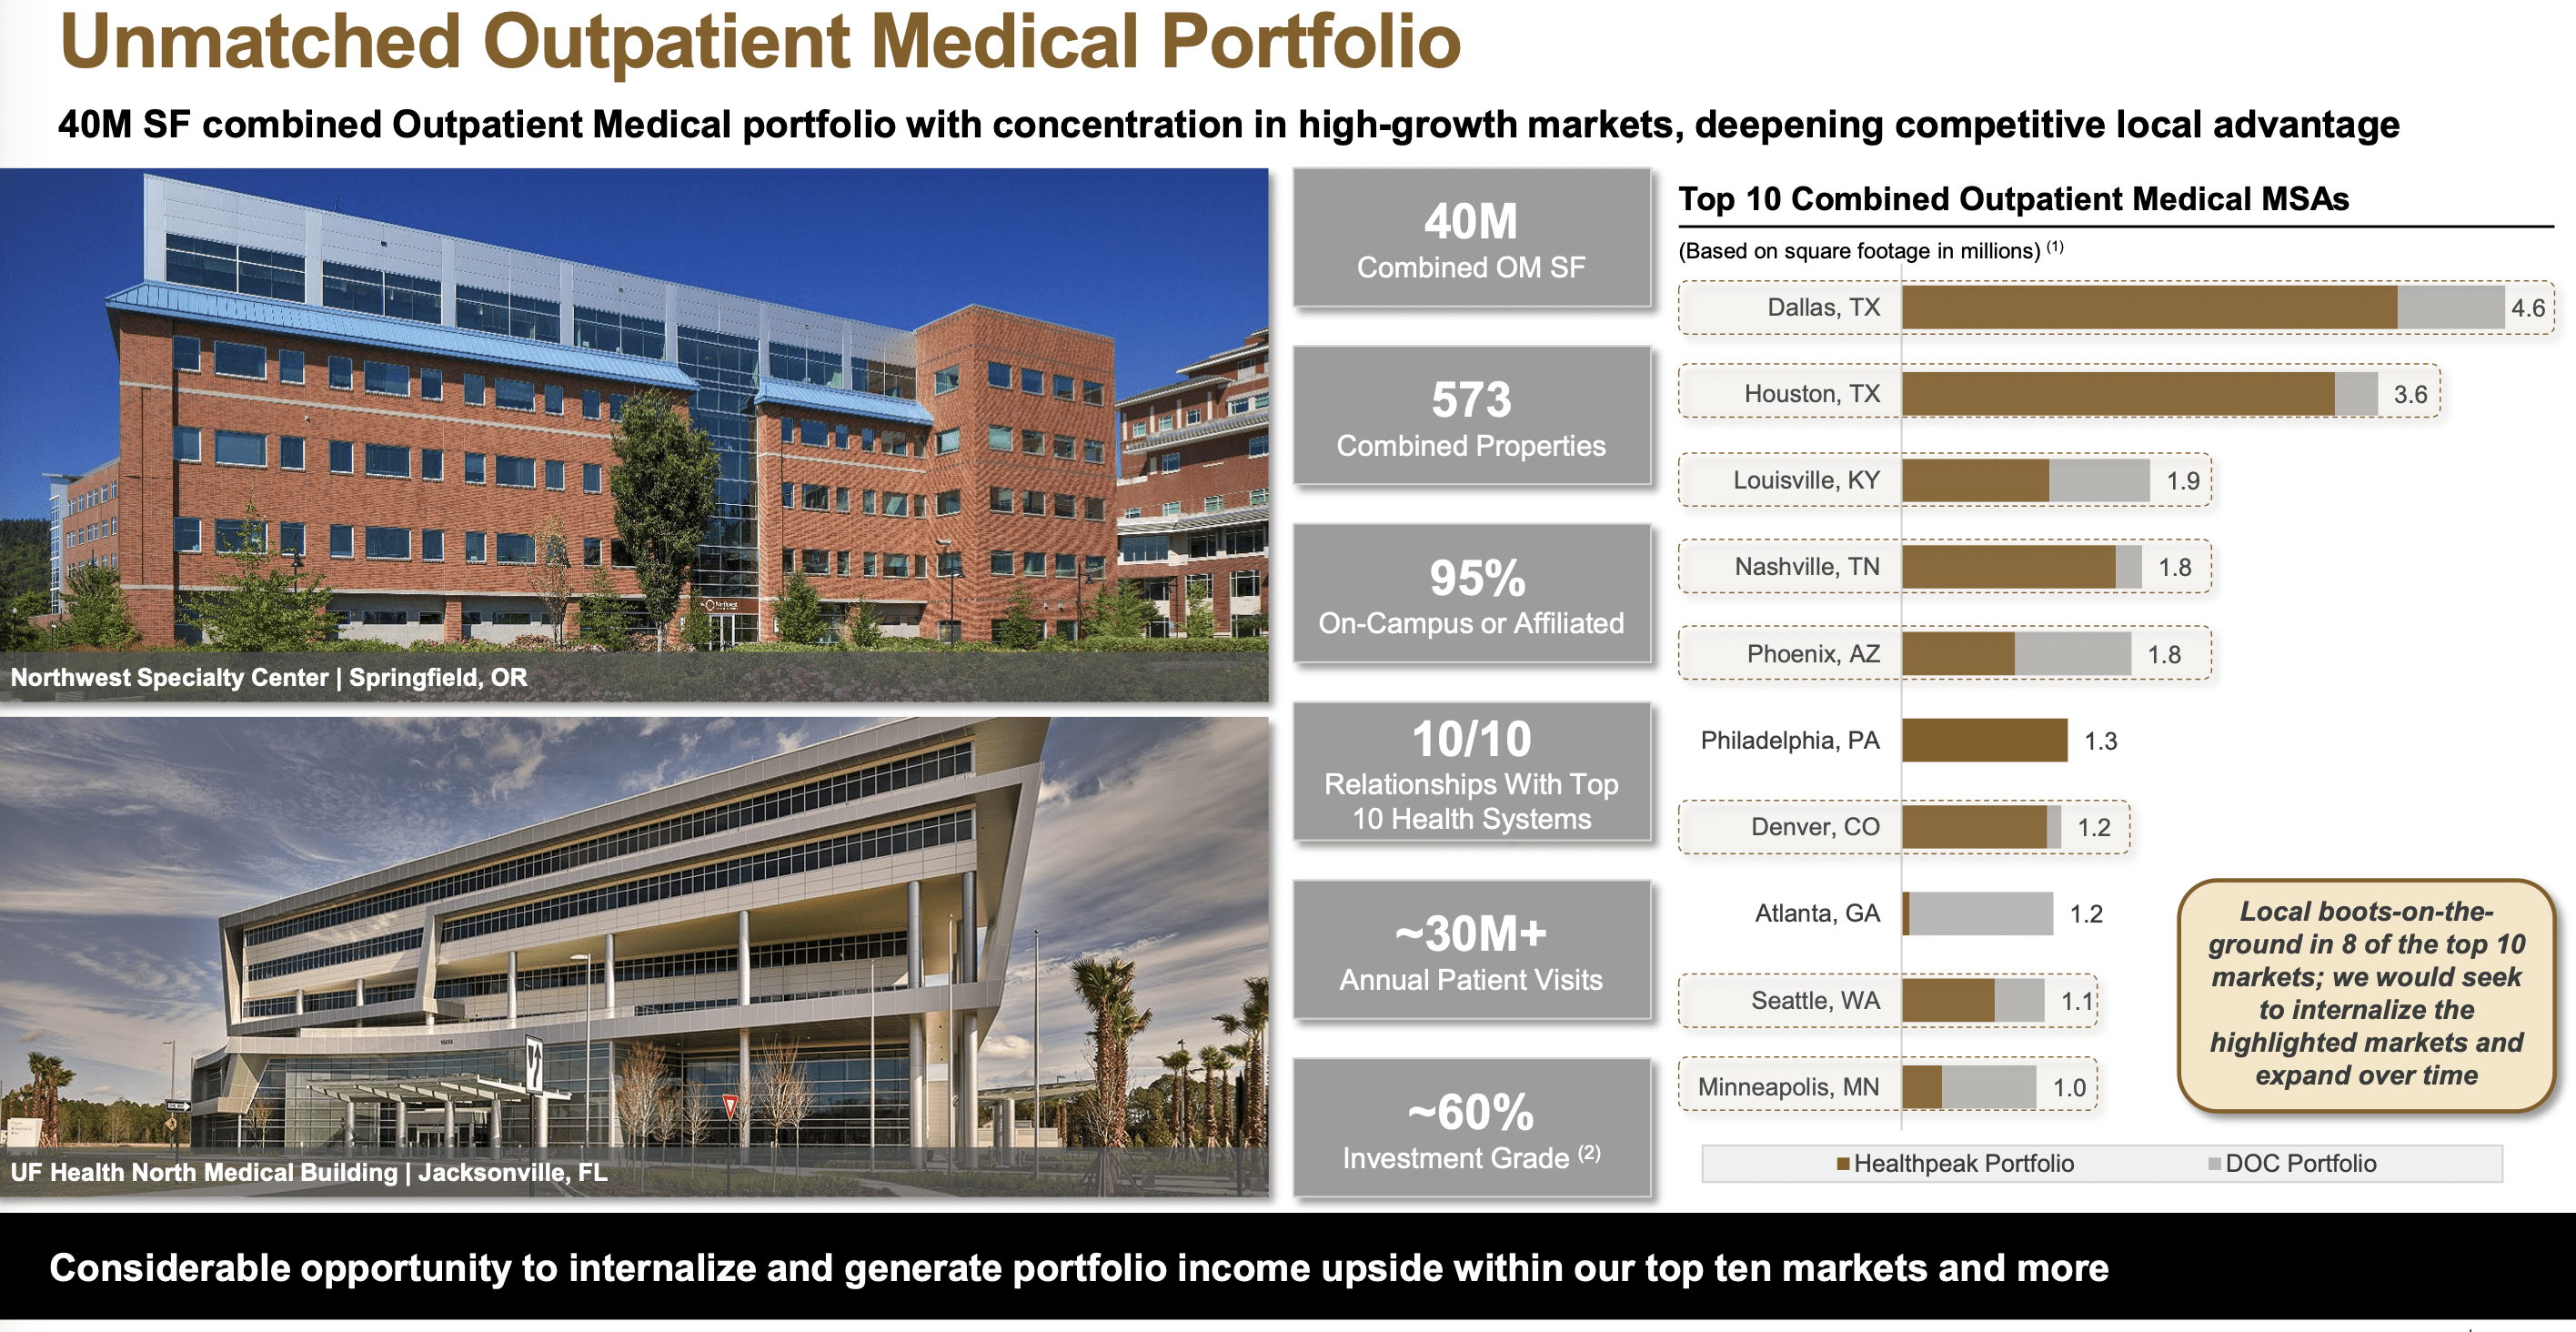
One might view this merger as copying and validating HR's scaling strategy. It's notable that Dallas and Houston will be their two largest markets, as is the case with HR.
If scale is central to HR's value proposition, it's reasonable to consider the prospect at this point for material increases in scale. They seem limited.
With the merger of DOC into PEAK, the last standalone REIT focused on MOB assets matching HR's strategy (prime buildings, on or near hospital campus), particularly one that might accept an all-stock deal, is off the table.
HR could grow scale by 50% by acquiring the MOB assets of either WELL or VTR, but neither seem likely to divest them, and would probably demand cash rather than stock. Either is probably beyond HR's grasp.
Privately held portfolios might offer a possibility, and they might be willing to take stock. But considering that it would take ~ 35 building portfolio to grow HR 5%, it would take a series of small deals to move the needle; a deal focused on a few selected sub-markets might be useful.
Organic growth via development and redevelopment, which is impacting less than 1% of the portfolio a year, is going to be very slow.
It seems more likely that HR itself might become an acquisition target. Merging into the combined PEAK + DOC would really provide an interesting test of scale.
Operational and leasing efficiency benefits from scale, and drives occupancy.
Increased scale at the company and market level should both allow and encourage increased operational and leasing efficiency.
At the corporate level, this primarily results from spreading the burden of overhead costs (management, legal, IT, public company reporting, etc.) over a larger asset base. It's usually quite visible to management, and is reflected in a reduced G&A burden. This was one of the goal of the HR/HTA merger, and HR appears to do fairly well here. It is explicitly one of the motivations for the PEAK + DOC merger. Generally increased scale will also lower borrowing costs.
G&A Load For MOB REITs (HR Investor Presentation)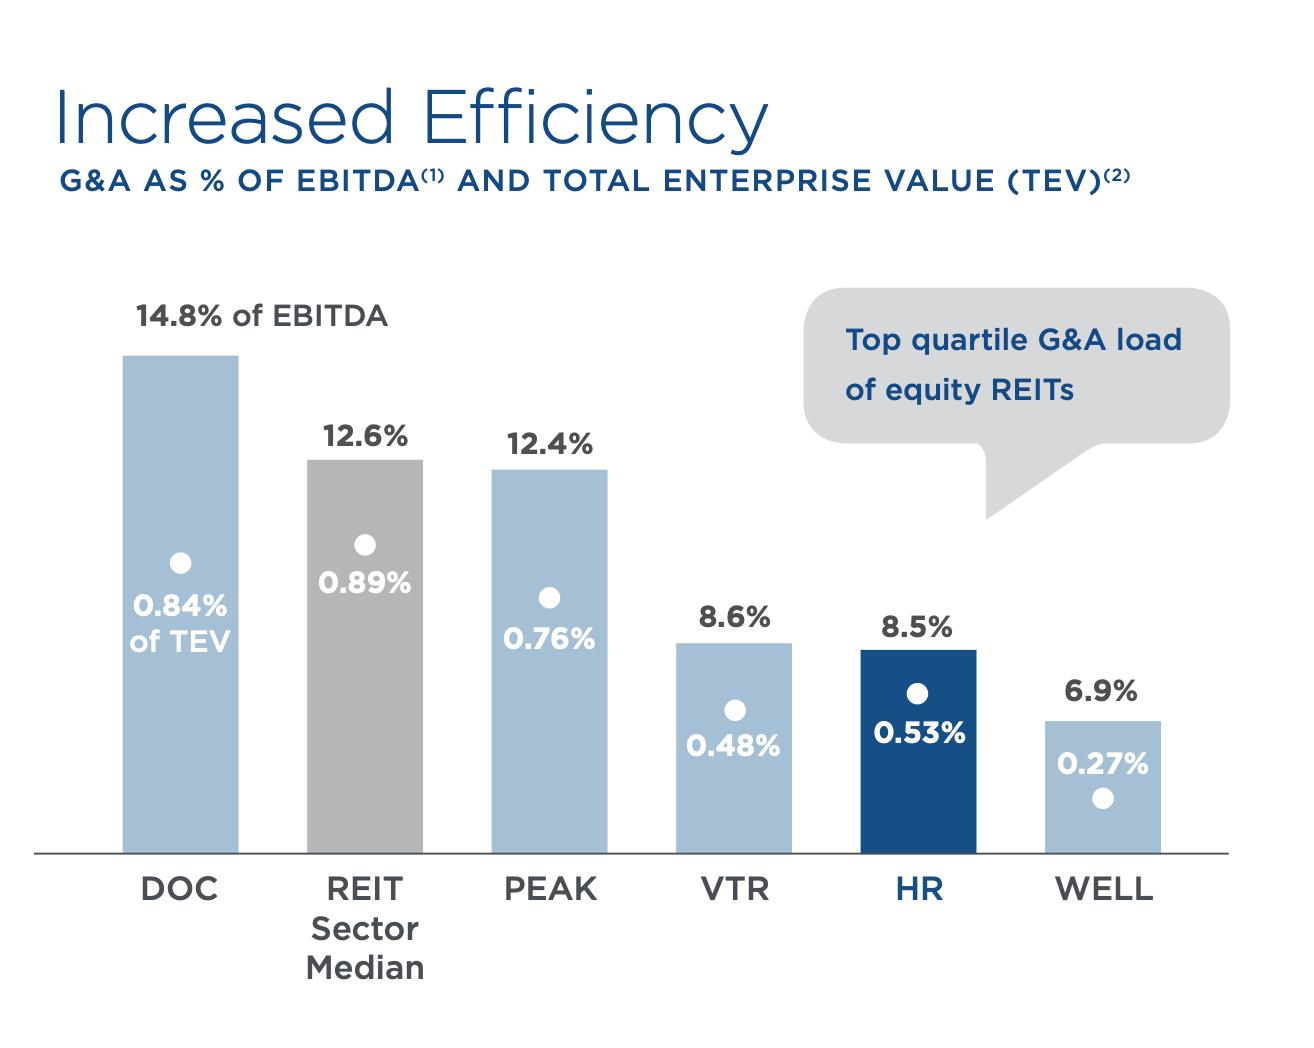
In addition, it can encourage the company-wide adoption of best-in-class business processes.
At the market level, scale provides a number of opportunities to improve operating and leasing efficiency. This might be reflected in more responsive local management, lower prices and better response for building operation services (e.g., maintenance or janitorial), more polished business processes.
The Investors Day event highlighted three elements of the leasing operation - "employees in the building, quick response to tenant requests, and "show ready" spaces to aid the leasing team." All leverage scale.
Operational excellence in turn should drive stronger relationships and preferred supplier status with larger tenants, and preferred customer status and higher priority from key brokers.
There are really no trade secrets here, but success demands years of sustained and systematic management attention to the details; plumbing problems get fixed today, the leasing process is fast and frictionless, etc. Scale helps because processing a lease every day rather than once a week makes it well understood and routine, and encourages management to address any pain points in the process.
Brokers and leasing efficiency provide an instructive example.
A post-merger scale efficiency comes from a 2-3x increase in the HR square feet per broker, with HR also focusing on a selected "best" broker in each market. HR is a thus a bigger and more important client, and the increased frequency of deals means the HR-broker workflows should be smoother and faster.
The Investor Day panel discussion with the brokers in the Raleigh market was interesting, and ran about 45 minutes. HR historically used brokers more than HTA, so post-merger a lot of formerly HTA properties are now being handled by brokers, giving them in many cases a much bigger playing field.
The brokers were (as one might expect in this venue) quite complimentary about HR, but the discussions specifically covered their perspective on four elements of the HR leasing process: responsiveness from HR, localization via an in-market Leasing Director, emphasis on renewals to maintain occupancy and reduce costs, and speed. They mentioned that a lease agreement with HR might go from initial tour to signed lease in 3 weeks, vs. 2-3 months with other landlords. As several people pointed out, "time kills deals".
One might think this sort of blocking and tackling would be obvious table stakes, but I can recall from my own experience leading software teams how difficult implementing and maintaining even basic process optimization can be. Management has to make it a priority and pay sustained attention.
The result should be higher occupancy.
Increased multi-tenant occupancy is the primary key to improved financial results; single tenant properties are essentially already fully occupied.
Multi-tenant properties constitute 83% of the portfolio in SF, and were 85.2% occupied at year end. Single tenant properties account for 17%, and were 98.3% occupied. Overall portfolio occupancy was 87.5%.
Multi-tenant properties are shorter, with a weighted average lease term of 96 months, compared to 137 months for single tenant properties. The remaining average lease terms are 49 and 63 months respectively at year end, i.e., it will take about five more years for post-merger processes to be applied to the bulk of the portfolio.
The majority of leases, 3,700 of 7,200 are under 2,500 SF, and on average the smaller the size of the lease, the shorter the lease term.
Quarterly tenant retention in 2023 ranged from 74% to 79%, with 78% in Q4. Retention of 80% is probably a realistic goal.
About 190 leases, comprising 400,000 SF, are on a month-to-month basis.
For multi-tenant, the percent leased is about 2% higher than the percent occupied; but for single tenant there is no gap. There is a delay between lease and occupancy; it varies from a few weeks to a year, but is about 6 months on average.
Very back of the envelope, in 2023 with 87.5% occupancy HR converted $1,344 million of revenue into $602 million adjusted FFO and $441 million to FAD. Conversion rates were 45% and 33% respectively.
All else equal, if multi-tenant occupancy could be increased from 85.2% to 90%, and single tenant occupancy was unchanged, total portfolio occupancy would be 91.4%. Assuming constant conversion rates, this 390 basis point increase in total portfolio occupancy would add 91.4/87.5 or 4.5% to revenue, FFO, and FAD. That would increase FAD by $20 million. We should see a bit better than that, since many costs would not change.
The most optimistic estimate is that 100% of the additional revenue, $60.5 million, drops down to FAD, increasing FAD by 14%.
That's consistent to what HR's Investor Day presentation stated:
Increasing multi-tenant occupancy to 90% generates incremental cash flow of $59M annually.
However, this effort faces at least two significant headwinds. Some tenants prefer being closer to the patient's home than the hospital, and MOBS are to a degree fungible with standard office buildings and even not office buildings. The result is that the potential renter has an ever present and usually cheaper alternative to investment grade on or near campus properties.
I thought about this point this morning, driving by a building in one of HR's top markets. It was a stand alone Bed, Bath, and Beyond a year ago, and is now a medical office. It's a "close to the patient" property.
Most investors buy REITs largely for the dividend, and the amount, growth, and safety of the dividend is their most important assessment criteria. It often illuminates broader issues. It's worth looking in some detail here.
In 2023 the dividend was 108% of the funds available for distribution "FAD" that HR generated. It is expected to exceed FAD in 2024, probably by a similar amount, and probably in 2025, if to a lesser degree.
Seeking Alpha provides dividend grades for all five of the REITs in the MOB space; the dividend safety for HR at D- is the worst of the five.
MOB REIT Dividend Grades (Seeking Alpha)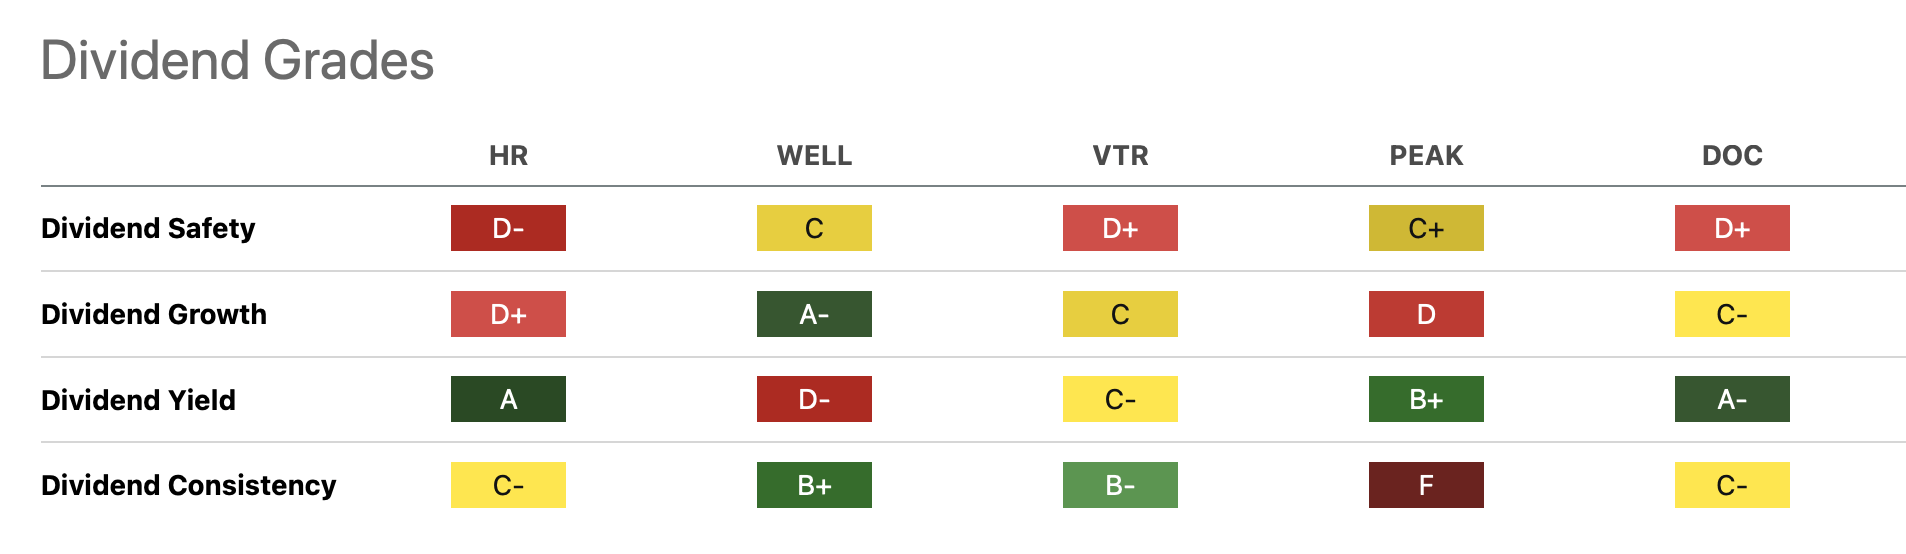
The dividend was discussed in the recent earnings call, and I think it illustrates both the dividend problem and more generally the waning patience of analysts. The exchange (edited for brevity):
CFO James Douglas said in the prepared remarks:
The FAD payout ratio was over 100% for the year. With the anticipated strong absorption in 2024, the payout ratio is likely to remain elevated as we invest in tenant build-outs. We are comfortable the payout ratio will come back down as we fully realize the NOI from the positive absorption.
The first analyst question on the call pushed back a little.
Maybe I can go back to your comments on the dividend first. I think if you look at guidance for both normalized FFO and CapEx, it implies about 107% payout ratio for 2024. I know the guidance has been elevated for some time and you talked about maybe being able to grow into a healthier payout ratio. But at some point, could a potential cut be warranted?
CEO Todd Meredith appeared sanguine.
We expect a similar payout ratio in '24 as '23, kind of in that 107-110% range. And we're comfortable with that because we're investing the capital that will generate the NOI that will flow through to FFO and FAD. We really see '25 as an important transition in that. So we're very bullish on what we see.
Certainly, we're not thinking about a cut. The board is not thinking about that at this point. Our view is, operationally, we can deliver the NOI that will improve that ratio.
The analyst tried again.
A follow-up on that. What kind of payout ratio are you comfortable with? How long would you have to keep that as is until you would grow into the cash flows?
Todd Meredith elaborates a little.
I think our view is that, again, 2024 looks a lot like '23 in terms of the payout ratio, but we think '25 starts to drive towards that covered dividend level. What we would like long term obviously is to drive much lower than that to the 90% or even below 90% level. So that's certainly the path that we see.
A second analyst asked about the growth trajectory that covering the dividend in 2025 implied.
The implication here is that if you move towards dividend coverage in 2025, 6% to 8% FAD growth in '25 is what would be implied. Is the way to think about how '24 plays out is that the run rate by the end of the year is going to [mean] mid or even upper single digits FAD growth in the out years?
Todd Meredith again:
You're right in terms of what the implied dividend coverage would suggest in terms of the growth potential in '25. So we're certainly bullish on that and see a very strong uptick going into '25.
Back of the envelope, assuming a ~5% FAD growth rate, it will take about 2 years for FAD to catch up to the current dividend, and another 3 years to reach an 85% payout rate, at which point (2029) a dividend increase might, in my view, be considered. An argument might be made that a more conservative 70% of FAD distribution rate policy would be more prudent in the long term.
Adopting a sustainable payout rate of about 85% of FAD today suggests a 19% cut to $0.25 per quarter, which would generate a yield of 6.7% at a $15 stock price. This would also would free up $92 million a year for debt repayment or stock buybacks (about 1.5% of outstanding shares a year at that $15 price).
HR can certainly borrow the ~ $40 million to cover the gap between FAD and the distribution in 2024, and say another $20 million in 2025. But should they?
The Supplemental has a complete list of debt as of 31 Dec 2023, and a summary schedule of debt maturing through the end of decade. There is also a summary of debt covenants and liquidity, which indicates little to no current risk of bumping up against covenants. The $1.5 billion credit facility maturing October 2027 is notably completely undrawn. There is very little mortgage burden.
The debt will have to be rolled over, HR is not generating enough cash to materially pay off the debt, even if they cuts dividend to zero. However, they have some time to deal with it; the 2025 debt matures in mid-year. Only 7.6% of the debt is floating rate.
Debt Schedule (HR Q4 2023 Supplemental)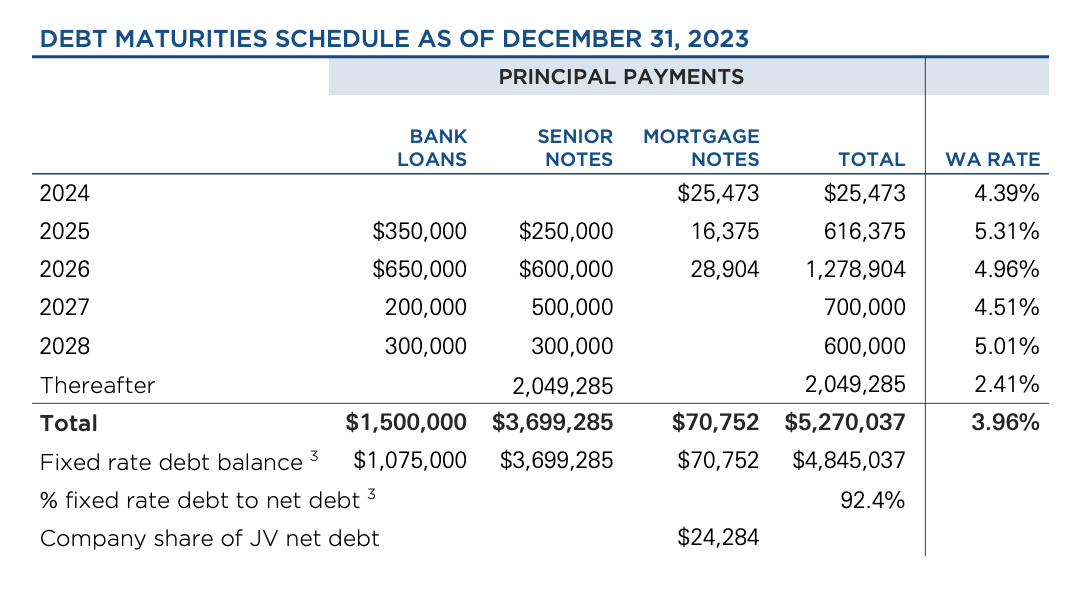
All of the $1.5 billion in term loans fall due between mid-2025 and January 2028, and currently run SOFR + 1.05%.
$1.65 billion (47%) of the $3.5 billion in Senior Notes, fall due by January 2028. The remainder in 2030-2031.
HR has stated a 6.0-6.5x target range for net debt to EBITDA, and was at 6.4x at year end. By comparison, PEAK expects a post-merger debt in the low 5x's.
One might view the debt as sustainable, if higher than desirable. It's currently a constraint on growth, and a risk, rather than a crisis.
Wall Street (12 analysts) have price targets from $15-$20, with an average of $17.55.
Price Target for HR (Seeking Alpha)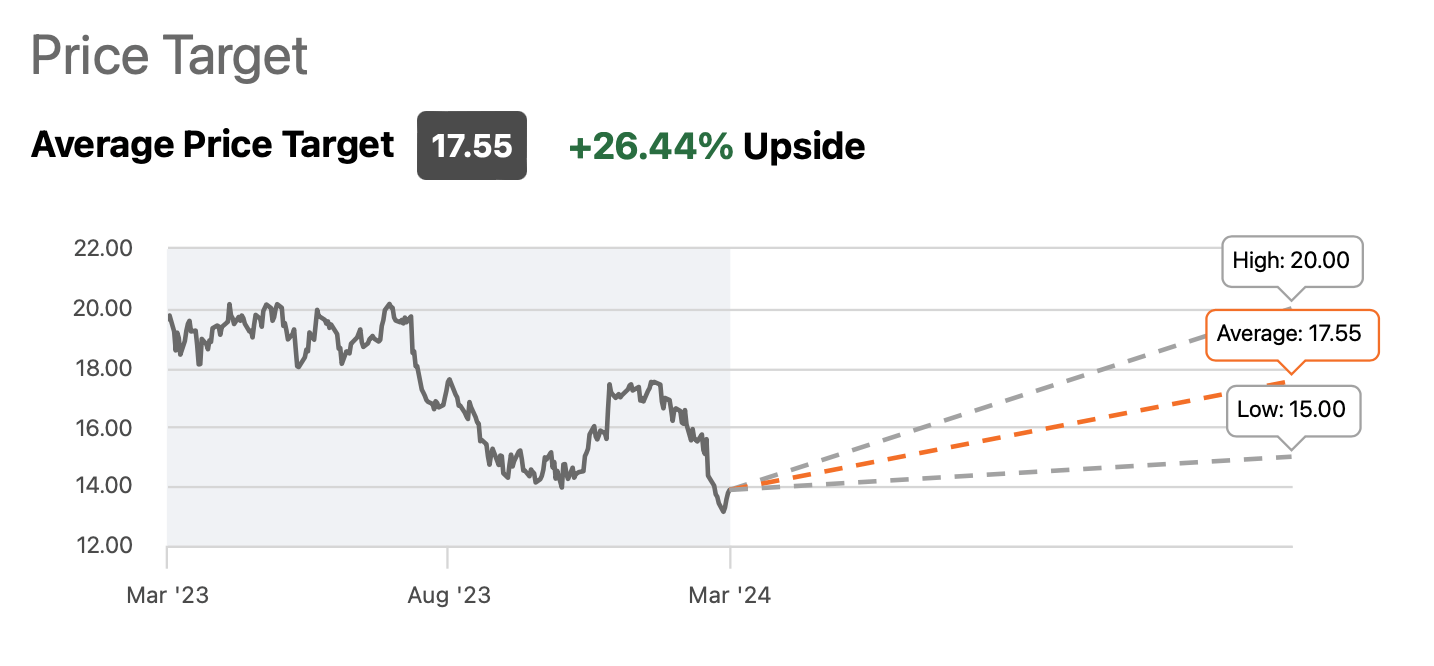
Based on Forward Price/FFO, HR appears inexpensive vs. peers. Seeking Alpha reports Forward Price/FFO as HR 8.9, Peak 9.6, DOC 10.9, VTR 14.0, WLL 23.0.
Buy and sell ratings indicate a lack of consensus. The Quant Rating slipped from Hold to Sell in mid-February, coincident with the release of the Q4 results. The Quant Factors analysis rates Profitability, Moment, and Revisions all as D-.
HR Buy / Hold / Sell Ratings (Seeking Alpha)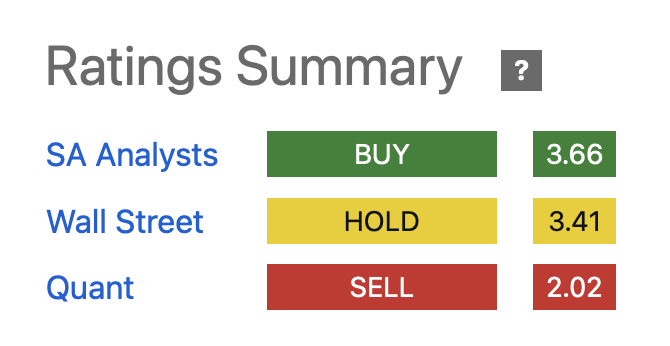
Seeking Alpha reported two analyst downgrades after the earnings all, citing Q4 performance, guidance, and dividend coverage.
Todd Meredith, the CEO of HR, made an interesting observation at Investor's Day. Over the long term, HR expects rents to reflect property replacement cost. As leases roll over, the comp will be the rent rate to justify development or redevelopment to create marginal capacity.
In the Q4 Earnings Call, he put some numbers behind this.
Construction costs have escalated at an annual average of more than 7% over the last 5 years. Couple this with much higher financing costs and you have a recipe for much higher replacement rents.
Back in 2019, typical MOB development costs were about $350 a square foot in a place like Dallas. Required yields were in the low 6s, putting net rents around $22 per square foot. Five years later, equivalent MOB development costs are approaching $500 a square foot, and rent yields are now around 8%. That means replacement rents are approaching $40.
So replacement rents have increased more than 80% in 5 years or more than 12% annually. This limits new supply and sets us up to improve occupancy and rates in existing buildings.
This will take years to play out as leases expire and are renewed, but it offers some support that the long term of the real estate may not be reflected in current estimates.
There are several notable risks to this investment thesis.
1. The current dividend appears at risk, and may not be sustainable.
The dividend is critical to long term total return. Maintaining the current dividend may compromise other financial and operational goals, but cutting it undercuts the "MOBs are safe and reliable" message.
2. HR may never achieve the scale at the market and sub-market level required to make a material difference to company financial results.
While their arguments seem reasonable, and they have some data to support the effect, they still have limited market share in many markets. Further growth in scale may be very slow.
3. Over the long term, the highly competitive MOB business may provide small or even negative real returns.
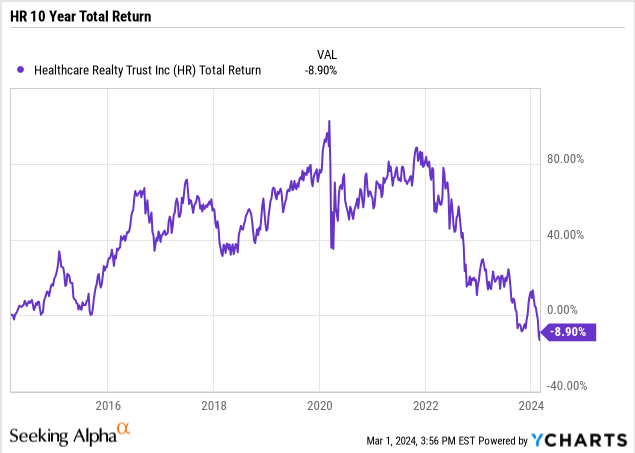
Rent growth has been running at or below inflation in recent years, including in 2023. Total Return (chart below) is negative for the last 10 years, although it had reached ~ 85% in late 2021.
Inflation, as measured by CPI, is up 32% over the last 10 years.
In particular, "higher for longer" interest rates may be a challenge.
HR's strategy is to leverage scale to increase efficiency at the corporate, market, and sub-market level. Coupled with outstanding property operations and business processes, they believe this will drive increased occupancy, and eventually better lease terms. Increased construction costs should eventually be reflected in increased rents, as well as support the value of their current assets.
The merger of PEAK and DOC appears to copy, and hence validate, HR's strategy. It will create a competitor REIT with an equivalent 40 million square foot MOB footprint, and with a very similar emphasis - prime buildings on or near a hospital campus, excellent business processes, great relationships with major tenants.
The benefits from HR's July 2022 acquisition of HTA are being realized, but more slowly than many expected. It may take another 2 years to see the full impact.
Management projects FFO will be essentially flat in 2024, but appears comfortable with suggestions that 6-8% growth in 2025 is consistent with their expectations.
I'd like to see them do two things: (1) consolidate their assets into a 20 market footprint to maximize the scale effect, and (2) bite the bullet and reduce their dividend to 85% of FAD. I doubt they will do either.
The best case for investors might be merge HR into the combined PEAK + DOC; scale indeed. I view that as unlikely, and at least two years away in any event.
The current stock prices appears to reflect a considerable amount of disillusionment with Healthcare Realty Trust Incorporated's performance. Long term investors may view this as a good entry point, and I'd rate the stock a buy on the Seeking Alpha scale.
Personally, I own full position acquired in several tranches with an average cost of $20.10, including 15% added at $13.62 on 22 February while preparing this article.