
PM Images
PM Images
Written by Nick Ackerman, co-produced by Stanford Chemist.
John Hancock Tax-Advantaged Dividend Income Fund (NYSE:HTD) provides investors exposure to a diversified portfolio of utility and fixed-income/preferred securities. Thanks to a reader in our main Investing Group chat, HTD is once again back in my portfolio after a swap back from the John Hancock Premium Dividend Fund (PDT).
With lower interest rates expected in the next year or two, this fund could be set to perform much better going forward. Utilities and fixed-income are two attractive areas in the market today as higher rates beat them down, HTD can further provide a great entry with its attractive discount.
HTD's objective is to "provide a high level of after-tax total return from dividend income and capital appreciation." They highlight that the fund can be used for "tax-sensitive equity income." After all, even folks in retirement looking for fixed income should have some exposure to equities as well to maintain some diversification.
Their approach to investing is "typically investing at least 80% of assets in dividend-paying securities." With that, they will "typically emphasize preferred and common securities in the high dividend-paying utility sector."
The fund carries a rather elevated amount of leverage that can add to the risk of the fund. However, the argument would likely be that the fund holds primarily utility and fixed-income exposure, two historically defensive areas to invest in. Unfortunately, those are some of the specific assets that don't do well in a higher interest rate environment, meaning that argument wouldn't have really had merit in the last few years.
When including those interest expenses, the fund's total expense ratio comes to 4.25%. That was up significantly and is similar to what most other leveraged CEFs are having to deal with. That said, this is also one of the fund sponsors that hedged their borrowing costs through financial derivatives.
Last year, I swapped my HTD position to PDT, and then the swap started to play out, as highlighted in our previous update. I ultimately decided not to make the swap back at that time, but the divergence between the two became even larger more recently. The opportunity to exploit the valuations here was all thanks to PDT cutting its distribution. Distribution cuts aren't always negative but can often provide a chance to exploit the discount/premium mechanic in CEFs.
These are two funds that are particularly great as being a swap pair. This is thanks to their overlapping portfolios, given the rather similar approach of both of these funds. Over the last decade, we can see just how closely the total NAV returns are for these two funds.
YCharts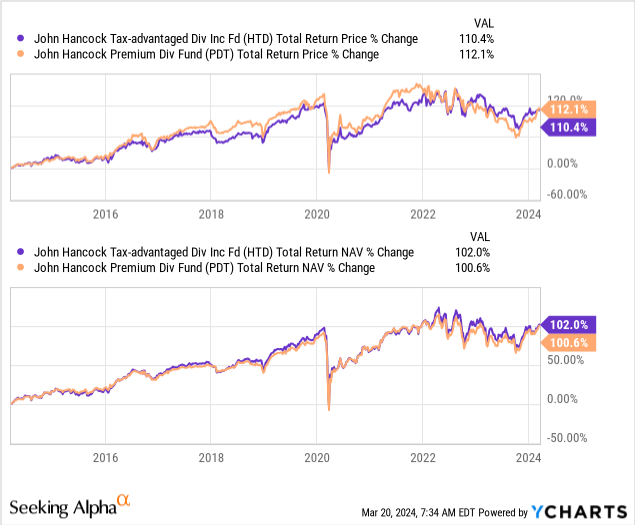
That being said, one of the negatives between these two is that it seemed PDT was always able to trade at a narrower discount relative to HTD. In fact, PDT has been able to average a premium over the last decade relative to HTD's ~6% discount level. So, when these discounts flipped on an absolute basis, and PDT was trading at a deeper discount, that really was a unique event. It highlighted a stronger opportunity than usual.
YCharts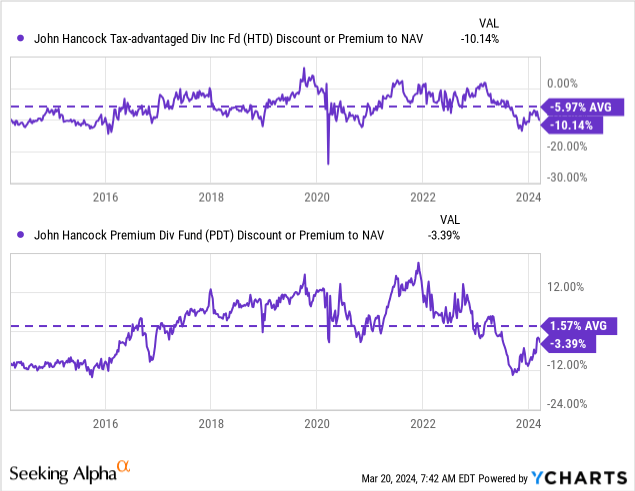
Of course, since it came from a distribution cut, it doesn't always mean that the fund's valuation will come roaring back so quickly. In this case, I was a bit surprised at how quickly the trade went back into my favor.
With that being said, we can see that PDT is still technically trading at a relatively attractive discount compared to its own historical average. HTD is similarly trading at a relatively attractive discount but does take the edge thanks to a larger absolute discount. The swap opportunity here is still available.
Admittedly, though, the day I made my swap was on March 15. PDT closed that day at a discount of just under ~2%, and HTD was at a discount of -10.29%. The spread being a touch wider then made the percentage differential a bit more appealing.
August 24, 2023, was the exact day I made the move from HTD to PDT. PDT announced its distribution cut at the end of June. The reaction to the fund's announcement wasn't actually as immediate as it usually is, so it took a bit of time before it became a tempting opportunity. That said, it definitely paid off.
YCharts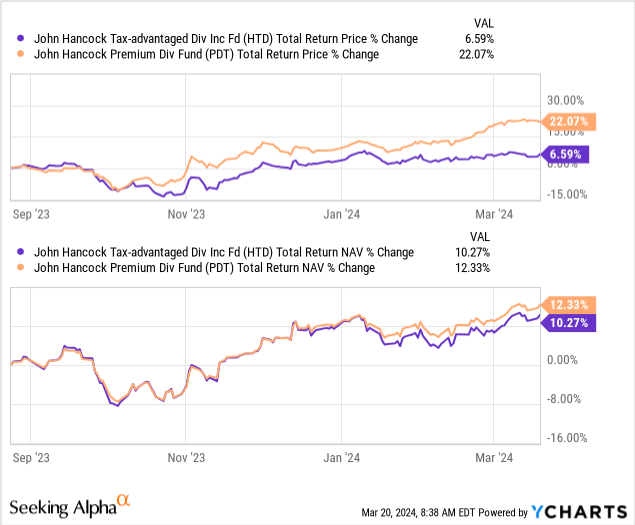
PDT was able to outperform a bit on a total NAV return basis, and that also helped. However, it was ultimately the discount divergence between the two that delivered that 3.35x total share price return.
YCharts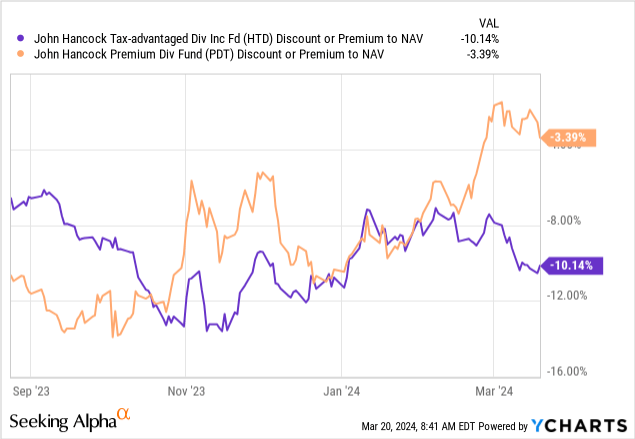
At the end of the day, HTD's discount has appeal here, and I believe it's ultimately the better buy at this time.
One of the appealing factors of HTD is the steady distribution the fund has been able to deliver. They cut once during the Global Financial Crisis. Since then, they've maintained or raised the regular monthly distribution. They actually raised the payout four different times, but since around 2016, it has been the same "boring" $0.138 every month, hitting investors' accounts.
HTD Distribution History (CEFConnect)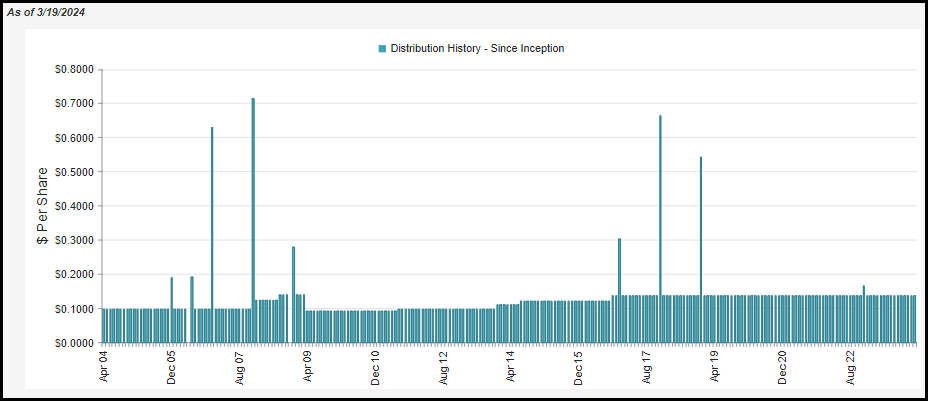
That's one of the consistencies that investors can often pay up for, but for whatever reason, they choose not to for HTD. It is also where a bit of my shock came from when PDT's discount narrowed so much in a relatively short period of time after a distribution cut.
What might be even better for HTD is that its distribution looks relatively safe here. At an NAV rate of 7.74%, I don't see the payout being cut. HTD had to deal with the same higher borrowing costs on their leverage that PDT did, but PDT was at a higher NAV rate to begin with.
Today, that remains the case, with PDT's NAV rate coming in at 8.18%. If they were planning to cut, it would make more sense to cut PDT's again as well - which I don't think they are looking to do. Of course, that is always a risk, though, as CEFs tend to pay out level distributions until they decide to change it. Predicting when that happens is always a difficult question.
One way we see those higher leverage costs reflected is in the fund's net investment income. As mentioned, HTD saw its borrowing costs rise just the same as PDT's; interest expense in their last annual report came to $23.413 million versus last year's $7.897 million.
HTD Annual Report (John Hancock)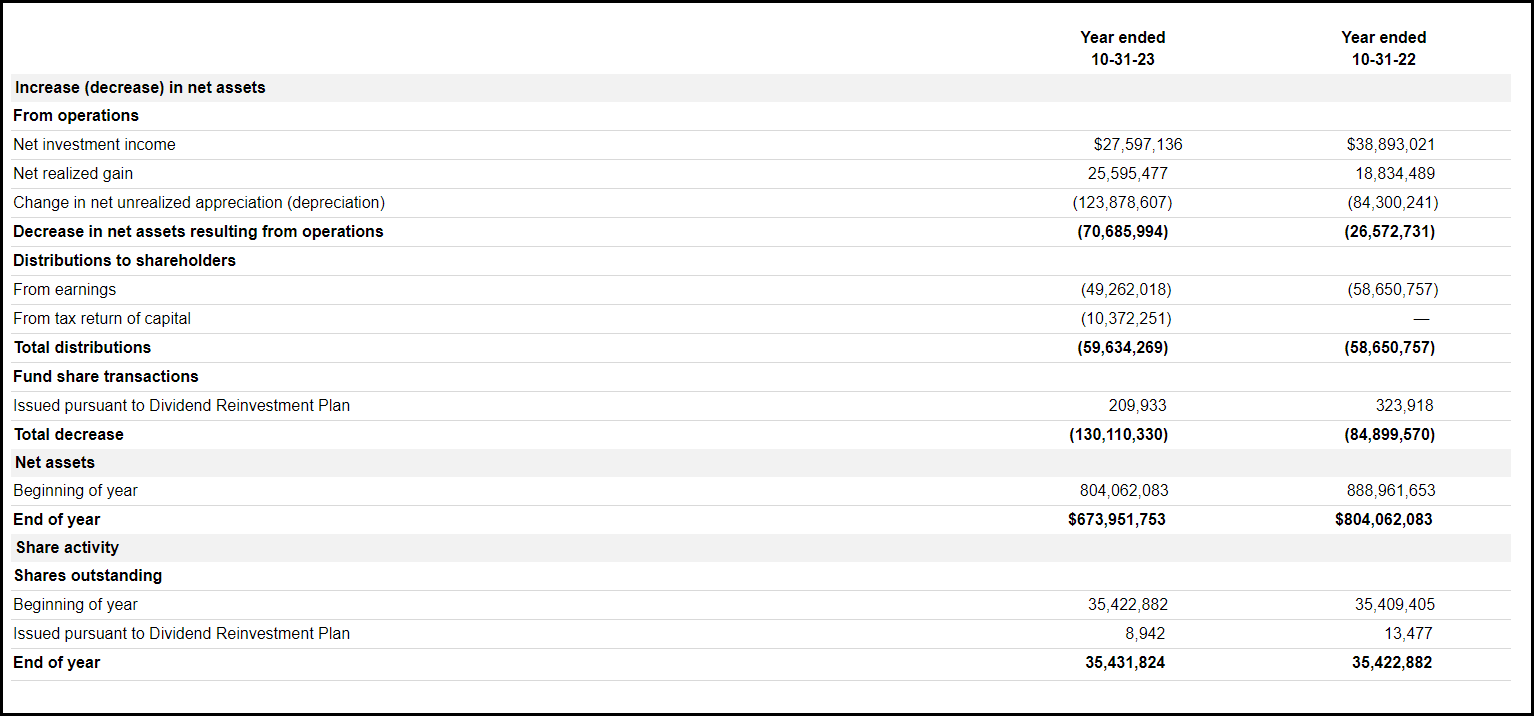
So, seeing NII decline year-over-year is not a shock. That was even the case despite total investment income climbing from $56.867 million to $60.395 million. That helped to offset some of those higher interest rate costs, but ultimately, it wasn't enough. In this case, NII coverage comes to around 46.2%.
Another area that helped offset the higher costs of borrowings was the fund's interest rate hedging. This was done through futures contracts and interest rate swap contracts. Those helped to provide a bit more in the capital gains bucket to help offset those declines in NII as well.
At the end of the last fiscal year, they noted that they had no future contracts outstanding at the time. On the other hand, they still had a notional $314.5 million in interest rate swaps with a maturity of May 2026. The fund's borrowings stood at $418.9 million at the time, meaning a majority was still hedged.
HTD Unrealized/Realized Gains/Losses (John Hancock)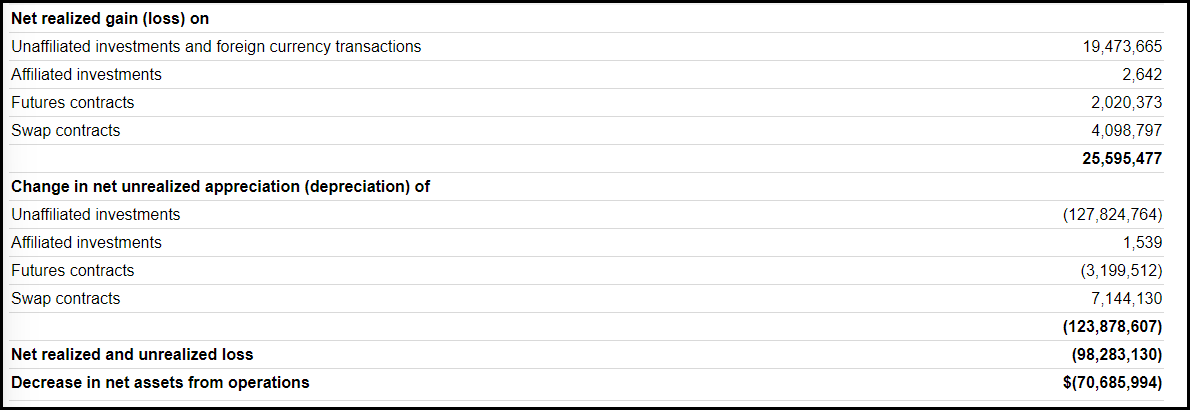
Like most funds with a sizeable equity component, HTD will rely on capital gains to fund its distribution. When it doesn't realize enough gains to pay out the distribution or earn enough NII, it will use return of capital distributions.
HTD Distribution Tax Classification (John Hancock)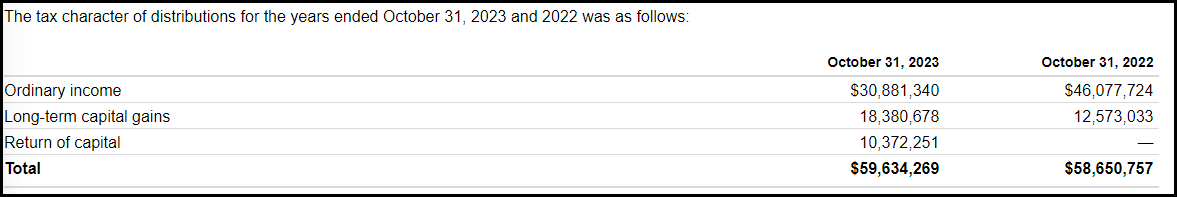
In this case, we saw the NAV decline in 2023, meaning that this ROC would have been considered destructive ROC. That isn't necessarily a bad thing to get the fund through a year or two while still maintaining the distribution. However, it is not something we want to see over multiple years.
It's no secret that the utility sector and fixed-income/preferred securities got hit in a higher-rate environment. This is precisely how HTD is invested as well.
HTD Portfolio Breakdown (John Hancock)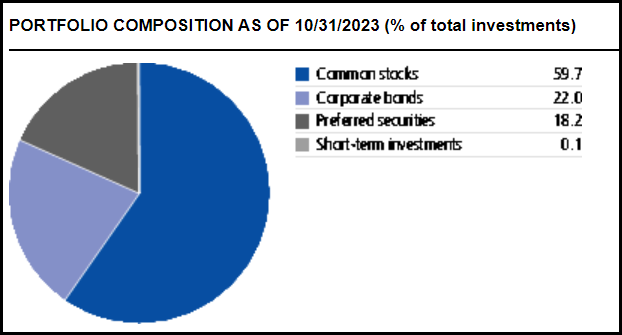
In the fixed-income corporate bond sleeve, they are invested primarily in investment-grade. The area that is most interest rate sensitive.
YCharts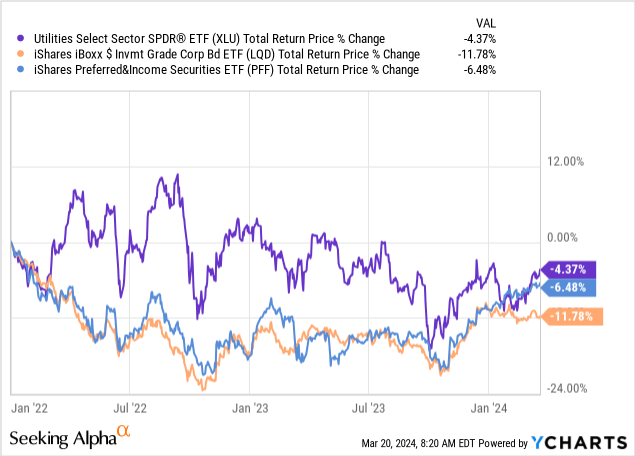
That's both the good news and the bad news. It has meant basically negative returns since the start of 2022 to date. If you have already been heavily exposed to these areas, you are likely seeing these significant losses in your holdings.
On the other hand, with interest rates expected to be at their peak and the next move for rate cuts, this is the area of the market that could do better going forward. I think that is the good news.
Hotter-than-expected inflation has kind of thrown a wrench into what the market was originally anticipating. It is still highly expected that we will get rate cuts later in 2024, but we may need to be patient if the data doesn't cooperate. If inflation doesn't return to its downward trajectory, there may be no cuts until 2025 as the U.S. economy and labor market have remained incredibly resilient.
Looking back at HTD more specifically, we can see that the fund's largest exposure is to the utility sector. However, that's also followed by financials. That may seem a bit unusual, but it's actually because the fixed-income component of the fund is primarily allocated to the financial sector. As we can see in the graph below, this has been the case for years in this fund as well.
HTD Sector Weighting (John Hancock)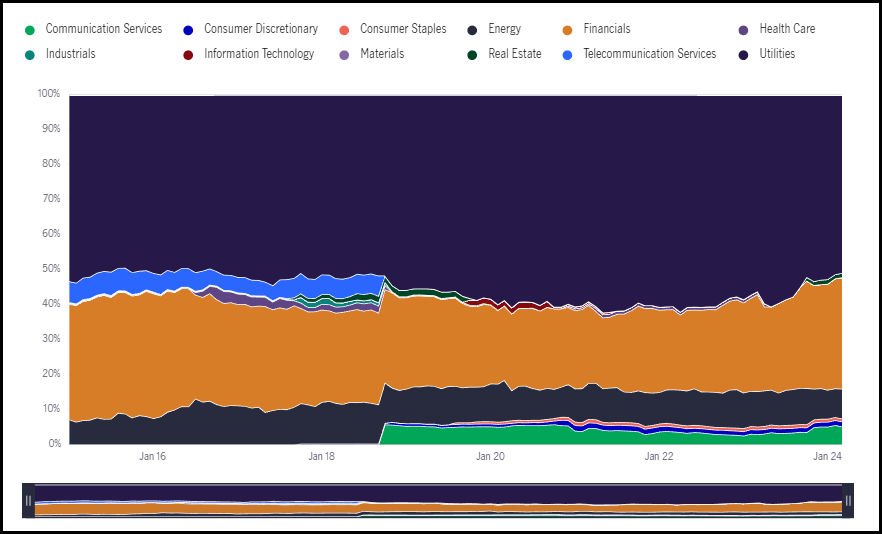
Looking more specifically at the fund's top ten, we can see a heavy representation of the utility space. That also includes Verizon (VZ) and AT&T (T), which are telecoms that are basically utility-like and close enough to utilities in my book. Like utilities, VZ and T should do better in a lower rate environment.
HTD Top Ten Holdings (John Hancock)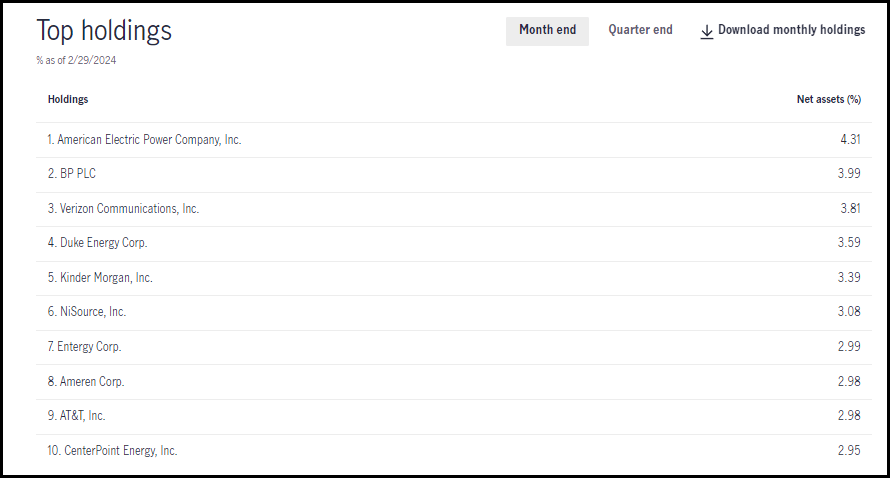
VZ and T are new names in the fund's top ten, as they weren't listed a year ago when we reviewed the top ten. If we rewind to that period and take a look at the N-PORT for their 1/31/2023 holdings, we can see that VZ was a position in the fund. It's just now a much larger position as the fund more than doubled its holdings to this name; it took the share count up to 704,432 from 309,160.
HTD is trading at an attractive discount on an absolute and relative basis. The swap trade between HTD and PDT worked out quite well, but actually, both are relatively attractive. I'll choose HTD with a discount that's also relatively attractive to its own history while sporting the larger absolute discount. The main reason is that, if history repeats, we are getting virtually identical performance between the two.
PDT cut its distribution last year, and HTD did not, which makes me fairly confident that HTD will not be looking to reduce its distribution. While there can never be a guarantee, I believe they would have already if they planned to. At this point, I suspect they are content in waiting for the lower rates that are expected. If data doesn't cooperate, inflation starts heading higher, and we need rate hikes, then I would have to start questioning the safety. At this point, that doesn't seem like the likely path.