
goncharovaia
goncharovaia
Global X U.S. Infrastructure Development ETF (BATS:PAVE) warrants a buy rating due to its track record of performance compared to peer infrastructure ETFs and its current blend of holdings with strong potential. Additionally, government investment in infrastructure development posture PAVE for solid returns looking forward. While the fund has a relatively high expense ratio and low divided yield, it is fairly valued compared to peers.
PAVE is an ETF that seeks to capture the performance of the Indxx U.S. Infrastructure Development Index. The fund therefore invests in companies involved in the production of raw materials, equipment, engineering, and construction for U.S. infrastructure activity. With its inception in 2017, the fund has 99 holdings and $6.0B in AUM. Due to its focus on infrastructure, PAVE’s sector weight is heaviest on industrials (72.6%), followed by materials (21.6%) and utilities (2.8%).
For comparison purposes, other infrastructure ETFs examined are iShares U.S. Infrastructure ETF (IFRA), SPDR S&P Global Infrastructure ETF (GII), and FlexShares STOXX Global Broad Infrastructure Index Fund ETF (NFRA). IFRA generally seeks to track U.S. companies that have infrastructure exposure and benefit from an increase in infrastructure activities. IFRA’s greatest sector weight is on utilities (38.44%), and it is more diversified than PAVE with 152 holdings. GII seeks the returns of the S&P Global Infrastructure Index. It includes the 75 largest publicly listed infrastructure-related stocks as holdings. NFRA seeks to track the performance of the STOXX Global Broad Infrastructure Index. Therefore, NFRA is similar to GII in that it includes international holdings.
PAVE has an inception back in 2017. Therefore, a five-year time period was used for the longest time range for comparison with peer ETFs. PAVE has a 5-year compound annual growth rate, or CAGR, of 21.40%. Therefore, its performance is superior to all other ETFs examined. By comparison, IFRA has a 5-year CAGR of 14.10%, GII has a 5-year CAGR of 6.64%, and NFRA has a 5-year CAGR of 6.75%.
5-Year Total Price Return: PAVE and Compared Infrastructure ETFs (Seeking Alpha)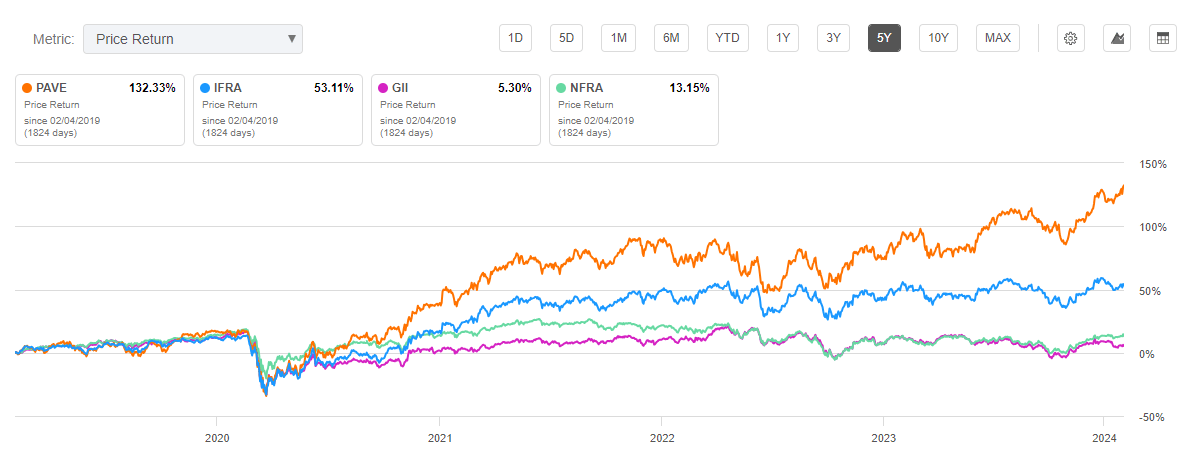
One downside for PAVE is its relatively high expense ratio. The fund ties NFRA for the highest expense ratio at 0.47% compared to other top infrastructure ETFs. PAVE also has a comparatively low dividend yield at just 0.67%. While this is the lowest yield compared to peers, PAVE has the greatest 5-year dividend CAGR. GII and NFRA, the ETFs that contain international holdings, have the highest dividend yields at 3.80% and 2.55%, respectively. However, the capital appreciation achieved through their price return is significantly lower than PAVE and IFRA.
Expense Ratio, AUM, and Dividend Yield Comparison
PAVE | IFRA | GII | NFRA | |
Expense Ratio | 0.47% | 0.30% | 0.40% | 0.47% |
AUM | $6.0B | $2.19B | $386.08M | $2.24B |
Dividend Yield TTM | 0.67% | 1.46% | 3.80% | 2.55% |
Dividend Growth 5 YR CAGR | 17.56% | -0.01% | 5.80% | 0.55% |
Source: Seeking Alpha, 3 Feb 24
Because each infrastructure ETF examined has different objectives and tracked indexes, the holdings for each fund have distinct differences. The top 10 holdings for PAVE represent over 30% weight for the fund. Additionally, PAVE has 99 holdings, an average amount of diversification compared to peer infrastructure ETFs.
Top 10 Holdings for PAVE and others
PAVE – 99 holdings | IFRA – 152 holdings | GII – 77 holdings | NFRA – 207 holdings |
URI – 3.27% | VST – 0.82% | ANYYY – 5.67% | CP – 4.16% |
ETN – 3.21% | NVRI – 0.82% | TRAUF – 5.02% | CNR – 3.91% |
TT – 3.16% | CENX – 0.79% | ENB – 4.66% | CMCSA – 3.10% |
PH – 3.14% | NSC – 0.78% | NEE – 4.36% | VZ – 3.03% |
NUE – 3.08% | NRG – 0.77% | AUKNY – 3.23% | DTE.DE – 2.86% |
CSX – 3.02% | WOR – 0.76% | SO – 3.23% | ENB – 2.63% |
NSC – 3.00% | X – 0.76% | DUK – 3.16% | UNP – 2.60% |
MLM – 3.00% | URI – 0.76% | IBE.MC – 2.97% | DHL.DE – 2.44% |
UNP – 2.95% | BLDR – 0.76% | G9N.DE – 2.91% | IBE.MC – 2.43% |
FAST – 2.94% | CSX – 0.75% | GET.PA – 2.65% | 9432.T – 2.37% |
Source: Multiple, compiled by author on 3 Feb 24
All ETF investors know that a fund’s future performance is tied to the returns of its individual holdings. The holdings of United Rentals, Inc. (URI), Eaton Corporation (ETN), and Parker-Hannifin Corporation (PH) all represent distinct advantages for PAVE in comparison to its peer infrastructure ETFs. The unique strength of each holding is discussed in further detail below.
The first difference setting PAVE above its peers is United Rentals, Inc. This company in the industrial sector rents construction equipment and tools. PAVE has the greatest weight on URI of the infrastructure ETFs examined at 3.27% weight. Despite a one-year price return of 43.4%, URI still has a P/E ratio 20% below its sector median. Additionally, the company has seen a 23.1% YoY revenue growth and an impressive 73.1% YoY levered FCF growth. Beyond its impressive growth, United Rentals is highly profitable. The company boasts a 41.4% gross profit margin and a 16.91% net profit margin, almost 180% higher than its sector median. United Rentals saw record revenue in Q4 at $3.2B and is postured for strong momentum looking forward. Therefore, URI represents the first distinct advantage in holdings for PAVE compared to other infrastructure ETFs.
The second example of a strong holding is Ireland-based Eaton Corporation. This international power management company has demonstrated an 11.8% YoY revenue growth and 20.8% YoY EBITDA growth. The company is also very profitable with a 36% gross profit margin and 13.9% net income margin. ETN also offers a 1.30% dividend yield that appears very safe with a 39% payout ratio. ETN’s Q4 release was very strong beating both top and bottom-line estimates. By providing electric power distribution to both the American and international market, Eaton is well postured to take advantage of renewable energy growth. Therefore, ETN is the second strong holding advantage for PAVE.
The third difference is Parker-Hannifin Corporation. Parker-Hannifin sells motion and control technologies worldwide and has seen an impressive one-year price return of 51.2%. Despite nearing its all-time high price of $510.36, the company does not appear overvalued and is demonstrating strength to go even higher. With a YoY EBITDA growth of 41.46% and an 83.2% YoY ROE, the company is primed for expansion in both its diversified industrial segment and aerospace systems segments. Additionally, it is another profitable holding with a 36.1% gross profit margin and 25% EBITDA margin. At 3.14% weight, PAVE is the only ETF examined with PH as a holding. Therefore, Parker-Hannifin represents the third distinct advantage for PAVE.
PAVE is currently trading at $35.36 at the time of writing this article and is near the upper limit of its 52-week range of $26.38 to $35.54. PAVE’s all-time intraday high of $35.54 was seen recently on February 2nd. Consistent with its long-term performance, PAVE’s returns over the past six months and one-year time periods have also been superior to peers.
6-Month Price Return: PAVE and Peer Infrastructure ETFs (Seeking Alpha)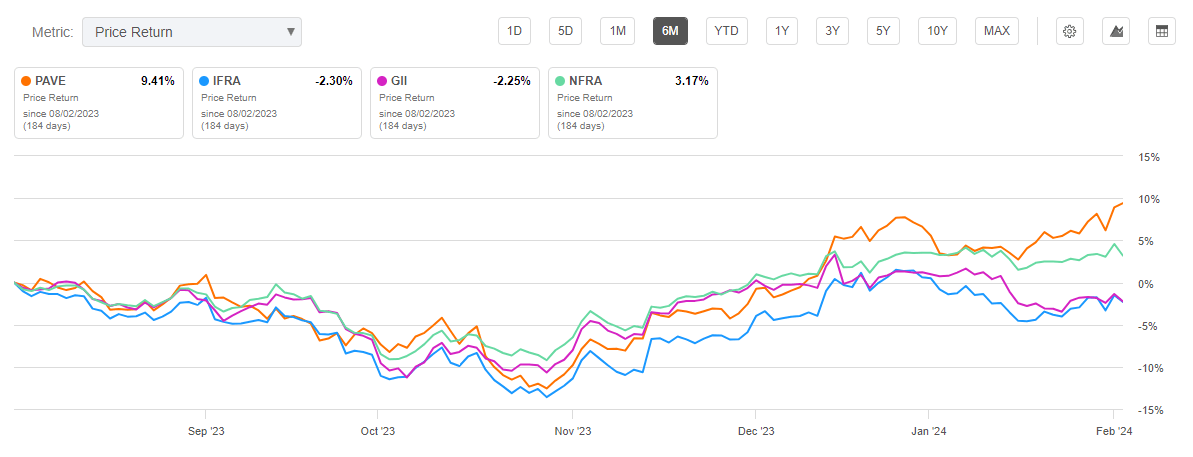
Despite its price return being significantly higher than its peers recently, PAVE is still valued roughly on par with the average of its competitors. With a price-to-earnings ratio of 18.53, PAVE’s P/E ratio is only slightly higher than the average of the other three infrastructure ETFs. PAVE does have a price-to-book ratio higher than its peers at 2.82. Notwithstanding these valuation metrics, I believe PAVE will still outperform its infrastructure ETF competitors given its strong holdings mix previously discussed.
Valuation Metrics for PAVE and Peer Competitors
PAVE | IFRA | GII | NFRA | |
P/E ratio | 18.53 | 14.86 | 15.08 | 23.15 |
P/B ratio | 2.82 | 1.84 | 1.87 | 3.35 |
Source: Compiled by Author from Multiple Sources, 3 Feb 24
Although infrastructure companies are generally stable investments, the ETFs examined in this article have volatility greater than “the market” overall. This volatility can be measured by looking at each fund’s beta value. A beta value greater than 1.0 indicates that the investment is more volatile than the index it is measured against. PAVE has a 3-year beta value of 1.26 compared to the S&P 500 Index, indicating that it has greater volatility than the index. By comparison, IFRA has a 3-year beta value of 1.03.
PAVE is an infrastructure ETF that has outperformed top peer infrastructure ETFs including IFRA, GII, and NFRA. This outperformance will likely continue considering its top holdings of URI, ETN, and PH. These top holdings have unique strengths including their growth and profitability to take advantage of infrastructure development. Downsides for PAVE are its relatively high expense ratio and low dividend yield compared to peer ETFs. Aside from these downsides, PAVE is likely to see continued capital appreciation and therefore warrants a buy rating for investors.