Halliburton: We Are Drilling Down For The Winners In Energy (Technical Analysis)
Summary
We take a more in-depth look at the fundamentals of Halliburton with Lyn Alden.
Lyn recommends companies with long-lived reserves, such as this pick.
Halliburton is well positioned to benefit from this current upswing in the energy sector, and potentially outperform its peers.
Pla2na/iStock via Getty Images
By Levi at Elliott Wave Trader; Produced with Avi Gilburt
After such a torrid run up from the major low that was seen in the Fall of 2020, it was time for the entire Energy sector to rest. And, rest it did. Many names simply consolidated over time, others pulled back deeper via price. But, as a whole, we are now quite positive on the sector. However, there can be some names that are more favorite than others. Take a look with us at Halliburton (NYSE:HAL). We’ll delve into the fundamentals with Lyn Alden. Then, Zac Mannes and Garrett Patten will help interpret the structure of price via the charts.
Lyn Alden Dives Into The Fundamentals
“Overall, the energy sector continues to be an uncrowded and under-owned space by most investors, and pays good dividends to those who hang around for the ride. Energy prices don’t need to blow out for these companies to produce attractive total returns from these levels. My preference is toward companies with long-lived reserves.
The two main risks to that thesis as we look out for the rest of the decade are either 1) lower than expected global demand or 2) higher than expected global output. I expect gradual demand increases and supply increases with risks of supply disruptions here and there, but overall for energy prices to push upward in large part because the denominator (currency) is falling.
So, one way to protect the thesis is to own companies that benefit from greater production. I view higher than expected supply as a more likely risk than major demand destruction, and so that’s the side I prefer to have more protection on.
In my recent deep dive report, I emphasized Halliburton as another way to play the energy sector in addition to the producers. As the world’s marginal new oil production becomes increasingly unconventional, it becomes increasingly necessary to use advanced technologies and to find and eliminate every possible inefficiency in the process, and that’s where companies like Halliburton serve a function.
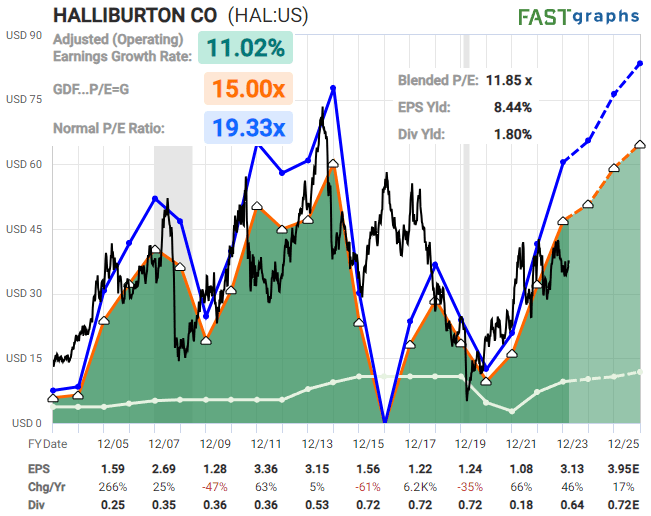
Fundamentally, HAL is inexpensive and analysts expect ongoing earnings growth for this cycle:
Chart by Lyn Alden - FastGraphs
*F.A.S.T. Graphs 101*
*Black line: the current and historical stock price
*Blue line: what the stock price would be if were at its historically average price/cash-flow ratio
*Orange line: a conservative measure of valuation (a 15x price/cash-flow in this case)
*White line: dividends paid that year (and the payout ratio is relative to the orange line)
*Dark/light green: the transition between historical earnings numbers and consensus analysts’ forecast earnings numbers
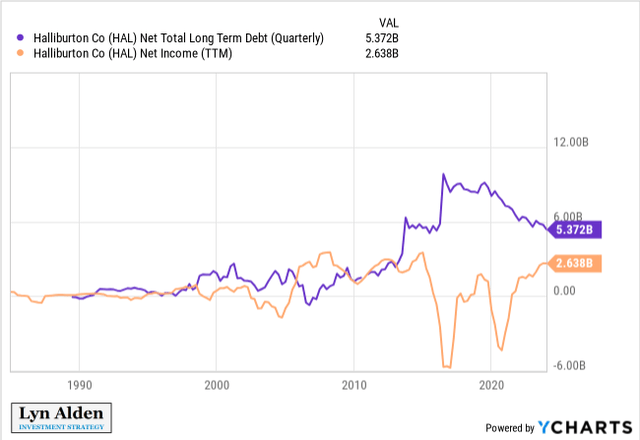
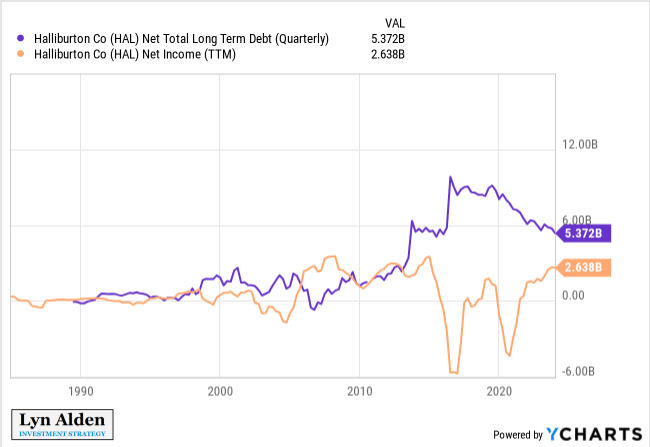
The company has been reducing its net debt, and has termed out its debt rather well:
Chart by Lyn Alden - YCharts
I’m bullish on HAL and would be willing to accumulate on dips. As long as it keeps making higher highs and higher lowers, it looks rather constructive on the technical chart. If at some point it breaks down through recent lows, then it’s worth re-assessing the thesis.” - Lyn Alden
The Structure Of Price Speaks Via The Charts
Our lead analysts, Zac Mannes and Garrett Patten, scour over literally hundreds of charts a day. When a sector is found that may be readying itself for an imminent turn either up or down they will then drill down into specific names that may outperform other names in that same sector. Please see the charts below and note the potential overhead targets for HAL as well as the levels where it would invalidate this scenario.
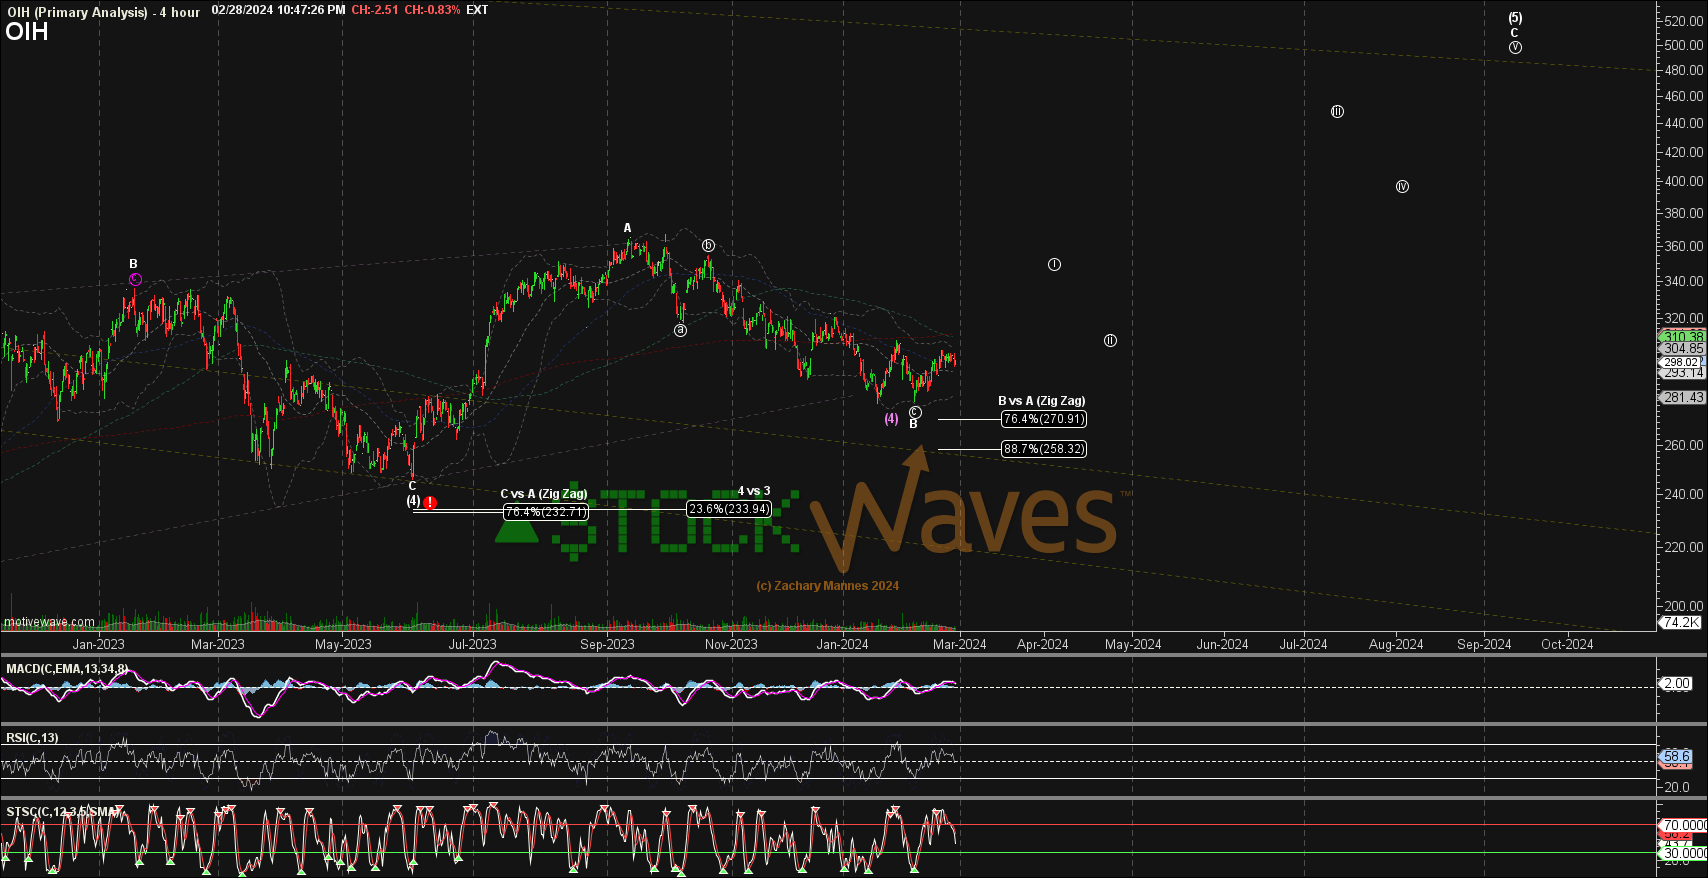
First, please note the (OIH) chart, Now, keep in mind that this is from a few weeks back when we once again began to beat the drum in favor of the Energy sector.
Chart by Zac Mannes - StockWaves - Elliott Wave Trader
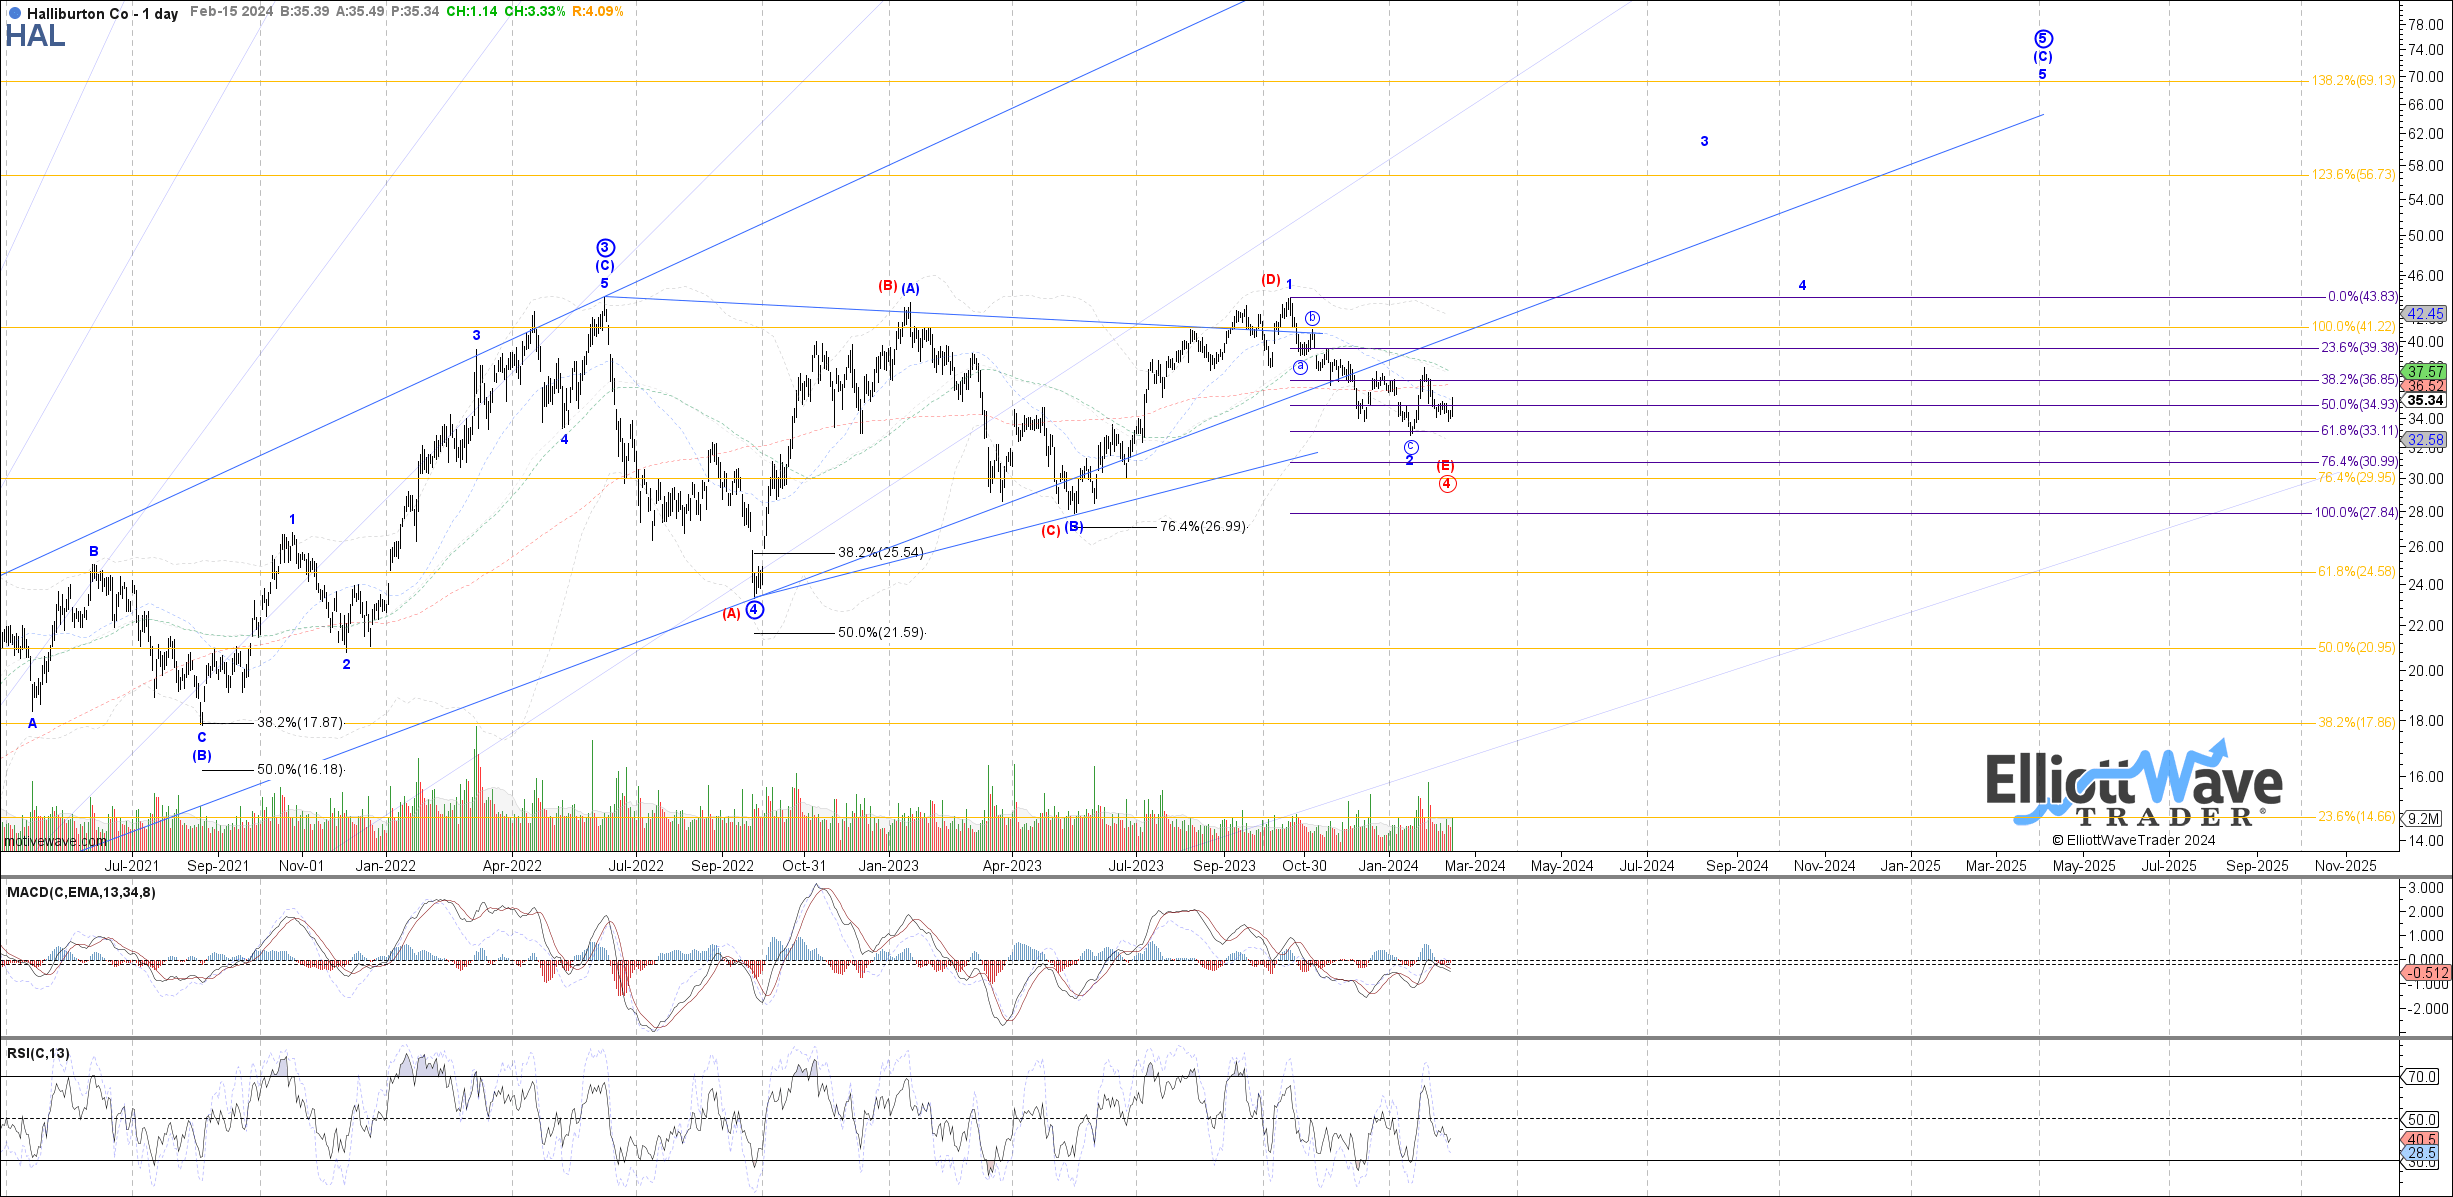
HAL is in this specific ETF with a decent amount of exposure. But, what are the specific levels to watch on the HAL chart and what is the possible target level overhead? Let’s take a look at Garrett’s daily chart:
Chart by Garrett Patten - StockWaves - Elliott Wave Trader
Very quickly, one can easily glean that for as long as the last low at $33 or higher holds then price can reach up for the $70 target zone, obviously over time. Here’s the near term view from Zac:
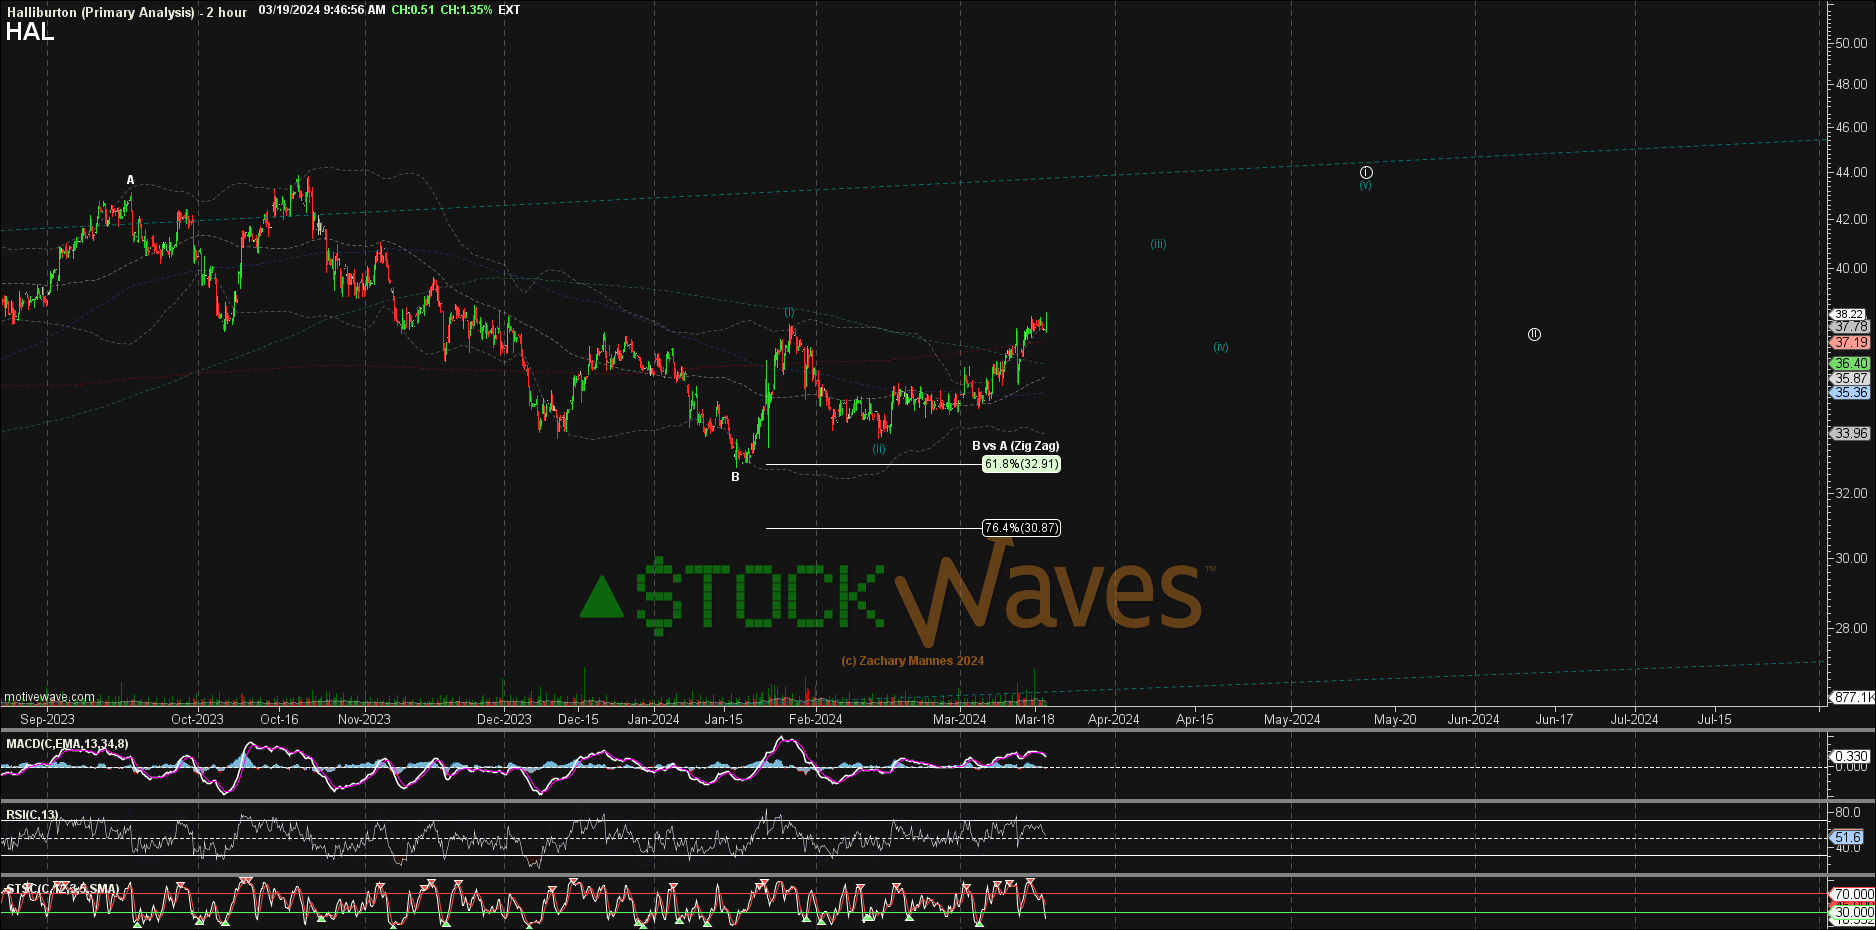
Chart by Zac Mannes - StockWaves - Elliott Wave Trader
The interim target is at about the $45 level. Thereafter, price will likely consolidate and pull back as illustrated here. Risk can be defined by that low shown at the $33 level. Should price move back under that then we would reconsider our near term bullish projection.
“This All Just Seems So Subjective . . .”
Quite frankly, this can be found true. When you have seen other ‘expert’ practitioners of Elliott Wave Theory that craft a count to match their bias, it certainly can be the case. So, how can we remove as much subjectivity as possible from the use of this tool? Avi Gilburt had that same question as he began a deep study of the methodology. Included below is a brief excerpt of an article from our Education section that shares the key.
“While I was learning Elliott Wave on my own, I was trying to obtain a more ‘track-able’ and ‘tradable’ understanding of the fractal nature of the markets. This is probably what many struggle with the most. Specifically, it is when we say that within a 5 wave move, each impulsive wave breaks down further into 5 waves each, with some waves becoming extended.
Well, after much analysis and observation, I identified a standardized method to trade waves 3-5, once waves 1 and 2 were in place. Now, remember that this is a standardized method that is a most common phenomenon in the market, but markets can and do vary from this standardized presentation. In fact, when we deal with commodities or the VXX, often, we see extensions that far surpass the standardized extensions I present here. But, again, this scenario is seen very often in the markets and individual stocks, so I believe it is worthwhile to have a basic understanding of this structure to build upon.
This is something that I observed within the Elliott Wave structure, and have adapted it to a trading methodology, which I lovingly call Fibonacci Pinball.” - Avi Gilburt
Do You Have A System In Place?
Those who have experience forged by time in the markets will tell you that it's imperative to have a system of sorts in place. You need to be able to define how much you are willing to risk vs. how much gain is likely. Those who survive across the decades in the greatest game on earth will also inform you that the preservation of capital is paramount.
While there are multiple manners of doing this, we have found Fibonacci Pinball to be a tool of immense utility for traders and investors alike. It is this system, or methodology, that is pointing higher for Halliburton in the near term. The $70 price target can be achieved. However, in the meantime, we will be vigilant in our monitoring of its progress.
Conclusion
There are many ways to analyze and track stocks and the market they form. Some are more consistent than others. For us, this method has proved the most reliable and keeps us on the right side of the trade much more often than not. Nothing is perfect in this world, but for those looking to open their eyes to a new universe of trading and investing, why not consider studying this further? It may just be one of the most illuminating projects you undertake.