PhonlamaiPhoto
PhonlamaiPhoto
Nova (NASDAQ:NVMI), a supplier of metrology and process control tools for the semiconductor market, has paused in recent days, but that does not take away from the fact that NVMI has doubled in value in about four months, and by even more if one goes back further in time. However, while the rally is undoubtedly impressive with a YTD gain of 32.5%, some may be asking if there is too much froth in the air. Why, will be covered next.
A previous article from late September 2023 rated NVMI a hold after concluding that the stock, which was retreating at the time, was due for a bounce. The article reasoned that a bounce was possible with the stock close to a previous support level. In addition, the article noted how the overall trend favored higher stock prices. With all the above, an argument could be made that if someone was looking for an entry point to get in on NVMI, now was that time.
Source: Thinkorswim app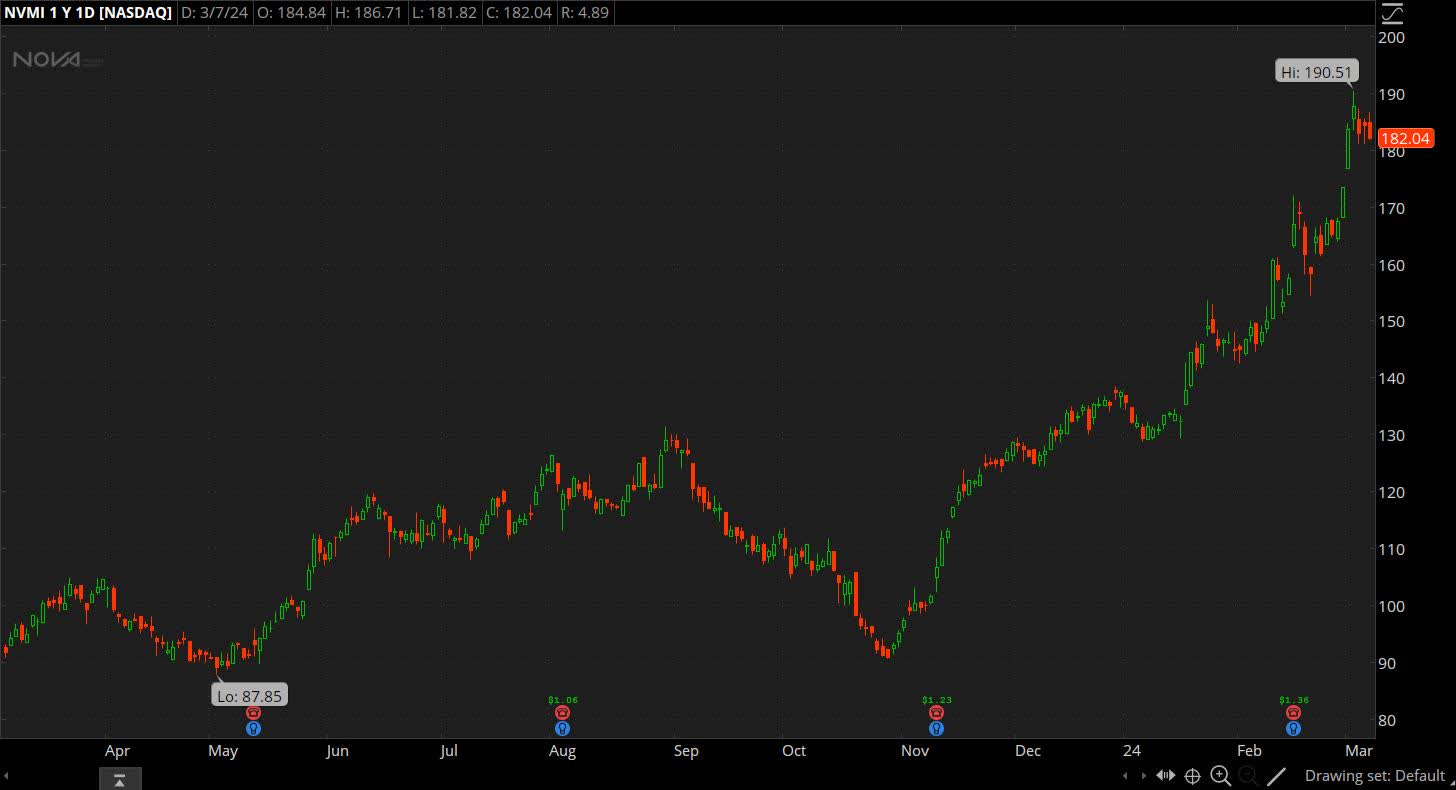
The chart above shows how the stock dipped some more in October after the outbreak of violence in Israel pushed NVMI lower, with Israel home to NVMI. However, NVMI then went on a powerful rally that took the stock to an all-time high of $190.61 on March 4, 2024, breaking the old record of $149.15 in January 2022, roughly four months after the stock hit a low of $90.59 on October 27, 2023.
This represents a gain of 110.4%. Gains are even higher going back further in time. There was an interruption in late summer/early fall last year, but NVMI has essentially been on the move higher since bottoming in October 2022 at $67.40. While impressive, an argument can be made the rally is long in the tooth. Anyone buying could be doing so at what might turn out to be the top.
The stock price has doubled in four months, but that by itself may not be enough to get people to wonder if things are perhaps getting frothy. It's therefore worth mentioning that the stock has soared higher even though NVMI has seen demand for semiconductor manufacturing equipment, metrology included, take a dip. The stock has rallied, but revenue, for example, declined YoY in each of the four quarters in the recently concluded FY2023.
FY2023 revenue declined by 9.3% YoY to $517.9M and non-GAAP EPS declined by 4.1% YoY to $4.86. In terms of GAAP, NVMI earned $136.3M, or $4.28 a share. Note how operating income fell more than net income, which is mostly because of the increase in non-operating income, primarily higher interest income due to higher interest rates.
Financing income was $22.4M in FY2023, up from just $8.5M in FY2022. This increase of 164.6% YoY helped boost EPS by negating to a certain degree the decline in operating income. NVMI finished FY2023 with cash, cash equivalents, and short-term bank deposits of $227.4M, partially offset by senior notes totaling $197.7M. In addition, NVMI has $407.6M of marketable securities on the balance sheet. The table below shows how the numbers decreased in FY2023.
(Unit: $1000, except for EPS) | |||
(GAAP) | FY2023 | FY2022 | YoY |
Revenue | 517,922 | 570,729 | (9.25%) |
Gross margin | 57% | 56% | 100bps |
Operating margin | 26% | 26% | - |
Operating income | 132,263 | 149,931 | (11.78%) |
Net income | 136,310 | 140,213 | (2.78%) |
EPS | 4.28 | 4.43 | (3.39%) |
(Non-GAAP) | |||
Revenue | 517,922 | 570,729 | (9.25%) |
Gross margin | 59% | 58% | 100bps |
Operating margin | 30% | 31% | (100bps) |
Operating income | 156,406 | 178,578 | (12.42%) |
Net income | 155,891 | 161,509 | (3.48%) |
EPS | 4.86 | 5.07 | (4.14%) |
Source: Nova FY2023 annual report
On the other hand, it's worth noting that the numbers improved sequentially for two consecutive quarters after what might have been the bottom in Q2 FY2023. In Q4, revenue was $134.2M, down 11.3% YoY, but up 4.2% QoQ. NVMI earned a record $1.20 in terms of GAAP and $1.36 in terms of non-GAAP, up QoQ and YoY. Keep in mind, financing income reached $7.28M, up from $2.16M a year ago. If not for this 237.6% YoY gain in non-operating income, EPS would have shrunk instead of jumping to record highs. The table below shows how NVMI ended FY2023 on a high note.
(Unit: $1000, except for EPS) | |||||
(GAAP) | Q4 FY2023 | Q3 FY2023 | Q4 FY2022 | QoQ | YoY |
Revenue | 134,219 | 128,808 | 151,238 | 4.20% | (11.25%) |
Gross margin | 55% | 56% | 54% | (100bps) | 100bps |
Operating margin | 25% | 27% | 24% | (200bps) | 100bps |
Operating income | 33,662 | 34,148 | 36,924 | (1.42%) | (8.83%) |
Net income | 38,068 | 33,689 | 36,098 | 13.00% | 5.46% |
EPS | 1.20 | 1.06 | 1.15 | 13.21% | 4.35% |
(Non-GAAP) | |||||
Revenue | 134,219 | 128,808 | 151,238 | 4.20% | (11.25%) |
Gross margin | 57% | 58% | 56% | (100bps) | 100bps |
Operating margin | 30% | 31% | 28% | (100bps) | 200bps |
Operating income | 40,777 | 40,196 | 42,016 | 1.45% | (2.95%) |
Net income | 43,597 | 39,405 | 40,778 | 10.64% | 6.91% |
EPS | 1.36 | 1.23 | 1.28 | 10.57% | 6.25% |
Source: Nova Q4 FY2023 report
Guidance calls for Q1 FY2024 revenue of $134-140M, an increase of 3.6% YoY at the midpoint, which would be the first YoY increase since Q4 FY2022. The forecast calls for GAAP EPS of $1.00-1.12, a decrease of 2.8% YoY at the midpoint, and non-GAAP EPS of $1.21-1.33, an increase of 3.3% YoY at the midpoint.
Q1 FY2024 (guidance) | Q1 FY2023 | YoY (midpoint) | |
Revenue | $134-140M | $132.2M | 3.63% |
GAAP EPS | $1.00-1.12 | $1.09 | (2.75%) |
Non-GAAP EPS | $1.21-1.33 | $1.23 | 3.25% |
Source: Nova Q4 FY2023 report
Guidance did not extend beyond Q1, but NVMI did add some color as to how it sees FY2024 play out. NVMI expects to outperform the wafer fab equipment or WFE market, which is expected to grow in the mid-single digits in 2024. From the Q4 earnings call:
So, it's a bit early to say, but we've seen a low, I would say, a mid-single-digit WFE growth in 2024. Naturally, we are planning to outperform these figures, but that changes, and I think, that it's very difficult to say whether it's going to be a lower number or around that number, but the bottomline is that we are very confident about our plan and we have the ability to outperform the WFE in that respect.
Source: Nova earnings call
With these guidelines from NVMI, FY2024 revenue is estimated to grow by 12% YoY to $580M, or roughly twice as fast as the WFE market. Such a top line is estimated to result in non-GAAP EPS of around $5.40. Keep in mind, there are several factors that could affect the actual number, including the slope of interest rates. The stock closed at $182.04 on March 7, which translates to a forward non-GAAP P/E ratio of 33.7x for NVMI with EPS of $5.40.
This is not only above the average P/E of 25.8x in the last five years for NVMI, but also above the sector median at 25.1x. For example, the top player in the metrology market, KLA Corp. (KLAC), which can be regarded as NVMI's top competitor, trades at about 25 times forward earnings. On a trailing basis, NVMI has a non-GAAP P/E ratio of 37.5x, with TTM EPS of $4.86. Other multiples are similarly on the high side. For instance, NVMI has a book value of $750.75M with total assets of $1,133.8M and total liabilities of $383.1M.
This translates to a book value of $25.88 per share with 29.01M shares outstanding. NVMI is thus valued at over 7 times book value with a stock price of $182.04, double what the average stock in the sector goes for at 3.15x. It's fair to say that multiples for NVMI are very much elevated. This does not necessarily mean NVMI is frothy, but it is heading in that direction if the stock keeps going almost vertically like it has recently. NVMI is certainly not on sale or a bargain.
NVMI is estimated to grow the top and the bottom line by about 12% this year. This level of growth is based on the fundamental need for metrology, especially with semiconductors becoming increasingly complex. For instance, there is a move towards increasingly three-dimensional structures in advanced logic, high bandwidth memory and flash memory, all of which increase the need for tighter process control.
The stock rally is based in part on this premise of a greater need for products from NVMI. Furthermore, while the downturn has caused the quarterly numbers to drop, they are expected to return to growth and the market is positioning the stock for this expected growth. Still, if there is a possibility of something disrupting the projected growth for NVMI, then it is mostly likely to be due to China.
Sales by geographic region in percentage | FY2023 | FY2022 | FY2021 |
China | 36 | 28 | 21 |
Taiwan | 18 | 32 | 37 |
USA | 13 | 16 | 23 |
Korea | 20 | 13 | 11 |
Other | 13 | 11 | 8 |
$517.9M | $570.7M | $416.1M |
Source: Nova FY2023 annual report
The table above shows how China has taken an increasingly larger proportion of sales at NVMI. China's revenue grew from $87.4M in FY2021 and $159.8M in FY2022 to $186.4M in FY2023, giving China a share of 21%, 28%, and 36%, respectively. China's revenue grew by $99M from FY2021 to FY2023, which is almost as much as the total increase of $101.8M during these years. In other words, much, if not all, of the sales growth in the last few years can be attributed to China.
NVMI has in the past stated it is confident China demand will remain strong, but such a heavy reliance on China demand is still something that is less than ideal, to put it mildly. It's also something that potential buyers need to take into account when deciding if they want to bet on a stock that has rallied for as long as it has in the last 18 months or so when that growth is so reliant on one customer. Growth that is more broad based is preferable, as that would give more confidence in its sustainability.
If one is a follower of trends or momentum, then there is a strong case to be made for long NVMI. The stock has not moved in a straight line, but long NVMI has been a winning bet for the last 18 months or so. In the last four years, NVMI has multiplied in value by 7-8 times after hitting a low of $25.70 in March 2020. So betting on NVMI has certainly been worth it in recent years.
However, while NVMI may not be in frothy territory, there is an argument to be made that NVMI has gotten ahead of itself after the rally, especially in the last 4/5 months. NVMI is growing, and it is likely to increase EPS in the low teens in FY2024, but the gains in the stock still look excessive in comparison. This shows up in, for instance, how NVMI is valued in terms of multiples. NVMI's primary competitor is valued less, despite the latter's dominance in the field.
In addition, much of the growth was driven by one country, China. This may not necessarily be a problem for NVMI, especially in the short term, but it is likely to be an issue that could cause some potential buyers to think twice about putting their money in NVMI. It is doubtful whether China's outsized role in driving growth can continue indefinitely. It is likely to end at some point in the future.
There are those who will decide to bet on long NVMI, and I have done so in the past, but I am neutral on NVMI for now. There are strong arguments to join in on the rally, but there are also legitimate reasons to stay away. Whether it is a rally long in the tooth, high valuations relative to most, or excessive reliance on one market, NVMI may just be a stock too hot to handle at this time.