
Kativ
Kativ
Co-produced by Austin Rogers.
Some of our readers have expressed an interest in real estate closed-end funds, or "CEFs," after seeing that they have sold off anywhere from 30% to over 50% since the beginning of 2022.
Real estate CEFs have underperformed the unleveraged exchange-traded fund ("ETF") that basically acts as the real estate investment trust, or REIT, standard (the Vanguard Real Estate Index Fund ETF Shares (VNQ)) to varying degrees.
Today, REIT CEFs are interesting for several reasons:
That last point may seem like a negative in today's relatively high interest rate environment. But consider two points.
First, like individual companies, CEFs debt is often a mix of fixed-rate and floating-rate debt. As such, their borrowing costs do not rise all at once. As long as the weighted average interest rate on debt remains lower than the yield on investments (including capital gains), the use of leverage produces positive returns. But if the weighted average interest rate on debt rises above the yield on investments, then it becomes dilutive and erodes NAV.
Second, if we are at or near the peak in interest rates for this rising rates cycle, then the leverage in REIT CEFs could propel them to enjoy significant outperformance as interest rates begin to decline.
With that said, let's compare and contrast the various real estate CEFs on the market to see if we can identify any that are particularly attractive right now.
There are at least 8 real estate CEFs on the market, each doing something similar but with variations.
| Net Expense Ratio | AUM | Premium / (Discount) to NAV | Leverage | |
| abrdn Global Premier Property (AWP) | 1.19% | $307m | (8.91%) | 19.2% |
| CBRE Global RE Income (IGR) | 1.39% | $792m | (9.54%) | 32.3% |
| Nuveen Real Estate Income (JRS) | 1.33% | $247m | (12.50%) | 29.8% |
Neuberger Berman RE Income Securities Income (NRO) | 1.29% | $164m | (3.50%) | 29.9% |
Principal Real Estate Inc (PGZ) | 2.26% | $68m | (11.38%) | 36.1% |
Cohen & Steers Total Return Realty (RFI) | 0.96% | $304m | 3.48 | 0% |
Cohen & Steers REIT & Pref Income (RNP) | 1.10% | $965m | 0% | 34.0% |
Cohen & Steers Quality Income Realty (RQI) | 1.34% | $1.66b | (5.26%) | 33.8% |
You'll notice that AWP and IGR both have "global" in their titles. Unlike their other real estate CEF peers, these two CEFs' portfolios are diversified across both U.S. and international holdings. For AWP, 38% of its holdings are not based in the US, while 34% of IGR's holdings are based outside the US.
AWP has relatively low assets under management ("AUM"), but it also has the lowest discount to net asset value ("NAV") in its leveraged CEF peer group, probably because it also has the lowest amount of leverage.
IGR has the benefit of being sponsored by CBRE (CBRE), a premier commercial real estate services firm in the U.S. Its assets under management, or AUM, are over double that of AWP, but its discount to NAV is almost double as well, as the fund employs greater leverage. Also, unlike AWP, IGR holds a small, 6% allocation to REIT preferred stocks.
JRS is sponsored by asset management firm Nuveen, which is diversified across asset classes and does not particularly specialize in real estate. While 65% of the portfolio is invested in REITs, about 32% is allocated to preferred stocks.
NRO is offered by actively managed fund provider Neuberger Berman and has a small amount of AUM. Leverage is also fairly high at about 30%, leading to the larger discount to NAV. The portfolio is about 62% REITs (including some mortgage REITs) and 34% preferred stocks.
PGZ is the smallest CEF in this group by AUM, and rightly so in our opinion. It has the highest fees, highest leverage, and riskiest investment strategy. Its portfolio is made up of about 66% commercial mREITs, 21% US REITs, and 12% international REITs. Keep in mind the leverage used by PGZ is on top of high levels of leverage typically employed by commercial mREITs.
The final three CEFs are sponsored by Cohen & Steers (CNS), a company that specializes in public real estate securities.
RFI seeks to generate high total returns with virtually no use of debt. The portfolio is split between REITs at 79% and preferreds at 21%. Also, it offers the lowest fees in its real estate CEF peer group.
RNP has the highest leverage of the Cohen & Steers real estate funds, but it also has the highest allocation to preferred stocks (largely from banks but other sectors as well) at 51%. The other 49% is in REIT common stocks.
RQI appears to be almost identical to RFI in terms of its portfolio, made up of 79% REITs and 21% preferreds, with the notable exception that RQI is roughly 1/3rd leveraged. RQI is by far the largest fund in its peer group with nearly $1.5 billion in AUM.
Here's how the U.S.-focused real estate CEFs have performed on a total return basis against VNQ (dark green line) over the last decade:
YCHARTS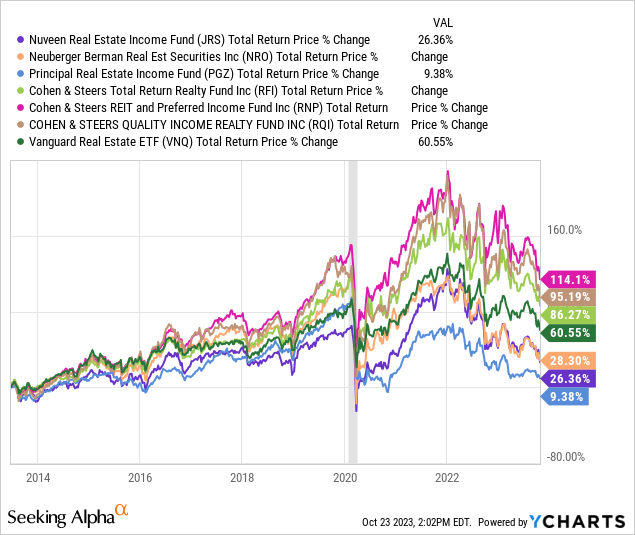
As you can see, the three Cohen & Steers funds all beat VNQ, while the three non-Cohen & Steers funds underperformed VNQ.
Meanwhile, the two global real estate CEFs underperformed VNQ but outperformed the Vanguard Global ex-U.S. Real Estate Index Fund ETF Shares (VNQI), which is perhaps to be expected.
YCHARTS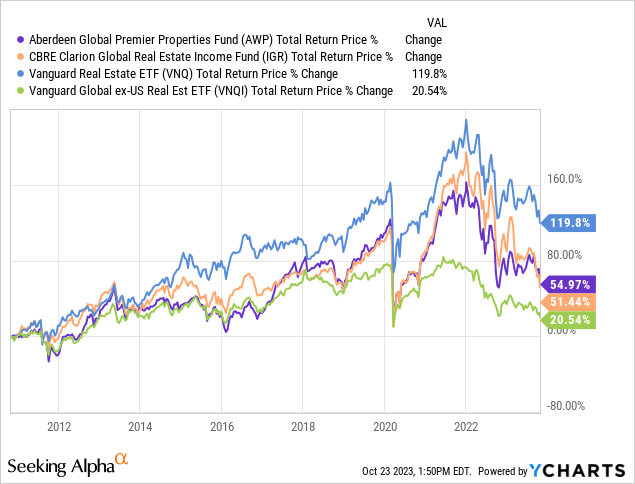
While one might think that the collapse in these two CEFs' stock prices has produced a hefty discount to NAV, that isn't really the case. Since the beginning of 2022, these CEFs' underlying holdings have also fallen significantly in price, and thus their discounts to NAV are not meaningfully deep on a historical basis.
Thus, the middling performance exhibited by these CEFs is mostly due to the performance of their portfolios (with leverage piling on the pain) rather than a deepening discount to NAV.
When looking only at the three underperforming CEFs, we find that their NAVs have all underperformed the unleveraged VNQ. This is largely due to the poor performance of their preferred stock holdings over the last few years, combined with the negative effect of leverage during a rising interest rate period.
YCHARTS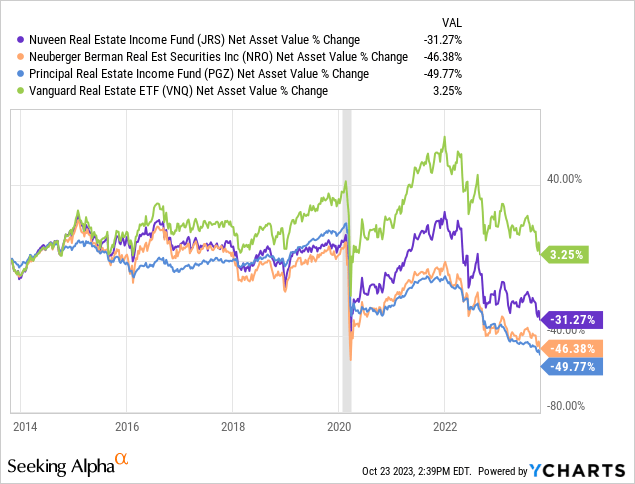
But again here, there is no opportunity. The discount to NAV of these three REITs is not materially different from their historic averages. JRS is a bit cheaper, but the difference is not material.
Cohen & Steers is a top-notch asset manager in the public real assets, and especially public real estate securities, space. For their CEFs, they actively manage the portfolio of holdings, emphasizing the best (mostly investment grade) REITs. Hence, their funds' total return outperformance over VNQ over time.
Admittedly, this outperformance does not extend to NAV.
YCHARTS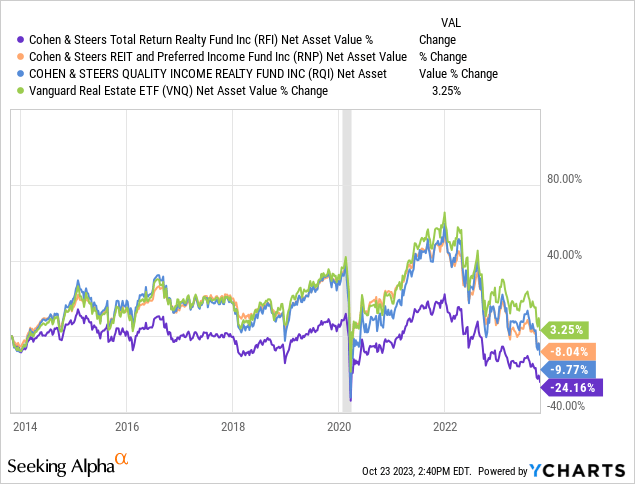
Why is this? This is because all three funds distribute well over 100% of net investment income as dividends. The rest comes from capital gains. When their underlying holdings rise in price, so does their NAV. Leverage supercharges this upward effect on NAV. Offsetting this is the fact that the fund continuously realizes capital gains to distribute to shareholders along with all net investment income, or "NII" (dividends and interest minus borrowing costs).
Thus, when CEFs' underlying holdings are falling in price, it creates a double whammy, as the leverage causes NAV to fall even more while capital gains dry up. If their holdings' prices (not to mention dividends!) fall to a sufficient degree, the CEF will be forced to cut its dividend, lest it erode NAV by using return of capital to pay dividends.
Above, you can see that RFI's NAV struggled to gain any upward momentum even before COVID-19 hit. That is because, in order to avoid cutting the dividend, management chose to use return of capital for distributions when the underlying holdings' dividends and capital gains didn't cut it on their own. This eroded NAV.
The benefit of leverage, as you can see in the chart above from RNP and RQI, is that when interest rates are adequately low, it increases NII, which lessens the CEF's reliance on capital gains to pay the distribution.
This is especially true when the underlying holdings offer higher yields, as in the case of preferred stocks. RNP boasts the best total returns in its peer group largely because half its portfolio is higher-yielding preferred stocks, which allows a much greater share of the fund's distribution to be paid from NII rather than capital gains.
When it comes to historical discounts to NAV, all three are expensive today relative to long-term averages.
Many retirees with a conservative and income-focused orientation in their investments are attracted to CEFs because of their higher yields. But we would caution not to rely too heavily on CEFs for income. After all, the higher yields come with increased complexities and risks. Leverage always adds some degree of risk, and CEFs' leverage is on top of their underlying holdings' own leverage.
With that said, for those who believe that interest rates will begin declining soon, we think certain real estate CEFs are an interesting leveraged bet on a REIT recovery.
In our view, the safest and perhaps best all-around pick in the space is RNP. This is because 50% of RNP is invested in higher-yielding preferred stocks that allow a greater share of the fund's distribution to be paid from NII rather than capital gains.
As of December 31st, 2023, over 80% of RNP's debt is fixed-rate at a 1.8% weighted average interest rate, and the weighted average interest rate for all debt sits at 2.6%.
Cohen & Steers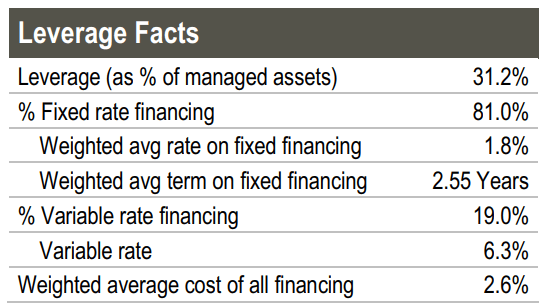
This is a fantastic overall borrowing cost when RNP's REIT holdings yield around 4% and its preferred holdings yield over 7%. This should ensure that interest costs won't eat into NAV.
I would not buy it at today's valuation, but if the discount expands, I would consider investing in it.
As for the other CEFs, we would be very cautious. We do not expect most of them to return to their late 2021 highs in price even if interest rates do decline meaningfully from here. This is because the combination of higher interest costs and the need to use capital gains and return of capital to fund distributions has eroded NAV.
Editor's Note: This article covers one or more microcap stocks. Please be aware of the risks associated with these stocks.