
Arthit Pornpikanet/iStock via Getty Images
Arthit Pornpikanet/iStock via Getty Images
This week features a tremendous 27 new dividend increases, beating the already stellar week last week (which had 21). These include Dividend King Kimberly-Clark (KMB) and three champions. Kimberly-Clark extends its 52-year streak with a 3.4% increase. The companies have an average increase of 7% and a median of 5.9%. Read on for the complete lists!
As an investor utilizing a dividend-growth strategy, I always look forward to receiving dividends, especially increases. I have observed that companies that regularly raise their dividend payouts perform significantly better than those that do not. I constantly monitor these companies and am happy to share my insights on upcoming dividend increases. I have compiled a list of top stocks expected to raise dividends in the upcoming week. You can confidently use this analysis to construct your portfolio and for timely purchases.
The information presented here is a result of merging two sources of data - the "U.S. Dividend Champions" spreadsheet from this website and upcoming dividend data from NASDAQ. The process combines data on companies with a consistent dividend growth history with future dividend payments. It's important to understand that all companies included in this list have consistently grown in dividends for at least five years.
Companies must have higher total yearly dividends to be included in this list. Hence, a company may not increase its dividend every calendar year, but the total annual dividend can still grow.
The ex-dividend date is when you must purchase shares to be eligible for the upcoming dividend or distribution. To qualify, you must have bought the shares by the end of the preceding business day. For instance, if the ex-dividend date is Tuesday, you must have acquired the shares by the market close on Monday. If the ex-dividend date is a Monday (or a Tuesday following a holiday on Monday), you must have bought the shares by the previous Friday.
Here are the definitions of the streak categories, as I'll use them throughout the piece.
| Category | Count |
| King | 1 |
| Champion | 3 |
| Contender | 13 |
| Challenger | 10 |
Data was sorted by the ex-dividend day (ascending) and then by the streak (descending):
| Name | Ticker | Streak | Forward Yield | Ex-Div Date | Increase Percent | Streak Category |
| Eversource Energy (D/B/A) | (ES) | 26 | 4.88 | 4-Mar-24 | 5.93% | Champion |
| Analog Devices, Inc. | (ADI) | 22 | 1.96 | 4-Mar-24 | 6.98% | Contender |
| Diamondback Energy, Inc. | (FANG) | 6 | 2 | 4-Mar-24 | 7.10% | Challenger |
| Enpro Inc. | (NPO) | 10 | 0.76 | 5-Mar-24 | 3.45% | Contender |
| Old Dominion Freight Line, Inc. | (ODFL) | 8 | 0.48 | 5-Mar-24 | 30.00% | Challenger |
| Canadian National Railway Company | (CNI) | 28 | 2.61 | 6-Mar-24 | 7.00% | Champion |
| Northrim BanCorp, Inc. | (NRIM) | 15 | 4.98 | 6-Mar-24 | 1.67% | Contender |
| Home Depot, Inc. (The) | (HD) | 15 | 2.38 | 6-Mar-24 | 7.66% | Contender |
| BlackRock, Inc. | (BLK) | 15 | 2.52 | 6-Mar-24 | 2.00% | Contender |
| Mosaic Company (The) | (MOS) | 6 | 2.72 | 6-Mar-24 | 5.00% | Challenger |
| Kimberly-Clark Corporation | (KMB) | 52 | 4.02 | 7-Mar-24 | 3.39% | King |
| Jack Henry & Associates, Inc. | (JKHY) | 34 | 1.27 | 7-Mar-24 | 5.77% | Champion |
| L3Harris Technologies, Inc. | (LHX) | 22 | 2.18 | 7-Mar-24 | 1.75% | Contender |
| Perrigo Company plc Ordinary Shares | (PRGO) | 21 | 4.17 | 7-Mar-24 | 1.10% | Contender |
| Reliance, Inc. | (RS) | 14 | 1.37 | 7-Mar-24 | 10.00% | Contender |
| Elevance Health, Inc. | (ELV) | 14 | 1.3 | 7-Mar-24 | 10.14% | Contender |
| Public Service Enterprise Group Incorporated | (PEG) | 13 | 3.83 | 7-Mar-24 | 5.26% | Contender |
| ITT Inc. Common Stock | (ITT) | 12 | 1.02 | 7-Mar-24 | 10.00% | Contender |
| Exponent, Inc. | (EXPO) | 12 | 1.42 | 7-Mar-24 | 7.69% | Contender |
| United Bancorp, Inc. | (UBCP) | 10 | 5.81 | 7-Mar-24 | 1.50% | Contender |
| Williams Companies, Inc. | (WMB) | 7 | 5.39 | 7-Mar-24 | 6.03% | Challenger |
| Schneider National, Inc. | (SNDR) | 7 | 1.63 | 7-Mar-24 | 5.56% | Challenger |
| AMETEK, Inc. | (AME) | 5 | 0.63 | 7-Mar-24 | 12.00% | Challenger |
| Knight-Swift Transportation Holdings Inc. | (KNX) | 5 | 1.14 | 7-Mar-24 | 14.29% | Challenger |
| Novartis AG | (NVS) | 5 | 2.22 | 7-Mar-24 | 3.13% | Challenger |
| Genpact Limited | (G) | 8 | 1.75 | 8-Mar-24 | 10.87% | Challenger |
| Victory Capital Holdings, Inc. | (VCTR) | 5 | 3.54 | 8-Mar-24 | 4.69% | Challenger |
Streak: Years of dividend growth history are sourced from the U.S. Dividend Champions spreadsheet.
Forward Yield: The new payout rate is divided by the current share price.
Ex-Dividend Date: This is the date you need to own the stock.
Increase Percent: The percent increase.
Streak Category: This is the company's overall dividend history classification.
Here's a table mapping the new rates versus the old rates. It also reiterates the percentage increase. This table is sorted similarly to the first (ex-dividend day ascending, dividend streak descending).
| Ticker | Old Rate | New Rate | Increase Percent |
| ES | 0.675 | 0.715 | 5.93% |
| ADI | 0.86 | 0.92 | 6.98% |
| FANG | 0.84 | 0.9 | 7.10% |
| NPO | 0.29 | 0.3 | 3.45% |
| ODFL | 0.4 | 0.52 | 30.00% |
| CNI | 0.790 CAD | 0.845 CAD | 7.00% |
| NRIM | 0.6 | 0.61 | 1.67% |
| HD | 2.09 | 2.25 | 7.66% |
| BLK | 5 | 5.1 | 2.00% |
| MOS | 0.2 | 0.21 | 5.00% |
| KMB | 1.18 | 1.22 | 3.39% |
| JKHY | 0.52 | 0.55 | 5.77% |
| LHX | 1.14 | 1.16 | 1.75% |
| PRGO | 0.273 | 0.276 | 1.10% |
| RS | 1 | 1.1 | 10.00% |
| ELV | 1.48 | 1.63 | 10.14% |
| PEG | 0.57 | 0.6 | 5.26% |
| ITT | 0.29 | 0.319 | 10.00% |
| EXPO | 0.26 | 0.28 | 7.69% |
| UBCP | 0.1675 | 0.17 | 1.50% |
| SNDR | 0.09 | 0.095 | 5.56% |
| WMB | 0.448 | 0.475 | 6.03% |
| NVS | 3.2 CHF | 3.3 CHF | 3.13% |
| AME | 0.25 | 0.28 | 12.00% |
| KNX | 0.14 | 0.16 | 14.29% |
| G | 0.138 | 0.153 | 10.87% |
| VCTR | 0.32 | 0.335 | 4.69% |
Some different metrics related to these companies include yearly pricing action and the P/E ratio. The table is sorted the same way as the table above.
| Ticker | Current Price | 52 Week Low | 52 Week High | P/E Ratio | % Off Low | % Off High |
| ES | 58.58 | 51.48 | 78.93 | 24.63 | 14% Off Low | 26% Off High |
| ADI | 187.79 | 153.54 | 202.77 | 43.79 | 22% Off Low | 7% Off High |
| FANG | 179.78 | 115.12 | 183.96 | 0 | 56% Off Low | 2% Off High |
| NPO | 158.9 | 91.08 | 167.21 | 0 | 74% Off Low | 5% Off High |
| ODFL | 433.16 | 294.59 | 448.45 | 39.45 | 47% Off Low | 3% Off High |
| CNI | 129.73 | 103.44 | 132.12 | 30.53 | 25% Off Low | 2% Off High |
| BLK | 809.68 | 592.23 | 823.71 | 23.52 | 37% Off Low | 2% Off High |
| NRIM | 48.96 | 31.64 | 59.9 | 7.75 | 55% Off Low | 18% Off High |
| HD | 377.42 | 271.54 | 379.84 | 22.7 | 39% Off Low | 1% Off High |
| MOS | 30.9 | 29.25 | 56.21 | 0 | 6% Off Low | 45% Off High |
| KMB | 121.27 | 115.2 | 143.81 | 19.91 | 5% Off Low | 16% Off High |
| JKHY | 173.42 | 135.66 | 178.37 | 40.8 | 28% Off Low | 3% Off High |
| LHX | 213.21 | 159.28 | 216.17 | 31.73 | 34% Off Low | 1% Off High |
| PRGO | 26.4 | 26.21 | 39.61 | 0 | 1% Off Low | 33% Off High |
| ELV | 503.3 | 409.37 | 516.61 | 23% Off Low | 3% Off High | |
| RS | 321.38 | 227.47 | 333.33 | 19.71 | 41% Off Low | 4% Off High |
| PEG | 62.64 | 53.23 | 64.95 | 15.67 | 18% Off Low | 4% Off High |
| ITT | 125.64 | 75.15 | 127.13 | 41.59 | 67% Off Low | 1% Off High |
| EXPO | 79.03 | 64.2 | 104.03 | 56.39 | 23% Off Low | 24% Off High |
| UBCP | 11.87 | 9.39 | 14.67 | 9.96 | 26% Off Low | 19% Off High |
| SNDR | 23.28 | 21.31 | 31.52 | 20.7 | 9% Off Low | 26% Off High |
| WMB | 35.26 | 26.71 | 36.98 | 121.76 | 32% Off Low | 5% Off High |
| KNX | 55.9 | 45.62 | 60.99 | 21.34 | 23% Off Low | 8% Off High |
| NVS | 102.23 | 79.64 | 108.78 | 29.19 | 28% Off Low | 6% Off High |
| AME | 178.7 | 130.88 | 180.12 | 31.11 | 37% Off Low | 1% Off High |
| G | 34.82 | 29.29 | 47.28 | 25.32 | 19% Off Low | 26% Off High |
| VCTR | 37.86 | 26.16 | 38.19 | 7.55 | 45% Off Low | 1% Off High |
I've arranged the table in descending order for investors to prioritize the current yield. As a bonus, the table also features some historical dividend growth rates. Moreover, I have incorporated the "Chowder Rule," which is the sum of the current yield and the five-year dividend growth rate.
| Ticker | Yield | 1 Yr DG | 3 Yr DG | 5 Yr DG | 10 Yr DG | Chowder Rule |
| UBCP | 5.81 | 6.4 | 5.3 | 5.1 | 8.7 | 10.8 |
| WMB | 5.39 | 5.3 | 3.8 | 5.7 | 2.2 | 11.1 |
| NRIM | 4.98 | 31.9 | 20.3 | 18.7 | 14.1 | 23.7 |
| ES | 4.88 | 5.9 | 6 | 6 | 6.3 | 10.8 |
| PRGO | 4.17 | 5 | 6.7 | 7.5 | 11.7 | 11.5 |
| KMB | 4.02 | 1.7 | 3.3 | 3.4 | 3.8 | 7.4 |
| PEG | 3.83 | 5.6 | 5.2 | 4.9 | 4.7 | 8.8 |
| VCTR | 3.54 | 28 | 77.2 | |||
| MOS | 2.72 | 86.7 | 73.8 | 60.1 | 0.5 | 62.8 |
| CNI | 2.61 | 3.2 | 10.3 | 10.8 | 10.9 | 13.4 |
| BLK | 2.52 | 2.5 | 11.3 | 10.7 | 11.5 | 13.3 |
| HD | 2.38 | 10 | 11.7 | 15.2 | 18.3 | 17.6 |
| NVS | 2.22 | 5.2 | 4.3 | 3.6 | 3.7 | 5.8 |
| LHX | 2.18 | 1.8 | 10.3 | 12.7 | 11.2 | 14.9 |
| FANG | 2 | 17.2 | 29.8 | 54.3 | 56.3 | |
| ADI | 1.96 | 13.2 | 11.5 | 12.4 | 9.7 | 14.4 |
| G | 1.75 | 10 | 12.2 | 12.9 | 14.6 | |
| SNDR | 1.63 | 12.5 | 11.5 | 8.5 | 10.1 | |
| EXPO | 1.42 | 8.3 | 11 | 14.9 | 21.4 | 16.3 |
| RS | 1.37 | 14.3 | 17 | 14.9 | 12.3 | 16.3 |
| ELV | 1.3 | 15.6 | 15.9 | 14.6 | 14.7 | 15.9 |
| JKHY | 1.27 | 6.1 | 6.5 | 7.1 | 11 | 8.4 |
| KNX | 1.14 | 16.7 | 20.5 | 18.5 | 8.9 | 19.6 |
| ITT | 1.02 | 9.9 | 19.7 | 16.7 | 11.2 | 17.7 |
| NPO | 0.76 | 3.6 | 3.7 | 3.9 | 4.7 | |
| AME | 0.63 | 13.6 | 11.6 | 12.3 | 15.3 | 12.9 |
| ODFL | 0.48 | 33.3 | 38.4 | 35.8 | 36.3 |
My investment strategy involves finding stocks combining increasing dividends and consistently outperforming the market. I use the Schwab U.S. Dividend Equity ETF (SCHD) as my dividend growth benchmark. This ETF has a remarkable track record of exceptional performance, a higher yield than the S&P 500, and a proven record of growing dividends. I prefer to invest in the ETF if a stock cannot beat the benchmark. I've added companies to my personal investment portfolio based on this analysis. I also routinely use this analysis to choose timely additional purchases.
I'm comparing SCHD to the companies with the highest 10-year dividend growth rates. The 10-year dividend growth rate is one factor in the methodology behind SCHD. It's also a proxy for success, as it is easier to continually grow a dividend over long periods, with the share price following. Here are the results.
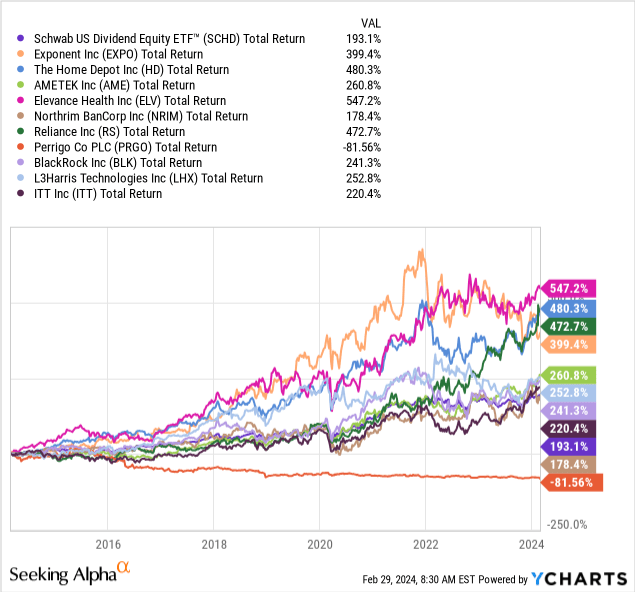
Let's start with the bad this week. PRGO finished the decade with a -82% total return, which is impressive considering they have a nearly 12% annual dividend increase over the past decade. It's an excellent counterexample that while consistent dividend increases suggest long-term company advantages leading to stock returns, this singular facet won't be accurate 100% of the time.
Let's look at the good with the bad out of the way. SCHD finished with a 193% total return. ELV was the big winner with a 547% total return, but they were followed very strongly by HD, RS, and EXPO, all of whom offered 400%+ total returns.
The other tranche of AME, LHX, BLK, and ITT companies all offered SCHD-beating 220-260% total returns.
Please do your due diligence before making any investment decision.
Editor's Note: This article discusses one or more securities that do not trade on a major U.S. exchange. Please be aware of the risks associated with these stocks.