
PM Images
PM Images
DGI investors are running out of options. Earnings growth rates for U.S. stocks are declining, and dividend payout ratios are getting stretched, yet the quest for double-digit dividend growth continues. Last November, I warned of decelerating dividend growth for the iShares Core Dividend Growth ETF (NYSEARCA:DGRO), but after evaluating the alternatives, there aren't many better choices. My analysis reveals a relatively high 5.51% estimated earnings growth rate, a low 45.11% payout ratio, and dividend safety, consistency, and growth scores that rank near the top in the large-cap value category, which includes competitors like the Vanguard Dividend Appreciation ETF (VIG) and the WisdomTree U.S. Quality Dividend Growth Fund (DGRW). DGRO's low 2.34% expected dividend yield is the tradeoff, but that's the level DGI investors should aim for to avoid sacrificing too much total return. I look forward to reviewing the numbers and providing valuable information on DGRO and several other dividend growth alternatives in more detail below.
DGRO tracks the Morningstar US Dividend Growth Index, selecting from a universe of stocks representing the top 97% of the investable U.S. stock market. Key screens include at least five years of uninterrupted dividend growth, a positive earnings consensus forecast, payout ratios less than 75%, and a screen that avoids those in the top 10% by dividend yield. The process is summarized below.
Morningstar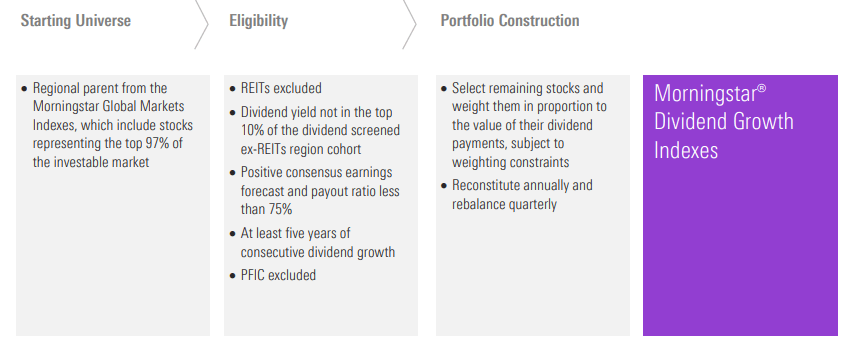
Notably, the Index requires all securities to pay a qualified dividend, which means it excludes REITs. For the fiscal year ending April 30, 2023, the ETF generated a small amount of income from securities lending, as shown below.
iShares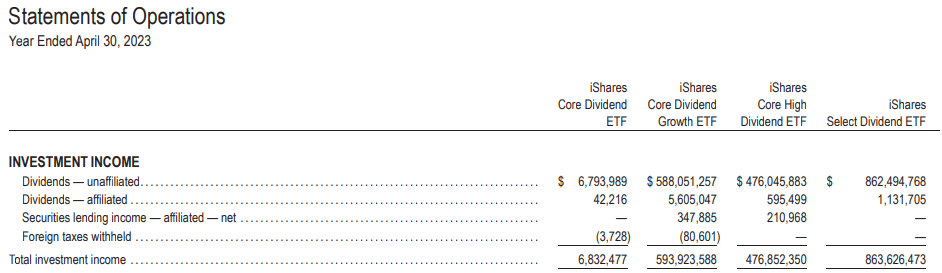
DGRO's 0.08% expense ratio is advantageous because shareholders receive nearly all the underlying dividend income each quarter. Other ETFs, like the ProShares S&P 500 Dividend Aristocrats ETF (NOBL), have higher expense ratios (0.35%), reducing yield. NOBL's constituents have a weighted average trailing dividend yield of 2.39%, but the ETF's trailing dividend yield is only 2.03% due to fees. In addition, this "skimming off the top" hampers dividend growth, so it's not an ETF I favor for DGI investors.
When I evaluate dividend growth potential, I consider two things:
The "willingness" part is relatively straightforward. A company's track record provides good guidance, and we can rely on historical metrics like the number of consecutive years a company has increased dividend payments and their three- and five-year dividend growth rates. Seeking Alpha's ETF Screener can be a good starting point. However, it's still inadequate for assessing willingness to increase because these metrics might not reflect an ETF's current holdings. Aggressive rebalancing schedules and high portfolio turnover rates can make these metrics poor predictors of future dividend growth.
The "ability" part is more challenging to assess but arguably more relevant. Companies raising dividends without considering financial health might satisfy DGI investors, but they are more likely to see these poor decisions show up in their share price. Since dividends are paid out of earnings, sufficient earnings growth must accompany dividend growth or dividend payout ratios will become too stretched. Also, unless a company can cut costs continuously, it will have to increase sales. Unfortunately, these metrics aren't readily available for ETFs because:
These metrics, though standard filters in stock screeners, force ETF investors to take shortcuts. Unfortunately, these investors emphasize an ETF's historical dividend growth rate and total returns without regard for reconstitutions, potentially ignoring how stocks that drove the fund's past success may not even be held anymore. In addition, they fail to realize at least part of an ETF's dividend growth rate is "synthetic" and impacted by how frequently the portfolio balances. For those interested in learning more, I discussed these pitfalls in more detail in a recent article on the DGI investing strategy.
The good news is there's a better way. Seeking Alpha provides dividend safety, growth, yield, and consistency scores for nearly all dividend-paying U.S. stocks. Below are the grades for Broadcom (AVGO), DGRO's largest holding:
Seeking Alpha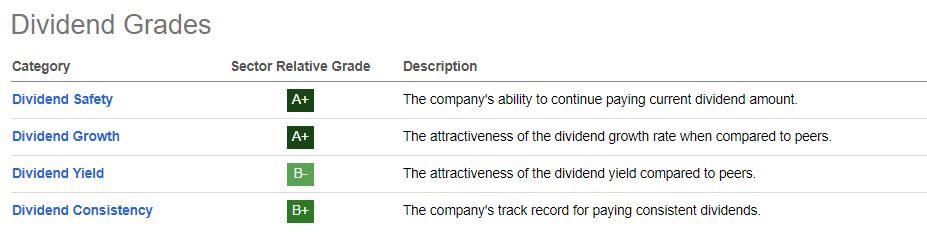
Since an ETF is a basket of individual stocks, we can convert these grades to a score between 1-10 and weight them accordingly. This calculation is part of my weekly process for updating a database of 850+ U.S. Equity ETFs, and in the large-cap value category, DGRO's scores are impressive:
DGRO ranks highly in the three categories that assess a company's willingness and ability to increase dividends. Its weakness is a below-average dividend yield score. Based on today's holdings and weightings, DGRO's constituents have a 2.42% weighted average dividend yield. Fortunately, the expense ratio of 0.08% is minimal, so the net is 2.34%. This figure closely mirrors DGRO's 2.32% trailing dividend yield.
Seeking Alpha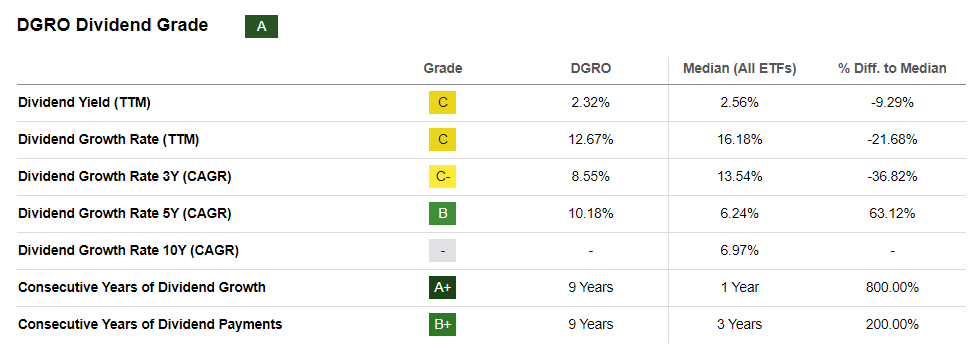
This table also reveals a 10.18% five-year dividend growth rate, which draws many DGI investors to DGRO in the first place. Notably, its constituents have grown dividends at a 9.74% rate over the last five years, which is remarkably close and unusual for many dividend ETFs. To illustrate, consider these differences between the ETF's five-year dividend growth rate and the constituents' growth rates:
Most have a few percentage point differences between the dividend growth delivered by the ETF and the dividend growth delivered by its current constituents. SCHD, RDVY, and VIG still look solid, and DGRW is quite the anomaly, as its 4.86% ETF dividend growth rate is far lower than it should be. Regardless, we still need to go deeper and assess each fund's ability to increase dividends in the future. Let's do that next with a comprehensive fundamental analysis.
The following table highlights selected growth and dividend-related metrics for DGRO's top 25 holdings, totaling 47.42% of the portfolio. These holdings include IBM (IBM), a new addition as of December 18, 2023. Meanwhile, Pfizer (PFE) and Texas Instruments (TXN) were deleted because they failed the "extreme dividend yield" and "high payout ratio" screens. You can view the full reconstitution results here.
The Sunday Investor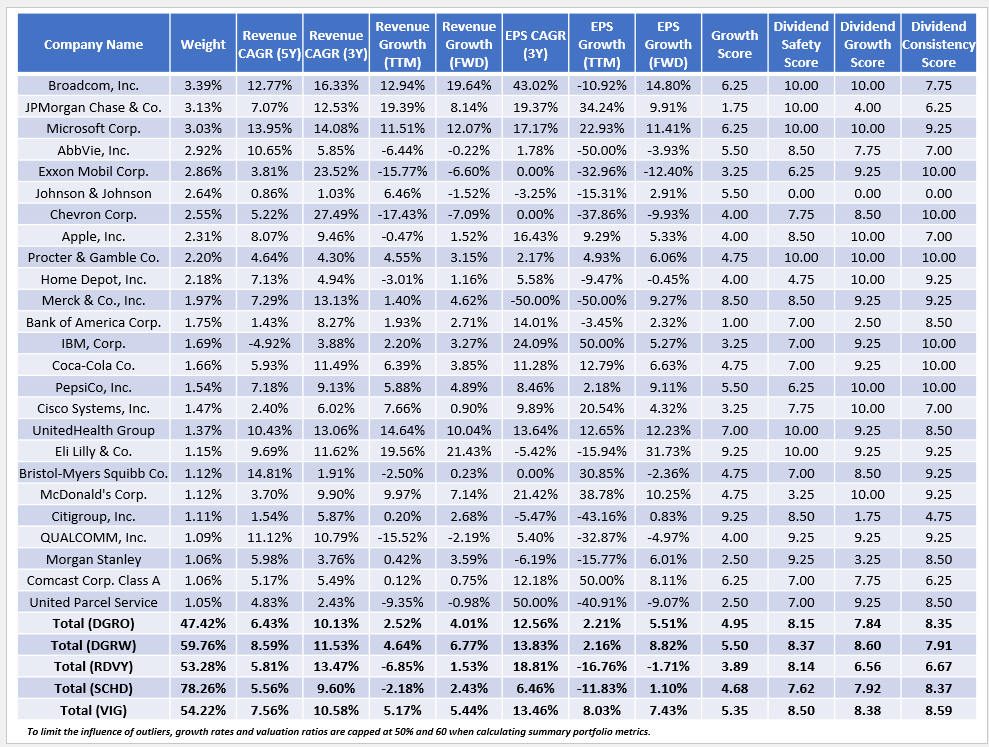
Here are three observations to consider:
1. Wall Street analysts expect DGRO's constituents to grow sales and earnings per share by 4.01% and 2.21% over the next year, which likely can't support strong dividend growth. This somewhat weak growth is wrapped in a growth score of 4.95/10, which is better than RDVY and SCHD but worse than DGRW and VIG. However, VIG's dividend safety, growth, and consistency scores are solid, demonstrating a strong willingness to increase dividends. VIG's 8.03% estimated EPS growth rate also indicates a better ability to increase dividends.
2. The table includes three-year and one-year trailing EPS growth figures, and with this information, we can calculate the annualized EPS growth rates for the two years prior to last year. For DGRO, the formula is:
(((1+0.1256)^3)/(1+0.0221))^(1/2)-1 = 18.12%
The annualized growth rates for the other four ETFs were:
Given the discrepancies between these EPS growth rates, the significantly weaker actual growth rates over the last year, and the single-digit or negative estimated growth rates for next year, it's unreasonable for DGI investors to expect the same level of dividend growth moving forward. Given their willingness to increase dividends, these ETFs may be the best place to look. However, the catalyst has to be stronger EPS growth rates, and that's not the case today.
3. DGRO, DGRW, and VIG offer the best chance at high dividend growth due to relatively higher EPS growth rates of 5.51%, 8.82%, and 7.43%, respectively. However, there's a catch. These ETFs have trailing yields of 2.32%, 1.67%, and 1.79%, which may not be high enough for many income investors.
Seeking Alpha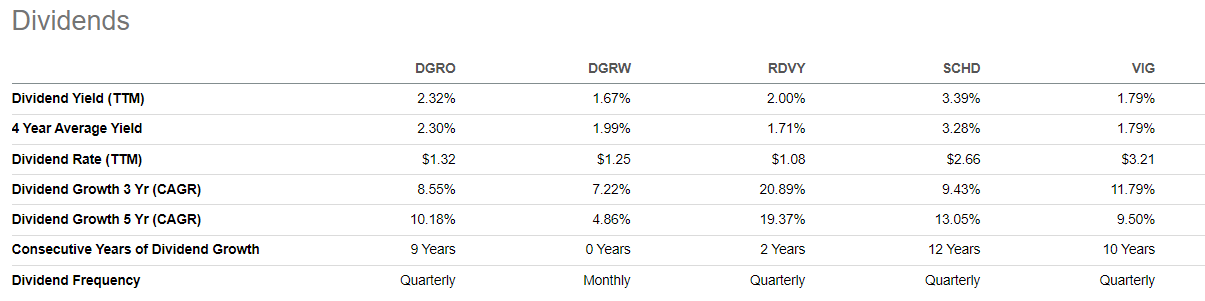
Nevertheless, the takeaway is that DGI investors can no longer realistically find an ETF offering high yield and dividend growth, so they need to adjust their expectations.
Finally, I want you to consider DGRO's fundamentals by sub-industries. This type of analysis bridges the gap between surface-level sector analysis and detailed company-level analysis, which is difficult for funds like DGRO with hundreds of holdings. As shown below, DGRO's top 25 sub-industries total 73.87%, putting it on par with VIG for the best-diversified fund in the sample.
The Sunday Investor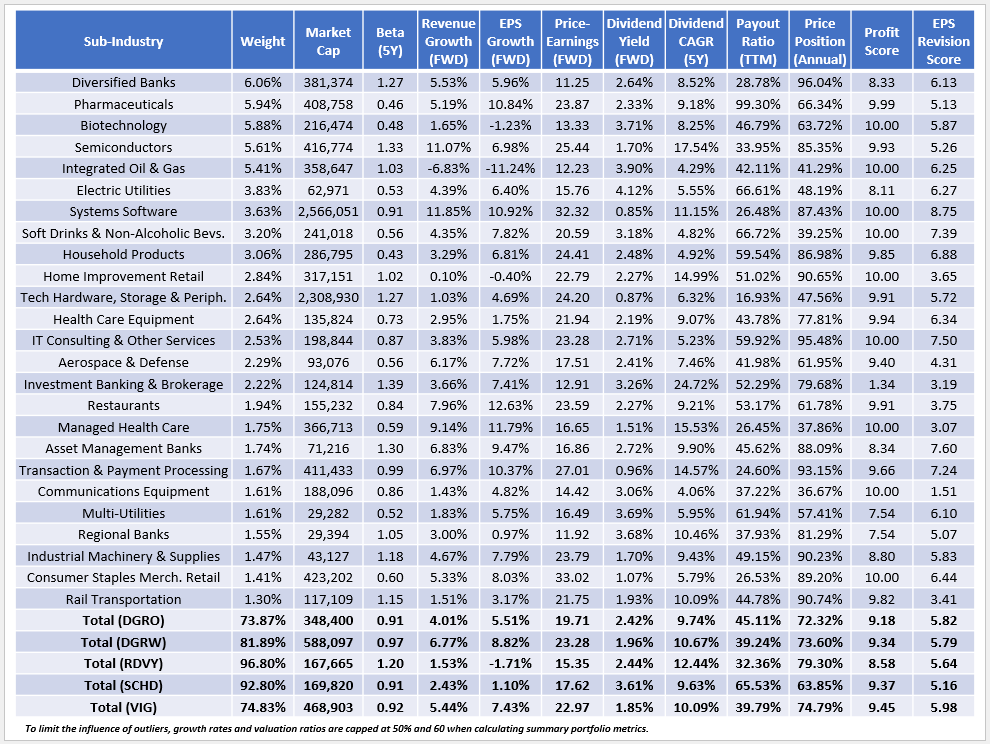
Here are three additional observations:
1. DGRO, SCHD, and VIG have nearly identical five-year betas, indicating they should offer a similar level of volatility relative to the market. However, please note these figures are only a "snapshot" in time, and particularly, SCHD's composition could change on March 18, 2024, its scheduled reconstitution date. I expect Broadcom (AVGO) will be deleted, but it should remain in other ETFs like DGRO and VIG. While this would enhance SCHD's dividend yield, it would likely lower future dividend growth. Broadcom has a perfect "A+" Seeking Alpha Profit Grade, 29.93% net margins, a payout ratio well below its four-year average (33.68% vs. 50.40%), and a 19.25% five-year dividend growth rate.
2. Since dividend investors are often value investors, DGRO's 19.71x weighted average forward P/E is crucial to watch. I also calculated a 16.66x harmonic weighted average forward P/E, consistent with Morningstar, but regardless of your preferred calculation method, DGRO is attractively priced compared to DGRW and VIG. To be sure, there is less earnings growth, but it might be enough to satisfy some DGI investors. If you have a long time horizon and no immediate income needs, it's best to stick with well-diversified, high-quality funds and not concern yourself too much with starting yield. If this sounds like you, also consider the following:
These ETFs have low expense ratios, 10%+ estimated EPS growth and five-year dividend growth for its constituents, and as their names suggest, are high-quality funds. Sustaining high dividend growth seems likely, but their dividend yields are quite low.
3. Many investors might be reluctant to buy DGRO or its peers because they're trading near their all-time highs. While true, there are few alternatives DGI investors can turn to. Consider DGRO's 73.32% annual price position, which is the weighted calculation of each company's current price position relative to their 52-week high and low prices. It's about the same as DGRW and VIG and 6% less than RDVY. SCHD is the outlier at 63.85%, and along with its low 15.35x forward P/E (15.00x harmonic forward P/E), it's the best value play of the five.
DGI investors must accept that double-digit dividend growth and 3-4% starting dividend yields are unrealistic without risking significant share price declines. For these investors, I recommend accepting the lower yield and sticking with high-quality companies with low payout ratios and reasonable earnings growth rates that can support future dividend growth. Consider that DGRO's 5.51% estimated EPS growth is better than most peers, and its 8.15/10 Dividend Safety Score and 45.11% dividend payout ratio indicate it's in a good position to weather the "deteriorating growth" storm facing investors today. DGRW and VIG's growth metrics are better, but DGRO features excellent diversification, a higher dividend yield, and a lower P/E, so it deserves to be in the mix when deciding which dividend growth ETF is best. I hope you found this information helpful, and I look forward to answering your questions in the comments section below. Thank you for reading.