
Ping Shu/Moment via Getty Images
Ping Shu/Moment via Getty Images
Nordic American Tankers (NYSE:NAT) is another pure-play crude oil tanker company. Unlike DHT Holdings (DHT), which owns only VLCCs, NAT is focused on Suezmax tankers. The company runs 20 vessels with an average age of 12.6 years. NAT’s solid balance sheet has enough liquidity and a prudent capital structure. NAT’s margins are lower than those of its direct competitors, although it delivers a respectable ROE. For the first three-quarters of 2023, NAT achieved impressive results. Net voyage revenue grew by 107% YoY. The company pays dividends with an attractive yield of 11.61% and trades at 88% P/NAV, 2.40 EV/Sales, and 5.55 EV/EBITDA. It is the cheapest compared to Okeanis Eco Tankers (ECO) and DHT. NAT is an attractive proposition with its Suezmax-only fleet, robust financials, and attractive dividend yields. I give NAT a buy rating.
NAT has 20 Suezmax tankers at an average fleet age of 12.6 years. The table below from the company’s website shows the NAT’s fleet.
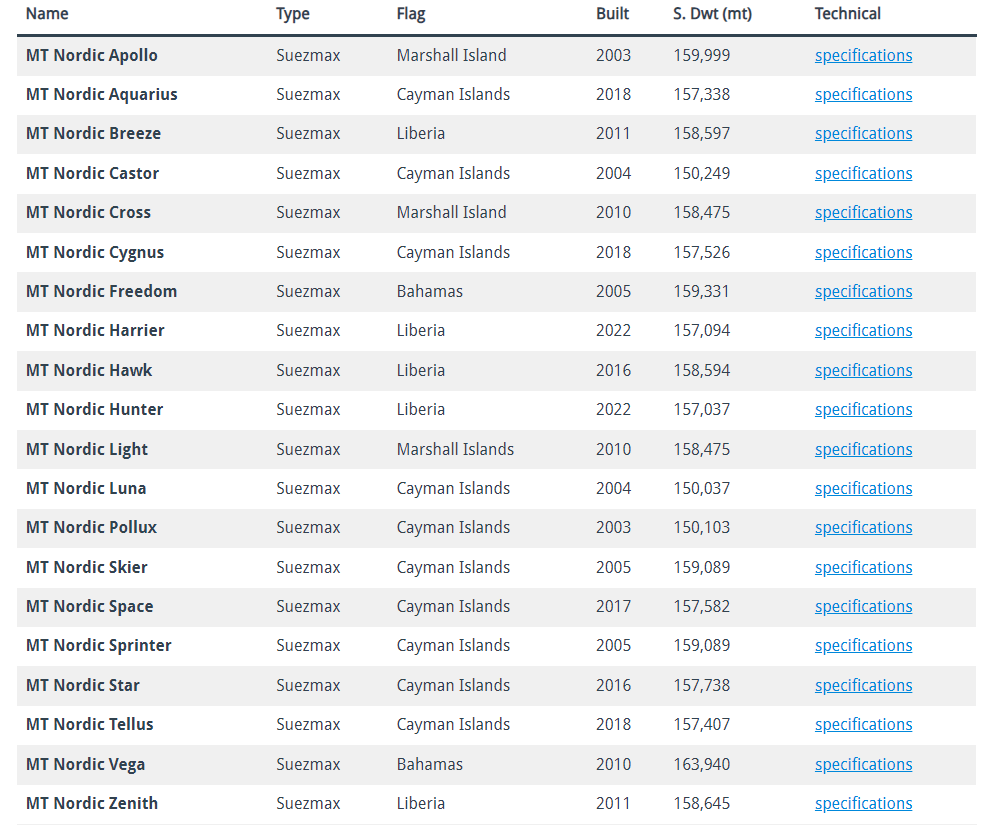
NAT website
The latest addition to NAT's fleet is the Nordic Hawk, built by Hyundai Heavy Industries in South Korea in 2016. The ship was delivered in 4Q23. Nordic Hawk purchase is financed through a financing agreement with Ocean Yield. The latter specializes in ship financing. Among Ocean Yield counterparts are Braskem (BAK), Euronav (EURN), and ZIM Integrated Shipping (ZIM). NAT has another five vessels under Ocean Yield agreements. Nordic Hawk transaction is an eight-year bareboat charter.
NAT fleet is well positioned to benefit from a record low Suezmax order book.
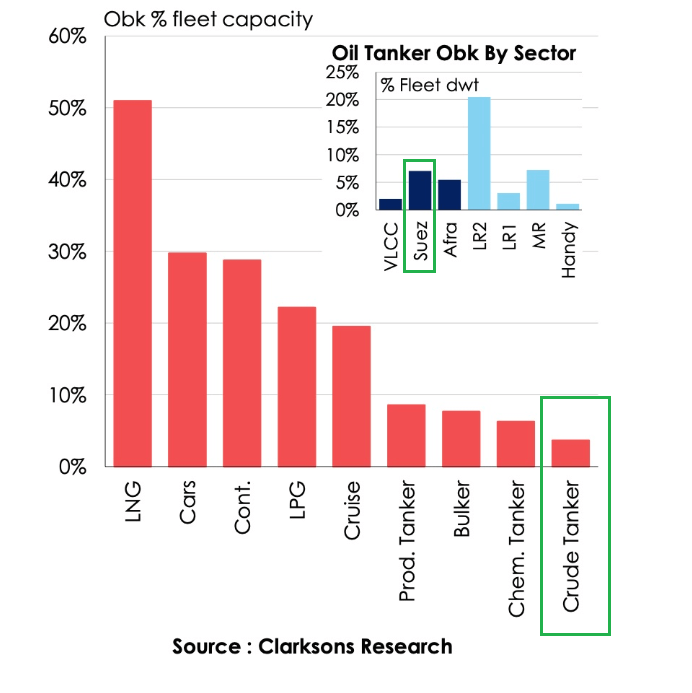
Clarksons
As a group, crude oil tankers hold the pole position with below 3% order book. Looking in detail, Suezmax has a 7.4% order book, the highest in the crude oil tanker segment, though still below 10%. The global Suezmax tanker fleet comprises 639 vessels with an average age of 10 years.
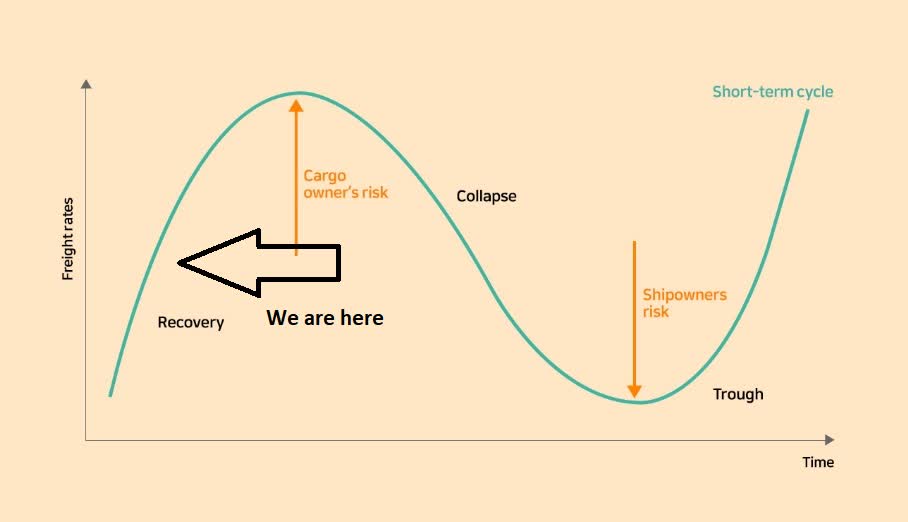
Nordic operates 15 (75% of the fleet) of its ships under spot contracts and five under time charters. In my opinion, having higher exposure to the spot market is the right decision at the current stage of the tanker cycle. We are in the middle of the cycle, meaning there is still upside potential for TCE growth.
Cello Square
The order book is still too low, and the shipyard capacity is limited. Hence, an oversupply of vessels in the coming two years is not a plausible scenario. Other decisive factors are crude oil supply and demand and the rising imbalance between East and West. Production grows in the West while declines in the East. On the other hand, the refining capacity declines in the West and increases in the East. Millions of oil barrels must be moved across the globe from West to East, resulting in higher crude oil tanker demand.
The Middle East crisis is the spark that ignited the already hot tanker market. Suezmax tankers are built to sail through the Suez Canal. Since the crisis started, those ships are no longer sailing through the Red Sea. Now, they take a voyage via the Cape of Good Hope. This means extended charters and growing revenues for the ship owners. Aframax tankers (LR2 for product tankers) are affected similarly.
I expect higher TCE rates in the coming quarters due to the points I discussed. Now, it is time for tanker companies to have higher spot exposure. Once we approach the peak, it is time to increase time charters exposure. The point is to lock better rates before TCE contraction.
In 3Q23, NAT realized $32,832/day average TCE for its spot vessels. Including time-chartered ships, the composite 3Q23 TCE is $31,235/day. In 3Q22, the rate was $27,850/day. The daily operating costs per ship remained stable at $9,000/day. 73% of spot voyage days 4Q23 are booked at $43,160/day.
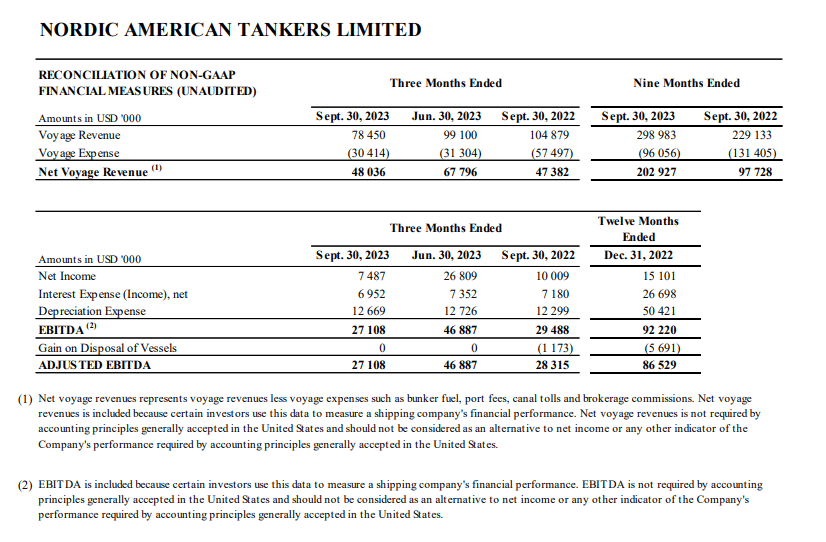
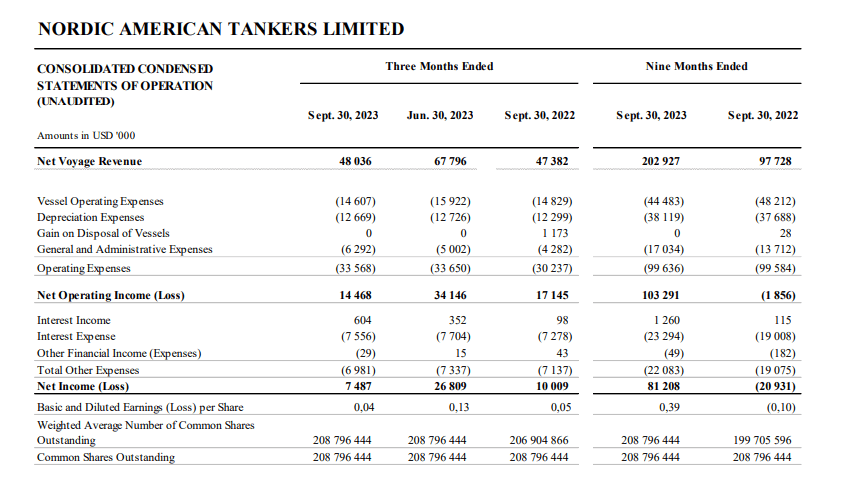
The following two charts show 3Q23 and 9M23 financial highlights.
NAT 3Q23 presentation
NAT 3Q23 presentation
In 3Q23, the company delivered $78.4 million of voyage revenue, which is 25% lower YoY. The voyage expenses (bunkering costs, canal tolls, port fees, brokerage commissions) dropped by 47% YoY, from $57.4 million in 3Q22 to $30.4 million in 3Q23. This resulted in higher net voyage revenue YoY by 1.4%. Voyage operating expenses declined by 1.4%YoY. However, operating expenses grew by 10%. General and Administrative expenses are significant contributors, which increased by 48% YoY. NAT's net income and EPS dropped by 25% YoY.
For 9M23, NAT delivered $202.9 million in net voyage revenue, which is 107% higher than 9M22. Over the same period, operating expenses remained stable at $99.6 million. Net operating income turned from $(1.856) million in 9M22 to $103 million in 9M23. The company’s bottom line reached $81.2 million for 9M23, resulting in $0.39 EPS.
NAT has a robust balance sheet with $69 million cash (ex. restricted cash), $229 million long-term debt, and $255 million total debt. Over the last five years, the company maintained relatively low leverage, as seen in the table below.
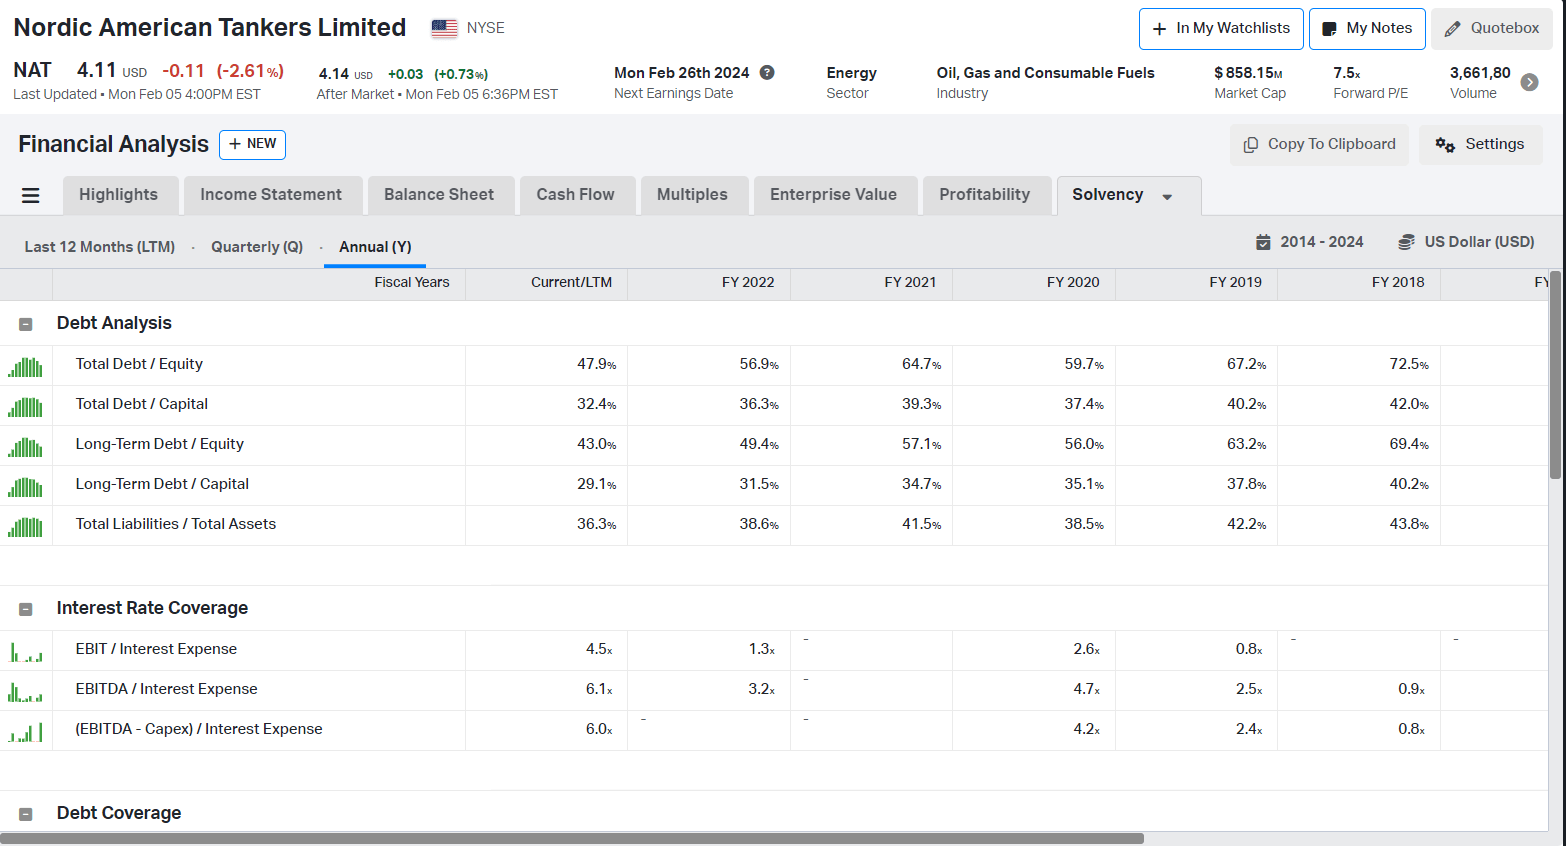
Koyfin
NAT delivered $166 million LTM operating cash flow and $141 million operating income. Net interest expenses are $30 million. NAT has ample liquidity, given those figures. In 2024, NAT must repay $26.7 million; in 2025, $88 million; and in 2026, $15.7 million.
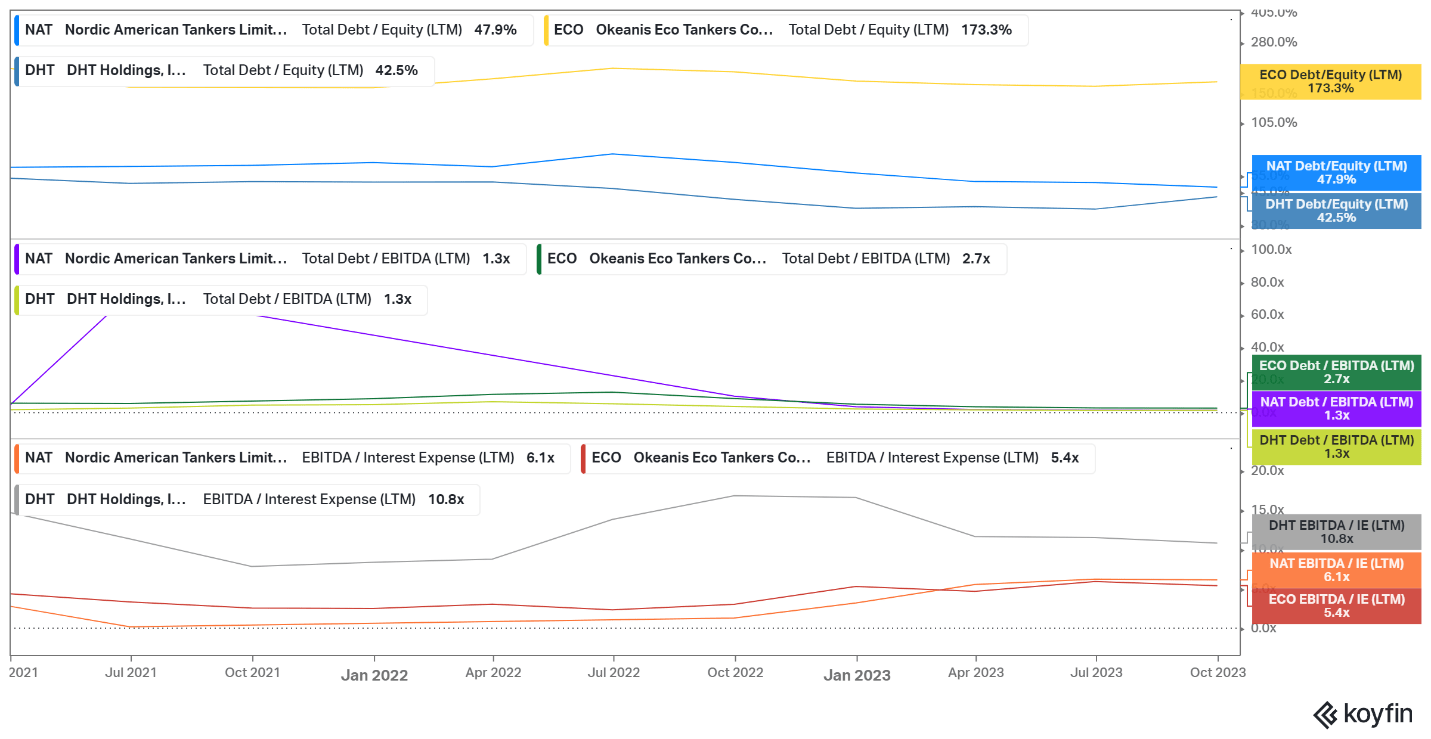
The chart below compares NAT, DHT, and ECO solvency and liquidity metrics. I chose those two because they share more similarities than differences. DHT has 24 VLCCs, while ECO has 6 Suezmaxes and 8 VLCCs.
Koyfin
NAT has 47.9% total debt/equity, 1.3 total debt/EBITDA, and 6.1 EBITDA/Interest Expenses. ECO uses more leverage than the other two, though its fleet has the lowest average age, five years, and all ships are scrubber-equipped. The DHT fleet is older; however, it is fully equipped with scrubbers.
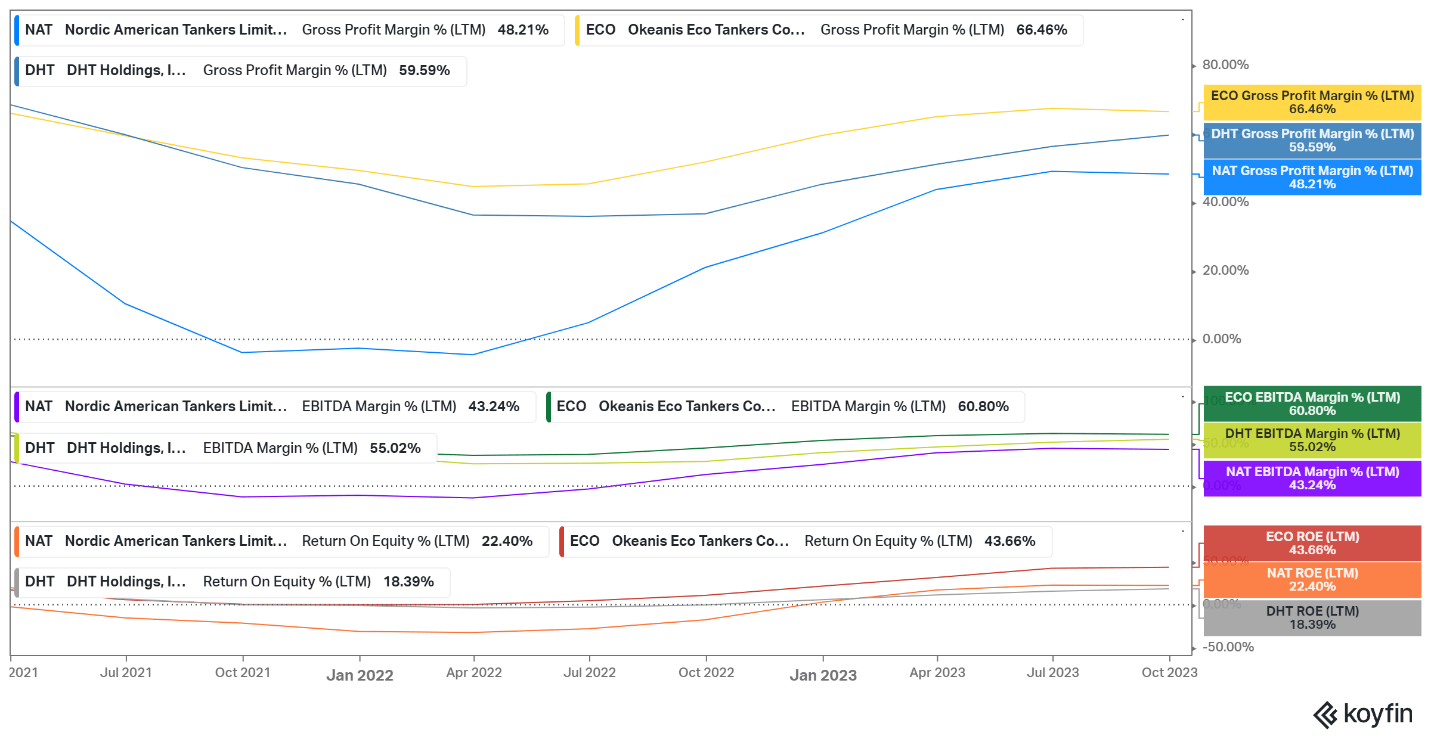
The following chart compares margins and returns. All figures are LTM.
Koyfin
NAT margins are lower than ECO and DHT. ECO commands the best margins due to its younger fleet being 100% equipped with scrubbers. NAT’s older vessels mean higher maintenance and repair costs, resulting in lower margins. Despite that, NAT delivered 22.4% ROE, higher than DHT though much lower than ECO.
The following chart compares NAT, ECO, DHT, and major players in the crude tanker industry. INSW has product tankers, too. However, its crude fleet is larger than those of DHT, NAT, and ECO. The goal is to estimate how the companies allocate capital, measuring total debt/total capital and ROTC.
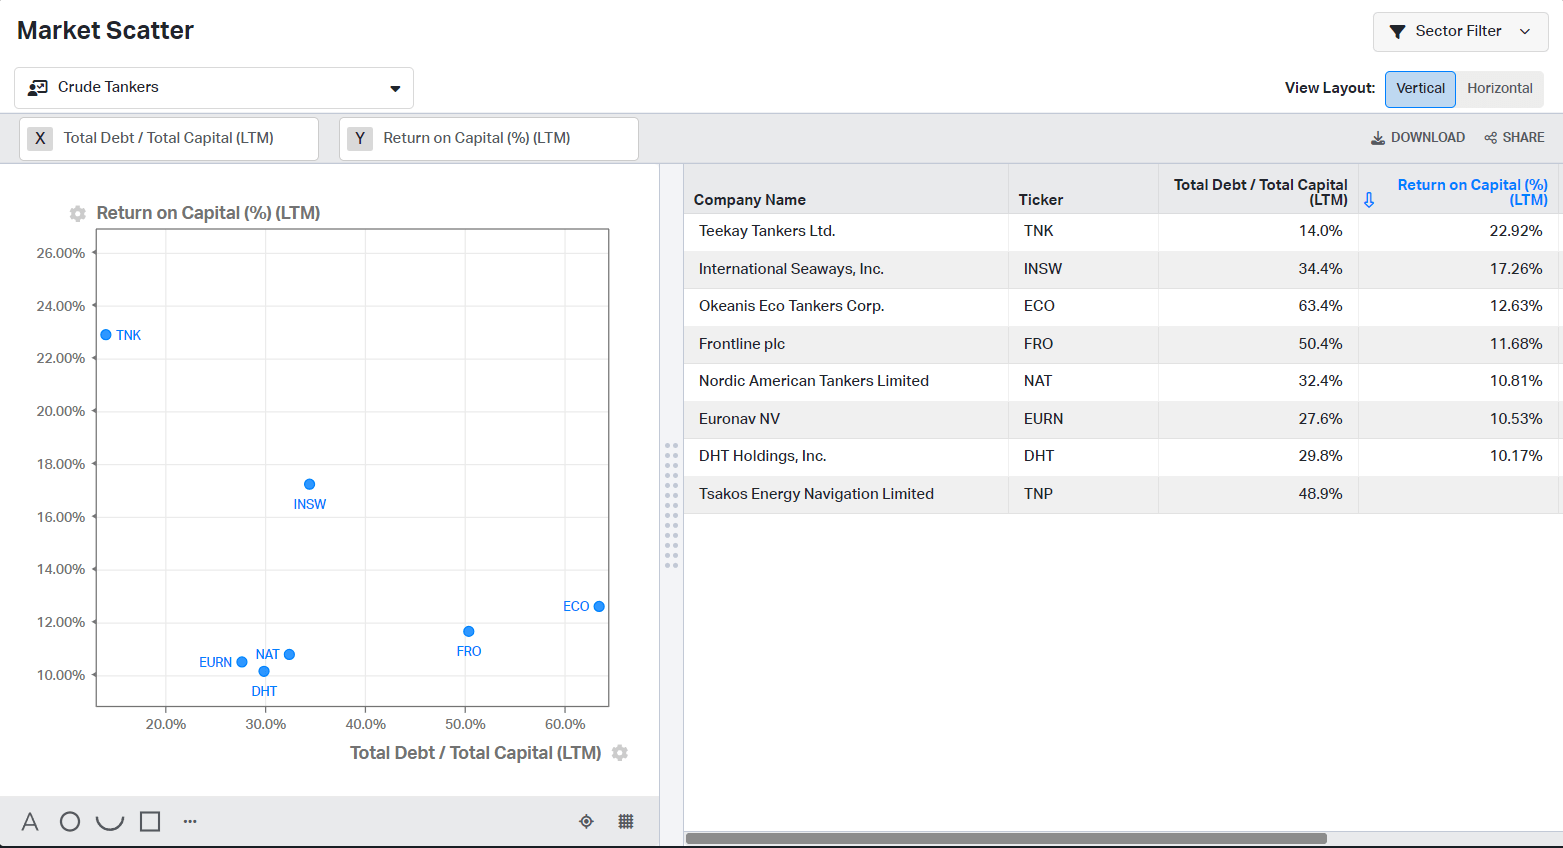
Koyfin
NAT and DHT score best compared to the ECO and the larger companies. However, we must consider ECO’s new fleet and its impact on the company’s capital structure. In general, NAT, DHT, and ECO management teams are doing a great job allocating capital.
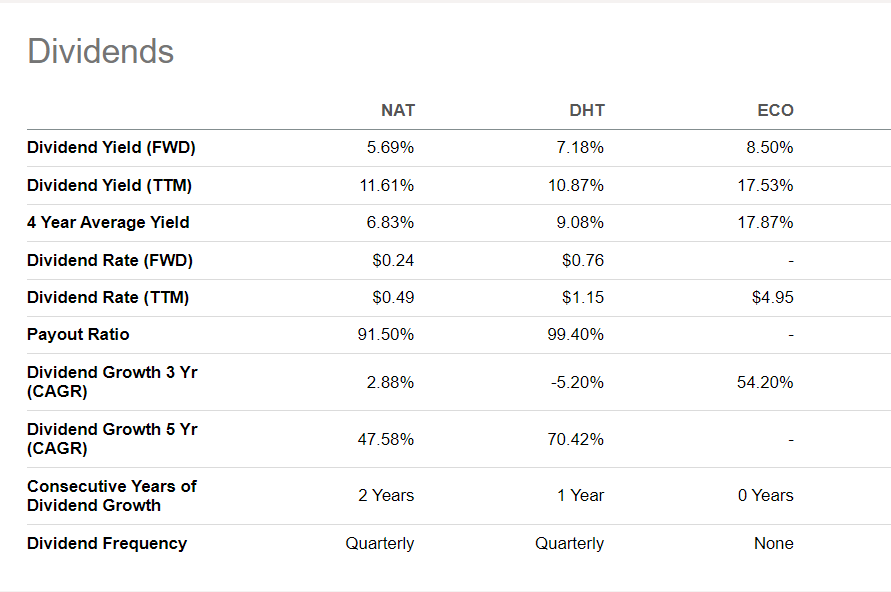
NAT touts itself as a dividend company, and it is deserved. The company has paid dividends for more than 100 consecutive quarters. TTM dividend yield is 11.61%. It is slightly higher than DHT’s 10.87% yield but lower than ECO’s 17.53%.
Seeking Alpha
In 3Q23, the company announced a $0.06 dividend per share. It will be the 105th quarter of consecutive dividends.
To value the NAT fleet, I used Fearnley's regular report. The quoted prices are for five- and ten-year-old vessels. Given NAT`s fleet's older age, I use 5% annual depreciation to estimate the price of a 12.6-year-old Suezmax.
The list below shows my price estimates:
Inputs for the NAV equation are:
NAT's market capitalization is $858 million, while its net asset value is $969 million. Hence, NAT trades at 88% P/NAV. For reference, ECO trades at 129% P/NAV and DHT at 103%.
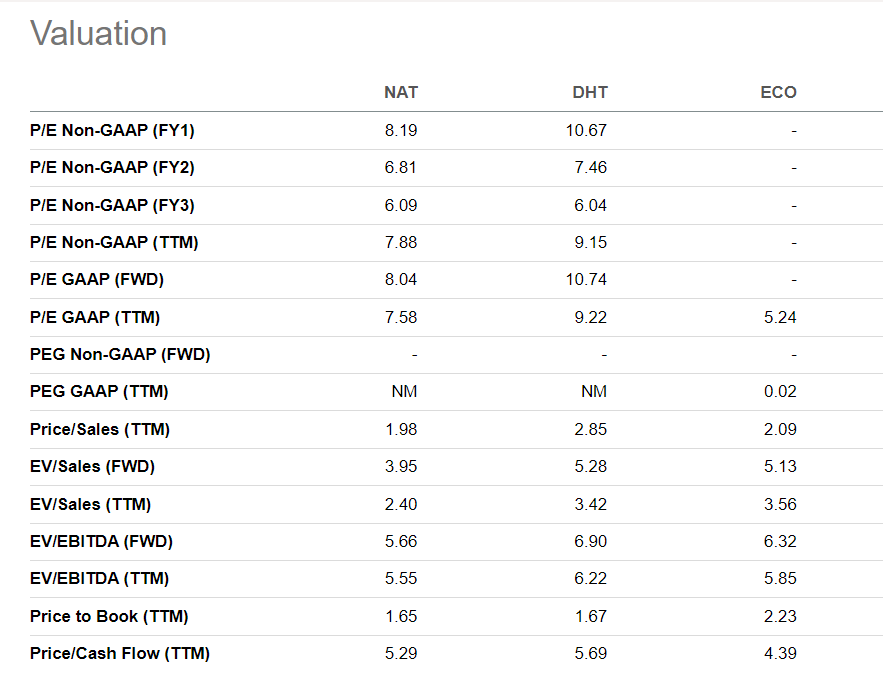
The picture is similar when looking at EV/Sales, EV/EBITDA, and P/B multiples.
Seeking Alpha
NAT is the cheapest in the peer group with 2.40 EV/Sales, 5.55 EV/EBITDA, and 1.65 P/BV compared to the group. ECO is the most expensive, with 3.56 EV/Sales, 2.23 P/BV, though DHT has the highest EV/EBITDA.
NAT is a Suezmax pure-play bet. Compared to its direct competitors, ECO and DHT, NAT’s relatively old fleet is a drawback. On the other hand, NAT has a robust balance sheet and adequate liquidity, so it can afford to update its fleet. Being focused on only one vessel size is an advantage during the upward phase of the cycle and a disadvantage during the downward phase. I believe we are in the middle of the cycle, defined by growing demand and limited supply. Adding the spark – a Red Sea crisis, the scenario with higher TCE rates for longer is plausible. Suezmax and Aframax owners directly benefit from the crisis.
The most pronounced risk for crude oil tankers is a decline in Suezmax demand. Although such a scenario is probable, I remain doubtful about it. The Middle East crisis gets more complicated day by day. The Houthis keep attacking vessels crossing Bab al-Mandab. There is no resolution on the horizon, at least for now. “Prosperity Guardian” operation faces expected challenges. Yemeni rebels are highly skilled in asymmetric warfare against more advanced armies. For reference, Yemeni government forces and the Saudi Arabian military both failed to appease the Houthis. I expect the Middle East crisis will not be resolved in the coming few months; thus, the Red Sea will remain out of the supply chains for a while.
The company’s solid balance sheet has enough liquidity and a prudent capital structure. The company’s margins are lower than its direct competitors, ECO and DHT. NAT offers dividends with an attractive yield of 11.61%. The dividend is linked to the net operating cash flow. The latter represents net income plus depreciation. NAT trades at 88% P/NAV, 2.40 EV/Sales, and 5.55 EV/EBITDA. It is the cheapest in its peer group. NAT is an attractive proposition with its Suezmax-only fleet, robust financials, and attractive dividend yields. I give NAT a buy rating.