Leaven Partners Second Quarter 2023 Letter To Partners
Summary
- Leaven Partners is a hedge fund management firm based in Michigan. The firm utilizes a deep value investing approach.
- In the second quarter of 2023, fund assets appreciated by 4.3%.
- The stock market is overvalued and extremely bifurcated.
TERADAT SANTIVIVUT
Q2 2023 | YTD | 1 Year | 3 Year | Inception† | |
Leaven Partners, LP* | 4.3% | 6.0% | 4.9% | 30.2% | 26.4% |
S&P 500 (SPXTR) | 8.7% | 16.8% | 18.5% | 52.8% | 76.6% |
MSCI EAFE (EFA) | 3.2% | 12.4% | 17.9% | 29.7% | 21.3% |
Vanguard Total World (VT) | 6.0% | 13.6% | 15.3% | 38.8% | 43.5% |
*Leaven Partners, LP are time-weighted gross cumulative returns (unaudited) provided by our prime broker, Interactive Brokers. Performance data, (net of all fees and expenses), for each partner, is provided by Liccar Fund Services. †Trading began on March 16, 2018.
Dear Partners,
In the second quarter of 2023, fund assets appreciated by 4.3%. For the three-year period at quarter-end, the fund is up 30.2%[1] compared to the S&P 500 return of 52.8%.
Return Contribution
Hedge Strategy: | -3.0% |
Core Holdings: | 4.5% |
FX Strategy: | 2.8% |
For the quarter, our core holdings contributed 4.5% to total returns - the bulk of which came from our Japanese holdings which contributed 3.2% in the quarter. Our foreign currency strategy also made a positive contribution to quarterly returns, which was primarily the result of our short position on the Yen as it depreciated relative to the Investment Terms and Service Providers dollar from ¥132, near the start of the quarter, to ¥144. We also benefited from the positive carry on the trade.2 Our overall gains were reduced by our hedge strategy which negatively contributed to fund performance.
Investment Terms and Service Providers
Investment Structure: | Michigan LP |
Management Fee: | 0% |
Performance Fee: | 25% over 6% hurdle |
High Water Mark: | Yes |
Initial Lockup Period: | 3-year |
Minimum Investment: | $50,000 |
Auditor: | Summit LLC |
Prime Broker: | Interactive Brokers, LLC |
Custodian: | Interactive Brokers, LLC |
Fund Administrator: | Liccar Fund Services |
Legal Counsel: | Cott Law Group, PC |
As of now, the tactics I implemented - to deal with what I consider to be highly inflated asset prices - have been a weight rather than a buoy. Our overall results would have been better, (but still not as good as this bull market), had I just sat on my hands.
However, I believe the die has not yet been cast on my hedge strategy and that we need a few more quarters before I may need to plead mea culpa. Although there appear to be no signs of trouble on the horizon, there are reasons for concern, in my opinion.
First, the bond market is screaming for a recession. Beginning on October 25, 2022, the 3-month Treasury bill had a higher yield than the 10-year Treasury note. In simple parlance, this is called an inverted yield curve[3]. Although this occurrence is not unprecedented, it is relatively rare. We’ve had 8 inversions of this type since 1968. We are now in our ninth inversion. Today, the 3-month Treasury is currently yielding 5.41% and the 10-year Treasury is yielding 3.86%. Regardless of whether the inverted yield curve predicts or causes a recession[4], the seminal work by Campbell Harvey, Director of Research at Research Affiliates, documented the inverted yield curve’s uncanny ability to foretell recessions. Since 1968, this simple model has had an eight-for-eight success rate in forecasting recessions with no false signals.[5] Although the model cannot predict the severity of the recession, remarkably, the duration of the inversion lines up quite closely with the duration of the recession.[6] With 90 days of observed inversion to confirm the signal and 6 to 15 months of lead time, the model predicts a recession by March 2024[7].
Will the inverted yield curve finally make a false prediction? It’s certainly possible. But it’s much too early to pass judgment, in my opinion. One causal effect of an inverted yield curve is the strain it puts on the banking and financial system. We saw last quarter how duration risk can wreak havoc on unprepared banks. Although we may avoid more bank blowups, the net effect should be a tightening in lending due to the inverted yield curve.
Second, the stock market is overvalued and extremely bifurcated. In simple terms, if you didn’t own Facebook (META), Apple (AAPL), Tesla (TSLA), Microsoft (MSFT), Amazon (AMZN), Nvidia (NVDA), and Google (GOOG) (GOOGL), you didn’t go anywhere this year - as these seven mega-caps accounted for 10.5% of the S&P 500’s 16.8% year-to-date return.[8] They account for 27% of the total market capitalization of the S&P 500 - which is extremely top-heavy by historical standards and typically leads to a correction. Surprisingly, their combined operating income declined by -4% year-over-year which is worse than the average S&P 500 earnings growth of +1%.
At the risk of sounding like a broken record, valuations remain in bubble territory, with global value spreads above the 94th percentile.[9] Interestingly, despite some earning declines. Fourth quarter, of 2022, earnings for the S&P 500 declined by -3.2%. We narrowly missed an earnings recession in the first quarter, of 2023, when year-over-year earnings rose by +0.1%. However, analysts had expected earnings to fall by -5.1% in the quarter. This surprise to the upside has gotten the animal spirits going again. Will the party be short-lived or are we back to the races with AI leading the pack? Analysts expect earnings for S&P 500 companies to fall -5.6% in the second quarter from a year ago, according to IBES data from Refinitiv, as earnings season kicks off as I write.
When looking at leading indicators, there are signs aplenty that things are slowing down. The bond market says to get ready, while the stock market thinks it’s a head fake. Given the extreme signaling in both markets, I think it is wise to proceed with caution.
Investors are beginning to take note of the opportunities available in Japan. The TOPIX is up 19% for the year, the iShares MSCI Japan Value ETF (EWJV) is up 15%, and the Nikkei 225 is up 26%. The flow of funds from international investors is improving as global investors have net-bought ¥7.2 trillion (US $50 billion) this year, after years of net outflows. However, our Japanese holdings are up, on average, only 13% for the year. One would think that foreign investors would be looking for really good bargains - like the stocks we own. Unfortunately, that has not been the case, so far.
Part of the problem is accessing cheap stocks. With over 1,500 of the 3,300 stocks on the Tokyo Stock Exchange trading below book value, one would think picking up a basket of stocks trading below book value would be a simple exercise. But it’s not that easy for institutional and retail investors. For example, as retail products go, one of the better options for value exposure is the iShares MSCI Japan Value ETF (EWJV). However, this ETF is primarily large-cap stocks with less than half of the holdings trading below book value.[10]
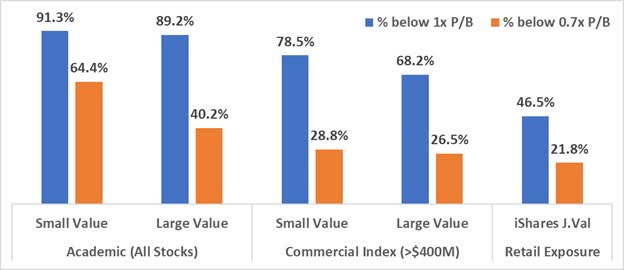
Source: Verdad Advisers, Compustat. All listed stocks in each market >$25M in market cap. Excludes REITS and Financials. “Commercial Index” excludes all stocks below $400M in market cap. iShares MSCI Japan Value (EWJV) holdings from company website as of 5 June 2023. For each factor portfolio, breakpoints of market median for size and P/B used to split portfolios.
In our fund, 100% of our Japanese holdings trade below 70% (0.7x) of book value.
The significance of owning companies trading below book value is that it puts us in the cross hairs of policy, recently championed by the Tokyo Stock Exchange, aimed at improving the capital efficiency of Japanese companies - and more directly, those trading below book value as they constitute the most inefficient capital allocators (by definition).
Although the flow of funds has followed the path of least resistance so far, I believe, in time, investors will find their way to the companies that are most directly affected (and benefited) by the capital improvement initiatives. We would stand to benefit significantly under this scenario.
Markets are cyclical. One area where this is most evident is in the biotech industry. Represented by the SPDR S&P Biotech ETF (XBI), the biotech industry is down more than -50% from its highs reached in February 2021. At the time, money was cheap, and private biotech companies leaped at the chance to raise easy money and become publicly traded - as more than 104 biotech companies were listed for an IPO in 2021. Since that time, the fundraising frenzy has dried up along with the easy money under the new financial reality. Left in its wake are numerous busted biotechs - a term coined in that last major biotech blowup in 2007-2009 - that have typically failed to produce meaningful traction (FDA approval) in their research and are running out of money to support their endeavors. Due to the nature of financial markets, going back to the well and raising new money is not an option as another biotech winter has descended. This of course is obvious to everyone, and so the market value of many of these busted biotechs is driven well below their current cash balances under the consensus that the paltry market value is justified due to the expectation that all of the extra money in their coffers will be burned through in short order. However, this is not the only viable outcome. Some of these busted biotechs will (1) negotiate a merger at favorable terms for their existing shareholders, (2) sell their valuable IP to the highest bidder, or (3) waive the white flag and self-liquidate. As a generalist investor without a Ph.D. in biosciences, determining which busted biotechs to buy is not an easy game to play. But knowing my limitations, I like to use the method coined by Warren Buffett, during his partnership days, of coattail investing. In coattail investing, it is much easier to join along with a larger activist investor that has an established position in a busted biotech and let them do the work of extracting value from our investment rather than trying to do the heavy lifting myself.
In September of last year, I built a small position in Metacrine (OTCPK:MTCR) which was being circled by activist investors and had recently received an all-stock merger proposition from Equillium (EQ). In April of 2022, Metacrine laid off 83% of their workforce, following the resignation of their Chief Medical Officer in December 2021, leaving only 6 full-time employees! Metacrine was clearly looking to turn off the lights as their research had not yielded any promising results on new and innovative drugs.[11] The company had its IPO in September 2020 at $14.34 per share, but now the stock was languishing below $0.50 per share. However, at the time, Metacrine had about $37 million in net cash. Equillium was looking to extend its shelf life, as they too were running out of cash but had more promising drugs in their pipeline (with some in clinical trials). Equillium estimated $33 million could be garnered in the deal which would provide operational breathing room for the company into 2024. In fact, they wanted the cash so badly that they were willing to overpay for it - 25% more. The catch was that Equillium wanted to pay with their stock and they, interestingly, put a collar on the deal based on Equillium’s stock price of $2.21 to $2.70. In other words, the amount of Equillium stock Metacrine shareholders would receive was dependent on the closing share price of Equillium shares at the time of the merger. Based on my calculations, a closing share price of $2.21 valued Metacrine at $0.61 per share (on the low end), and a closing price of $2.70 valued the company at $0.75 per share (on the high end). If Equillium's shares traded higher than $2.70 at the time of closing, it would have been an even better deal; if they traded below $2.21, it would have been a worse deal. The merger was based on shareholder approval. I built a small position at $0.45 per share.
In December the deal was set for a vote and because Equillium’s share price had fallen well below $2.21, we voted against the proposed merger along with the other activists in the stock. On December 23rd, Metacrine announced that the merger was terminated due to a lack of shareholder support. With the deal scuttled, Metacrine set about planning for a self-liquidation, and on June 26th we received $0.58 per share - which was on the low side of their previously announced estimates.[12] In 9 months we made about 28% (or 40% annualized) on the deal.
Our success in Satsuma Pharmaceuticals (STSA) was more rewarding, as I luckily built a position[13] in the stock, at an average cost of $0.68 per share, days before Shin Nippon Biomedical Laboratories Ltd (SNBL) (OTCPK:SBLOF) of Japan announced, on April 17th, an offer to buy the remaining shares, (they owned 8% of the company at the time), for $0.91 per share with a CVR[14] on Satsuma’s drug pipeline. The shares spiked above $1.20 on the news, on the possible assumption that the deal may be sweetened before it was all said and done. We exited our position at $1.15 that day.[15] It was our top-performing position in this quarter with a 1.1% contribution to quarterly results.
We also had success in IMARA last year but was not a large holding and did not contribute materially to overall results. As for busted biotechs in our fund today, I currently hold Forte Biosciences (FBRX) in the portfolio at a 1.6% position.
In Closing
I am grateful for your participation in Leaven Partners, and that you have entrusted me to manage your assets. I look forward to reporting to you at our next quarter-end.
In the meantime, if there is anything I can do for you, please do not hesitate to contact me.
Sincerely,
Brent Jackson, CFA
DISCLAIMER
The information contained herein regarding Leaven Partners, LP (the “Fund”) is confidential and proprietary and is intended only for use by the recipient. The information and opinions expressed herein are as of the date appearing in this material only, are not complete, are subject to change without prior notice, and do not contain material information regarding the Fund, including specific information relating to an investment in the Fund and related important risk disclosures. This document is not intended to be, nor should it be construed or used as an offer to sell, or a solicitation of any offer to buy any interests in the Fund. If any offer is made, it shall be pursuant to a definitive Private Offering Memorandum prepared by or on behalf of the Fund which contains detailed information concerning the investment terms and the risks, fees, and expenses associated with an investment in the Fund.
An investment in the Fund is speculative and may involve substantial investment and other risks. Such risks may include, without limitation, risk of adverse or unanticipated market developments, risk of counterparty or issuer default, and risk of illiquidity. The performance results of the Fund can be volatile. No representation is made that the General Partner’s or the Fund’s risk management process or investment objectives will or are likely to be achieved or successful or that the Fund or any investment will make any profit or will not sustain losses.
As with any hedge fund, the past performance of the Fund is no indication of future results. Actual returns for each investor in the Fund may differ due to the timing of investments. The performance information contained herein has not yet been independently audited or verified. While the data contained herein has been prepared from information that Jackson Capital Management GP, LLC, the general partner of the Fund (the “General Partner”), believes to be reliable, the General Partner does not warrant the accuracy or completeness of such information.
[1] This equates to an approximate 9.1% annualized return for the 3-year period.
[2] We also had a small short position on the Singapore Dollar but was immaterial to overall results in the quarter. As I write, we do not hold any short positions on foreign currencies - as our hedge positions in the Yen and Singapore Dollar were covered when they hit our stop orders. Consequently, we are net-long foreign currencies as we hold foreign assets in their native currency.
[3] Inversions can happen anywhere along the yield curve, but for this discussion, we will focus on the academic literature using the 3-month and 10-year. Federal Reserve Chairman, Jerome Powell, has stated he prefers the 3-month near-term forward spread, defined as the 3-month Treasury rate 6 quarters forward vs. the current 3-month yield. Both the 3-month and 10-year and the 3-month near-term forward spread are currently inverted. In either case, using the 2-year and 10-year, as the media likes to cite, is not the best method.
[4] Can an Inverted Yield Curve Cause a Recession?
[5] https://www.researchaffiliates.com/content/dam/ra/publications/pdf/987-odds-of-a-hard-landing.pdf
[7] This is only an estimate, as the full range is May 2023 to November 2025.
[8] Quarterly Letter | Palm Valley Capital
[9] The Bubble Has Not Popped (Dated, but still relevant, in my opinion)
[10] Japan's Value Mandate for Reform - Verdad
[11] Metacrine specializes in the treatment of NASH (non-alcoholic steatohepatitis, a liver disease characterized by excess liver fat, inflammation, and fibrosis). There are currently no approved treatments for NASH. They were developing two candidates: MET409 and MET642. Both failed to deliver.
[12] We may get a few more cents per share from their contingency fund once all is said and done.
[13] % of AUM
[14] The term contingent value right (CVR) refers to a right often granted to shareholders of a company facing restructuring or a buyout. These rights ensure that the shareholders get certain benefits if a specific event occurs, usually within a specified time frame.
[15] The deal ended up closing on June 8th at $0.91 per share.
Editor's Note: The summary bullets for this article were chosen by Seeking Alpha editors.
Editor's Note: This article discusses one or more securities that do not trade on a major U.S. exchange. Please be aware of the risks associated with these stocks.