
Chonlatee Sangsawang
Chonlatee Sangsawang
2024 is off to a pretty good start, the SPDR S&P 500 ETF Trust (SPY) has posted positive returns during each of the first two months. The gain in February of 5.22% was much more impressive than the 1.59% gain in January. Year-to-date the ETF is up 6.89% and on pace for a pretty strong first quarter. Vanguard High Dividend Yield ETF (VYM) is moving in the same direction this year, however not as such an impressive pace. VYM posted a decent gain of 2.62% in February and is up 3.39% year-to-date. My watchlist is not off to a great start this year, February looked better as the chosen 10 stocks returned a gain of 1.76%, but year-to-date it is only up 0.18%.
The watchlist's main purpose is to present me with investment ideas for further review. The process used to compile the watchlist focuses on identifying the highest quality stocks with an attractive valuation, and an emphasis on a good starting dividend yield. I track the overall performance of the watchlist to give me an idea of what type of return the stock screening process can deliver. The return is measured against SPY and VYM for a baseline of alternative investment approaches. The goal is also for the watchlist to deliver a long-term CAGR of 12%. Thus far the watchlist is exceeding this goal with a CAGR of 14.78% after 40 months.
The main purpose of a high dividend yield portfolio is not to outperform the broad market, but to generate a passive income stream that is relatively safe, reliable, and one that can grow in the future. The top 10 stocks on my watchlist for March 2024, collectively, offer a 3.62% dividend yield that is more than double the dividend yield of the S&P 500. These 10 stocks have also grown their dividends at a historical rate of 10.28% per year during the last five years. Collectively, all 10 stocks appear to be potentially about 28% undervalued right now based on dividend yield theory.
The best way to create a strong high-yield dividend portfolio is with a buy-and-hold strategy. This strategy forces you to think about the stocks you decide to invest your capital into, as the plan is to hold the positions indefinitely. Applying this approach over the long term while focusing on potentially undervalued stocks allows investors to generate alpha through capital appreciation. While this may not pan out for every position, diversifying your high-yield portfolio across 20 or more unique stocks will increase the odds of picking up shares of certain stocks when they are trading for bargain prices. The beauty of a long-term outlook is time; you can sit back and wait for the valuation to revert to historical norms, all the while collecting a generous passive income stream.
Creating the high-yield watchlist, I had four areas of interest that I focused on: basic criteria, safety, quality, and stability. First off, the basic criterion aims to narrow down the list of stocks to those that pay a dividend, offer a yield above 2.75%, and trade on the NYSE and NASDAQ. The next set of criteria focuses on safety because that is a crucial part of a high-yield investing strategy. The filter excludes companies with payout ratios above 100% and companies with negative 5-year dividend growth rates. Another level of safety can be associated with larger companies; therefore, the watchlist narrows in on stocks with a market cap of at least $10 billion. The next set of criteria set out to narrow down the list to include higher-quality businesses.
The three filters for quality are: a wide or narrow Morningstar moat, a standard or exemplary Morningstar stewardship, and an S&P quality rating of B+ or higher. A Morningstar moat rating represents the company's sustainable competitive advantage, the main difference between a wide and narrow moat is the duration that Morningstar expects that advantage to last. Companies with a wide moat are expected to maintain their advantage for the next 20 years, whereas companies with a narrow moat are expected to maintain their advantage for the next 10 years. The Morningstar stewardship evaluates the management team of a company with respect to shareholders' capital.
The S&P quality rating evaluates a company's earnings and dividend history. A rating of B+ or higher is associated with above-average businesses. The last set of criteria focuses on the stability of a company's top-line and bottom-line growth. The filter eliminates companies with negative 5-year revenue or earnings per share growth rate. I believe a company that is growing both their top line and bottom line has the ability to provide growth to its investors in the future.
All of the stocks that pass the initial screener criteria (37 this month) are then ranked based on quality and valuation. Further, I sort the stocks in descending order based on the best combination of quality and value and select the top 10 stocks that are forecasted to have at least a 12% annual long-term return.
Here is the watchlist for March 2024. There are four changes from the prior month: Bank of New York Mellon (BK), CRH plc (CRH), EOG Resources (EOG) WEC Energy (WEC) dropped out and are replaced by Air Products and Chemicals (APD), Comcast (CMCSA), Hershey (HSY) and Royal Bank of Canada (RY). The data shown in the image below is as of 2/29/24.
Created by Author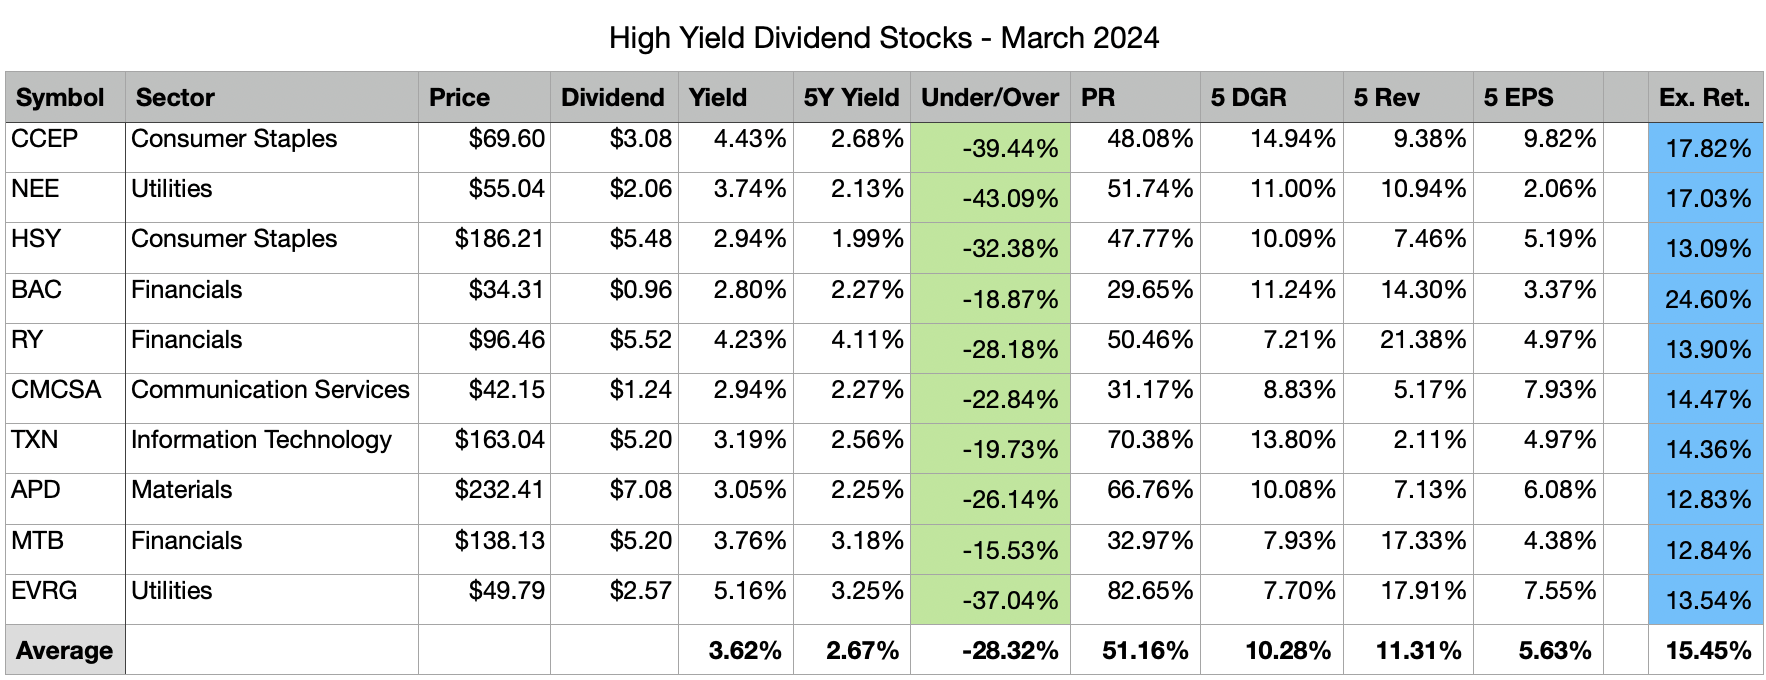
All of the selected stocks this month appear to be potentially undervalued based on dividend yield theory.
The expected rate of return shown in the last column is computed by taking the current dividend yield plus a return to fair value over the next 5 years and a discounted long-term earnings forecast.
Please keep in mind that my return forecasts are based on assumptions and should be viewed as such. I am not expecting that these 10 companies will hit the forecasted returns. What I do expect is that these 10 companies have the potential to offer better returns during the next 5 years compared to the 32 high-yield stocks that passed my initial filters but ranked worse in quality and valuation.
Although the return of the top 10 stocks for February was much nicer than January, it has thus far underperformed both SPY and VYM in both months this year. Perhaps this is a little reversion back to the mean, considering that based on a trailing 3-month return the watchlist is in line with SPY and still ahead of VYM. Since inception, which was 40 months ago, the watchlist has an annualized return of 14.78%, placing it 0.51% behind of VYM and 1.10% behind SPY.
I do not expect that this watchlist will beat VYM or SPY every month. However, I believe that a buy-and-hold investing approach leveraging the stocks presented on this watchlist will generate long-term alpha compared to the broad market. I also have a personal target rate of return of 12% that I believe will be attained by this watchlist when measured over long periods of time. Thus far the watchlist is performing adequately and remains ahead of target.
Date | Top 10 List | ALL | VYM | SPY |
1 month | 1.76% | 0.96% | 2.62% | 5.22% |
3 month | 11.72% | 7.46% | 9.20% | 11.78% |
6 month | 12.81% | 7.72% | 9.03% | 13.68% |
YTD | 0.18% | 0.11% | 3.39% | 6.89% |
2020 | 16.44% | 16.44% | 16.09% | 14.99% |
2021 | 26.31% | 27.91% | 26.21% | 28.76% |
2022 | -11.95% | -4.25% | -0.45% | -18.16% |
2023 | 22.07% | 9.56% | 6.58% | 26.18% |
2024 | 0.18% | 0.11% | 3.39% | 6.89% |
Since Inception | 58.35% | 56.41% | 60.71% | 63.44% |
Annualized | 14.78% | 14.36% | 15.30% | 15.88% |
Individual watchlist returns for February 2024 were:
Top 5 performing past and present watchlist stocks in February 2024:
Top 5 Stocks by total return since joining the watchlist:
Top 5 Stocks by Average Monthly return since joining the watchlist:
In total, there have been 83 unique high-yield dividend stocks that have appeared in the top 10 list during the past 40 months. Out of these 83 unique stocks, 62 have a positive total return since first appearing on the top 10 list. The average total return for these 62 stocks is 40.23%. The average loss for the 21 stocks that have negative total returns is -15.33%. Here are all 83 stocks, their total return since inception, and the number of months since they first appeared in the top 10 list.
Symbol | Since Inception | Count |
AVGO | 207.59% | 34 |
PFG | 132.25% | 40 |
GD | 124.64% | 40 |
PGR | 123.90% | 37 |
JPM | 107.96% | 40 |
MRK | 94.88% | 34 |
BK | 79.13% | 40 |
BMO | 74.62% | 40 |
FDX | 72.36% | 17 |
TD | 55.57% | 40 |
RY | 54.30% | 40 |
PAYX | 52.11% | 37 |
FAST | 49.94% | 13 |
MTB | 49.91% | 40 |
CSCO | 48.57% | 40 |
CM | 48.52% | 40 |
EPD | 46.63% | 31 |
HBAN | 45.52% | 40 |
CVS | 44.80% | 40 |
HD | 44.43% | 20 |
AMGN | 40.90% | 40 |
SNA | 40.35% | 25 |
CMI | 39.03% | 24 |
STT | 38.68% | 40 |
PEP | 36.76% | 40 |
CRH | 36.52% | 3 |
BLK | 36.52% | 22 |
DFS | 35.89% | 6 |
BNS | 35.42% | 40 |
LMT | 34.74% | 40 |
SO | 34.65% | 40 |
SRE | 34.02% | 36 |
ATO | 32.43% | 27 |
QSR | 31.88% | 30 |
SWKS | 27.84% | 17 |
DRI | 27.33% | 31 |
PM | 25.61% | 36 |
OKE | 25.23% | 11 |
PXD | 25.13% | 12 |
CMCSA | 23.72% | 18 |
USB | 23.19% | 40 |
GS | 22.95% | 9 |
TRP | 22.80% | 40 |
RCI | 20.49% | 40 |
DLR | 18.19% | 24 |
CMS | 16.25% | 36 |
NTRS | 15.91% | 40 |
GIS | 15.52% | 31 |
TXN | 14.82% | 20 |
K | 14.65% | 36 |
DTE | 14.57% | 40 |
VZ | 12.16% | 15 |
CPB | 10.41% | 29 |
BAC | 10.40% | 7 |
MDT | 10.03% | 15 |
BX | 8.78% | 23 |
INTC | 7.79% | 40 |
EOG | 6.45% | 12 |
CCEP | 2.84% | 2 |
KMB | 2.10% | 37 |
UL | 1.71% | 12 |
EVRG | 1.68% | 40 |
XOM | -1.25% | 11 |
CLX | -1.26% | 30 |
GLW | -1.55% | 12 |
XEL | -1.73% | 36 |
TFC | -1.96% | 40 |
MS | -2.12% | 31 |
PNC | -2.24% | 12 |
AMT | -2.79% | 17 |
LNT | -4.27% | 40 |
WEC | -5.10% | 38 |
WTRG | -6.07% | 2 |
BEN | -10.14% | 26 |
BBY | -12.59% | 26 |
NEE | -15.93% | 6 |
TROW | -20.04% | 25 |
CMA | -22.09% | 35 |
UPS | -24.06% | 24 |
HAS | -31.52% | 40 |
MMM | -32.63% | 40 |
PARA | -57.70% | 40 |
AAP | -64.92% | 24 |
Here's a closer look at the new stocks this month: Air Products and Chemicals, Comcast, Hershey and the Royal Bank of Canada.
Let's start with the 7-year dividend yield theory chart for APD.
Created by Author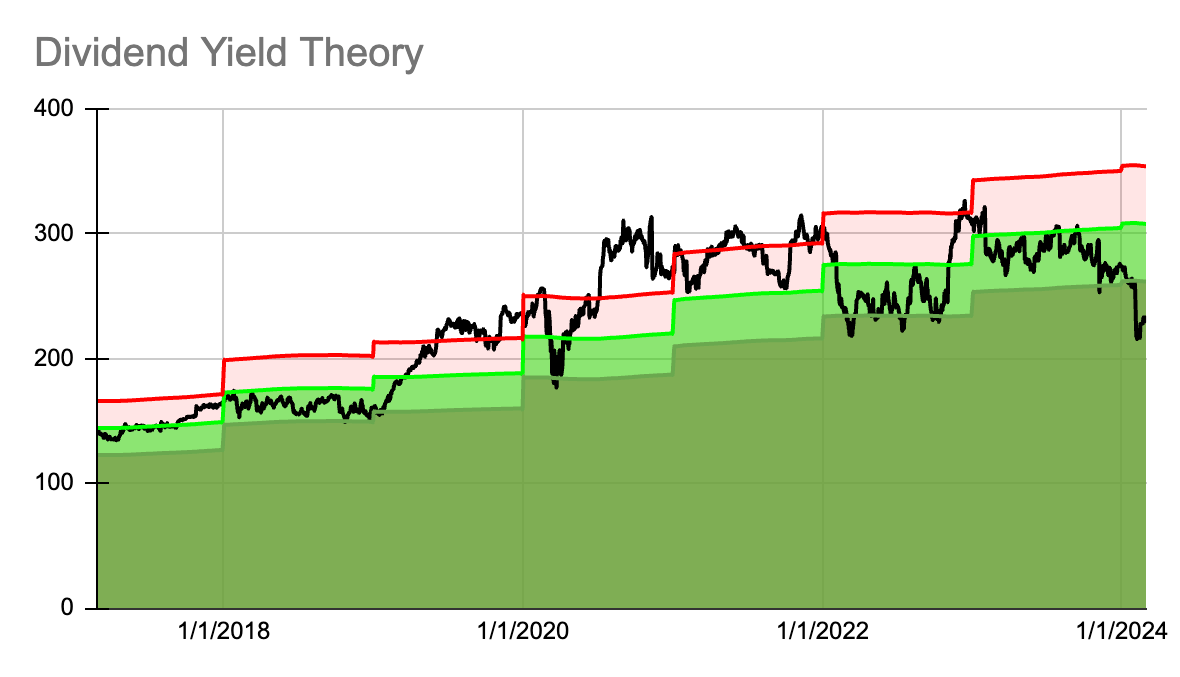
Here is the historical dividend yield.
Created by Author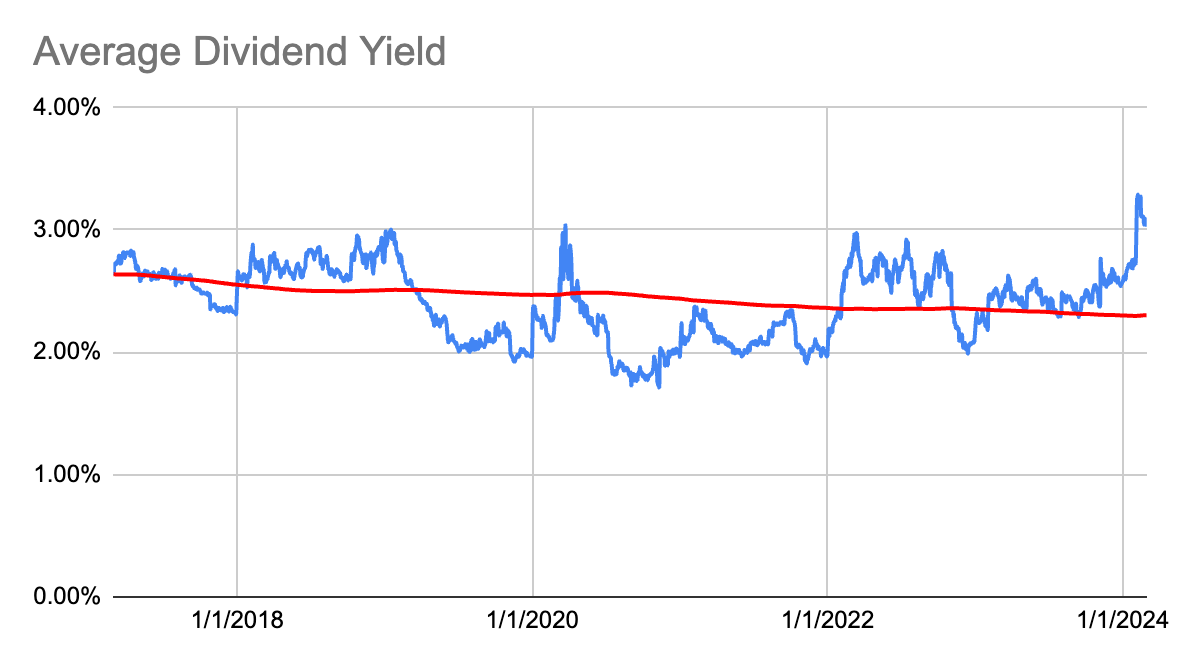
And its dividend growth history.
| Year | Dividend | Growth | CAGR |
| 2024 | 7.08 | 1.14% | |
| 2023 | 7.00 | 8.02% | 1.14% |
| 2022 | 6.48 | 8.00% | 4.53% |
| 2021 | 6.00 | 11.94% | 5.67% |
| 2020 | 5.36 | 15.52% | 7.21% |
| 2019 | 4.64 | 5.45% | 8.82% |
| 2018 | 4.40 | 15.79% | 8.25% |
| 2017 | 3.80 | 14.80% | 9.30% |
| 2016 | 3.31 | 10.51% | 9.97% |
| 2015 | 3.00 | 5.19% | 10.03% |
| 2014 | 2.85 | 8.45% | 9.54% |
| 2013 | 2.63 | 10.94% | 9.44% |
| 2012 | 2.37 | 9.56% |
Here is the 7-year dividend yield theory chart for CMCSA.
Created by Author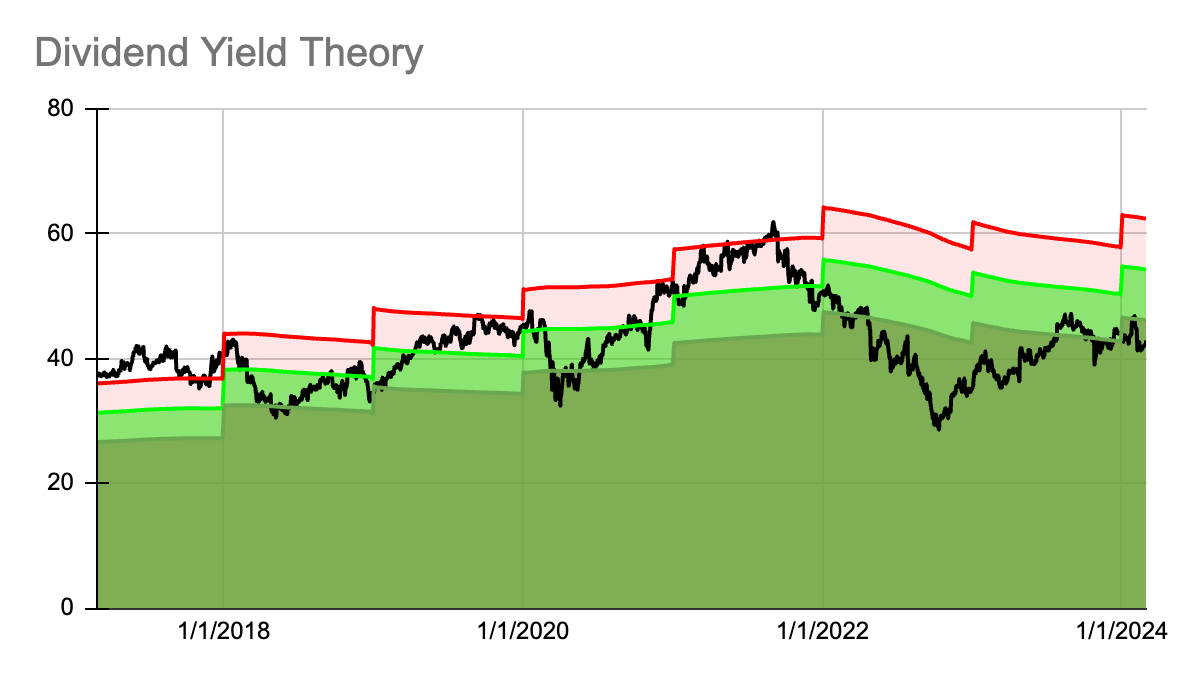
Here is the historical dividend yield.
Created by Author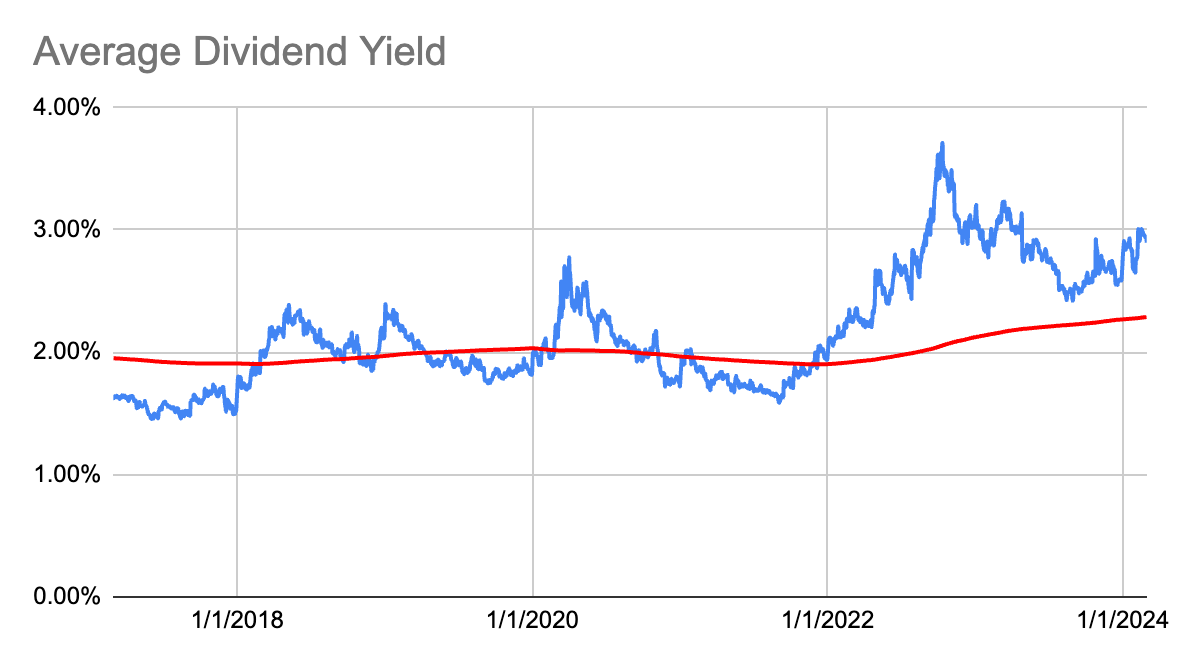
And its dividend growth history.
| Year | Dividend | Growth | CAGR |
| 2024 | 1.24 | 8.77% | |
| 2023 | 1.14 | 7.55% | 8.77% |
| 2022 | 1.06 | 8.16% | 8.16% |
| 2021 | 0.98 | 8.89% | 8.16% |
| 2020 | 0.90 | 9.76% | 8.34% |
| 2019 | 0.82 | 12.71% | 8.62% |
| 2018 | 0.73 | 19.26% | 9.29% |
| 2017 | 0.61 | -7.92% | 10.67% |
| 2016 | 0.66 | -8.62% | 8.15% |
| 2015 | 0.73 | 66.67% | 6.14% |
| 2014 | 0.44 | 16.37% | 11.04% |
| 2013 | 0.37 | 24.52% | 11.52% |
| 2012 | 0.30 | 12.55% |
Here is the 7-year dividend yield theory chart for HSY.
Created by Author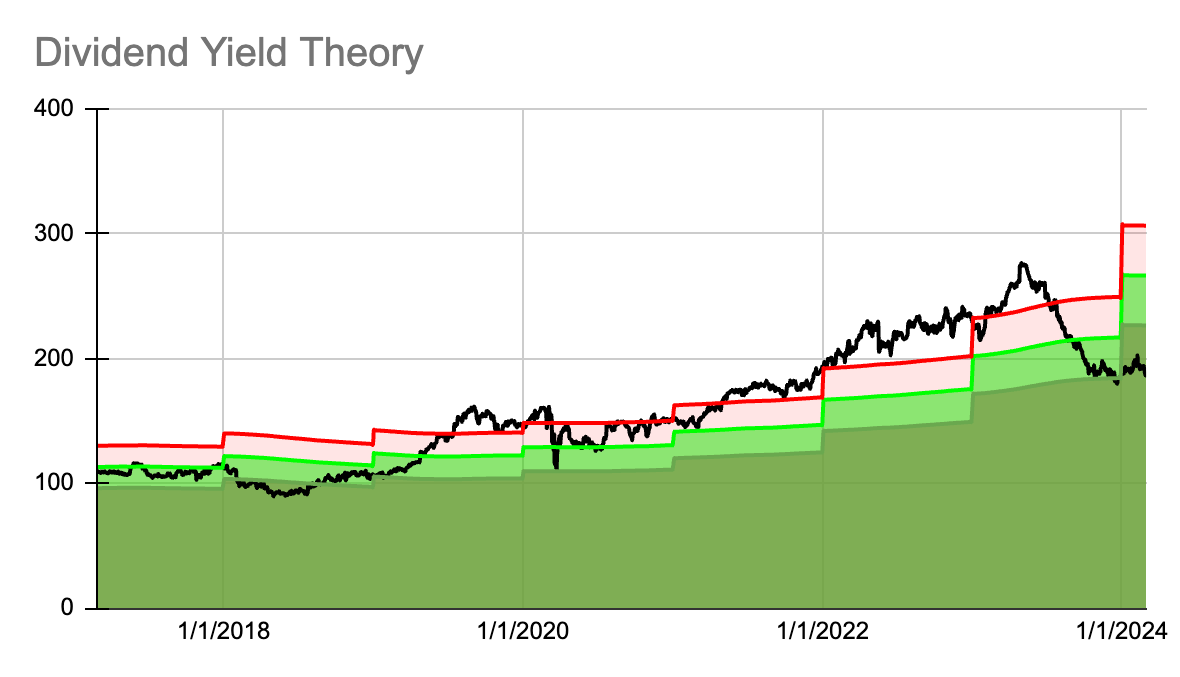
Here is the historical dividend yield.
Created by Author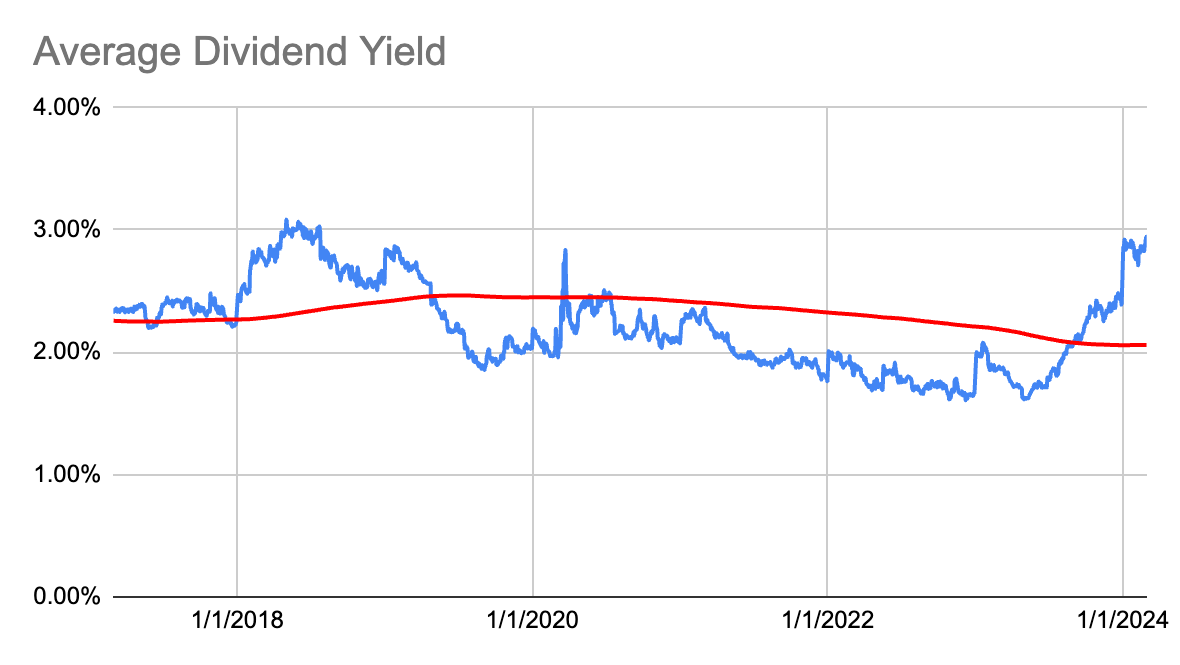
And its dividend growth history.
| Year | Dividend | Growth | CAGR |
| 2024 | 5.48 | 22.98% | |
| 2023 | 4.46 | 15.02% | 22.98% |
| 2022 | 3.87 | 13.61% | 18.94% |
| 2021 | 3.41 | 8.12% | 17.13% |
| 2020 | 3.15 | 5.48% | 14.81% |
| 2019 | 2.99 | 8.49% | 12.88% |
| 2018 | 2.76 | 8.16% | 12.14% |
| 2017 | 2.55 | 6.08% | 11.56% |
| 2016 | 2.40 | 7.42% | 10.86% |
| 2015 | 2.24 | 9.61% | 10.47% |
| 2014 | 2.04 | 12.71% | 10.39% |
| 2013 | 1.81 | 16.03% | 10.60% |
| 2012 | 1.56 | 11.04% |
Here is the 7-year dividend yield theory chart for RY.
Created by Author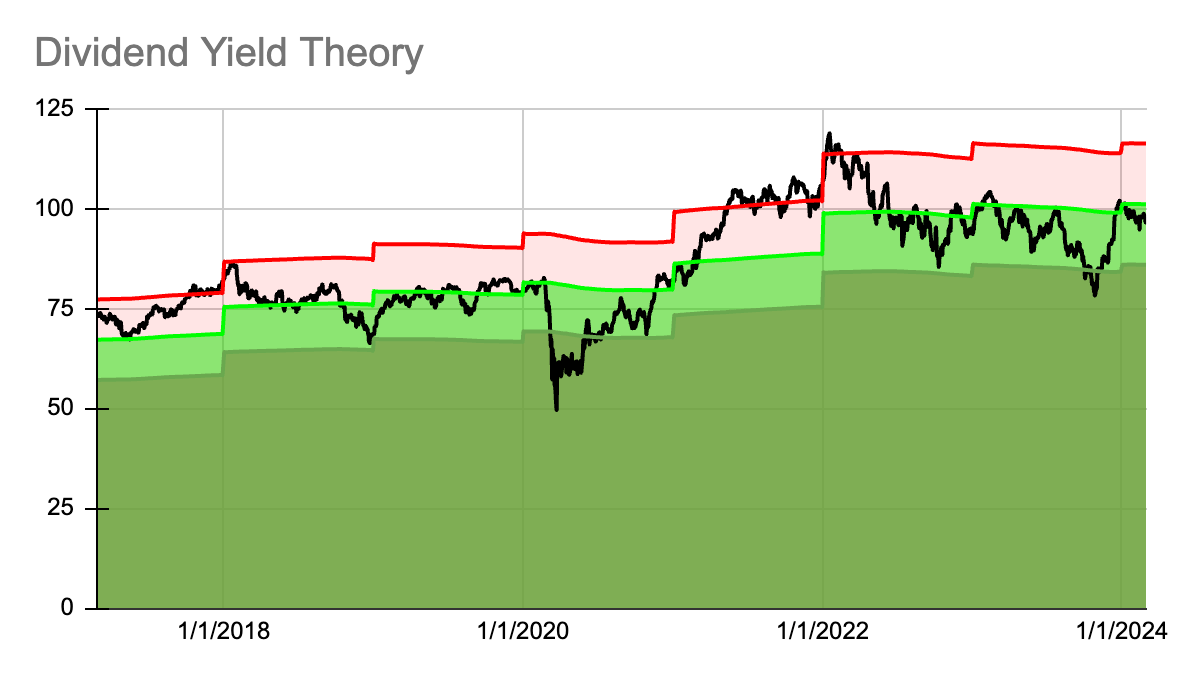
Here is the historical dividend yield.
Created by Author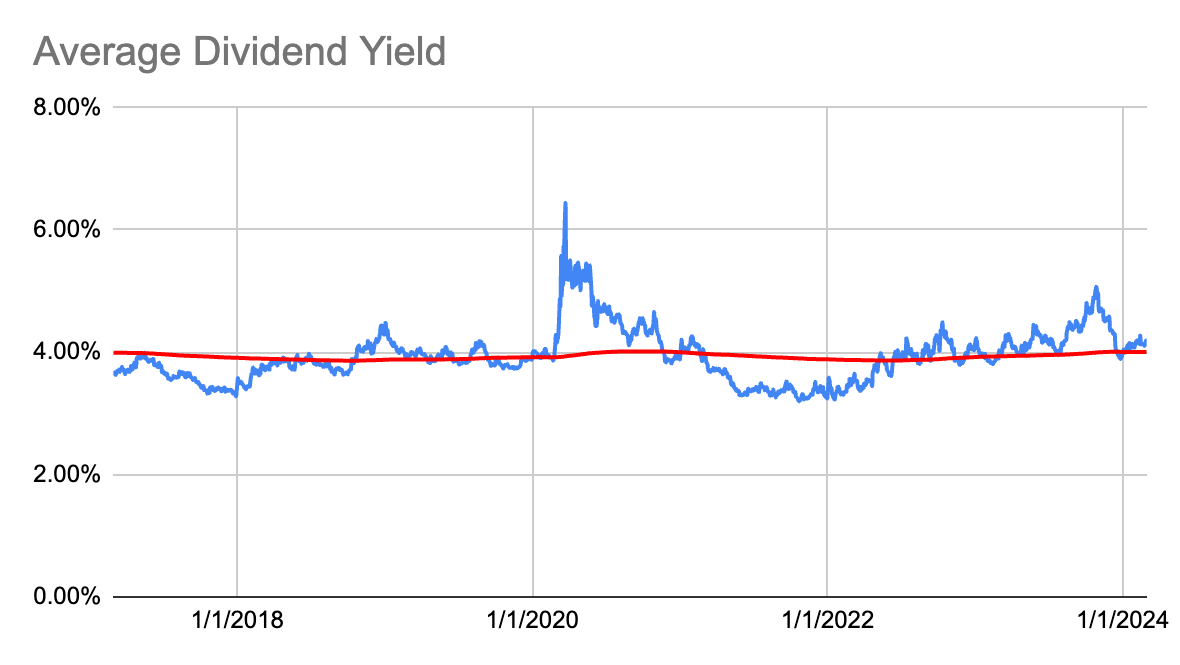
And its dividend growth history.
| Year | Dividend | Growth | CAGR |
| 2024 | 4.04 | 2.06% | |
| 2023 | 3.96 | 3.47% | 2.06% |
| 2022 | 3.83 | 11.23% | 2.76% |
| 2021 | 3.44 | 7.97% | 5.51% |
| 2020 | 3.19 | 3.88% | 6.12% |
| 2019 | 3.07 | 4.37% | 5.67% |
| 2018 | 2.94 | 9.73% | 5.45% |
| 2017 | 2.68 | 10.28% | 6.05% |
| 2016 | 2.43 | 0.02% | 6.57% |
| 2015 | 2.43 | -5.60% | 5.82% |
| 2014 | 2.57 | 3.77% | 4.62% |
| 2013 | 2.48 | 9.28% | 4.54% |
| 2012 | 2.27 | 4.93% |