Sergey_P
Sergey_P
Written by Sam Kovacs
What goes up must come down.
I've never yet seen a man throw a ball so high that it wouldn't come down.
Reversion to the mean is a phenomena which we observe in pretty much everything under the sun, if we step back and look.
The Sahara desert was once lush, hospitable and green (5,000 to 10,000 years ago). As the axis and tilt of the earth changes slowly (a 26,000 year cycle) we might expect the desert to return to a vegetated state. Not in our lifetimes, mind you.
Populations also show cycles and reversion to the mean. The Lynx-Hare populations follow these boom-bust cycles. As hare population grows, the lynx which prey on hare, also grow in number. This in turn causes pressure on hare populations (they're all getting killed) which causes the lynx population to decline as they don't have enough prey to sustain.
Over time there is a reversion to the mean.
The best metaphor for mean reversion, must be Howard Mark's swinging of the pendulum.
While the mean position of the pendulum is bang in the center, it swings far to the left, overshooting, then comes back to the middle before overshooting to the right.
Of course, it is a cycle which we see repeatedly in the stock market as a whole, as well as in various industries.
The semiconductor industry is a prime example. It is actually very similar to the Lynx-hare dynamic.
A new technology, such as artificial intelligence, creates a surge of demand for semiconductors across industries. This leads to investments in research and development, infrastructure, and production capacity.
From Lam Research (LRCX)'s latest earnings call:
First is our commitment to R&D, including planned spending increases in calendar year 2024 to extend our differentiation in products and services targeted at next-generation semiconductor device inflections.
[...]
In the December quarter, we secured additional advanced packaging wins for high-bandwidth memory, which is critical for enabling advanced AI servers.
So semiconductor companies all over produces more chips. At some point, they produce more than the market can absorb, pushing the market into overcapacity. This leads to pricing pressure, which is amplified if combined with weaker demand due to economic troubles. The cycle has gone through its boom-bust cycle.
Therefore, when we look at Lam Research's price relative to its dividend yield (which we use to derive when it was historically undervalued/overvalued) it feels like we've seen this cycle play-out time and time again throughout the past decade.
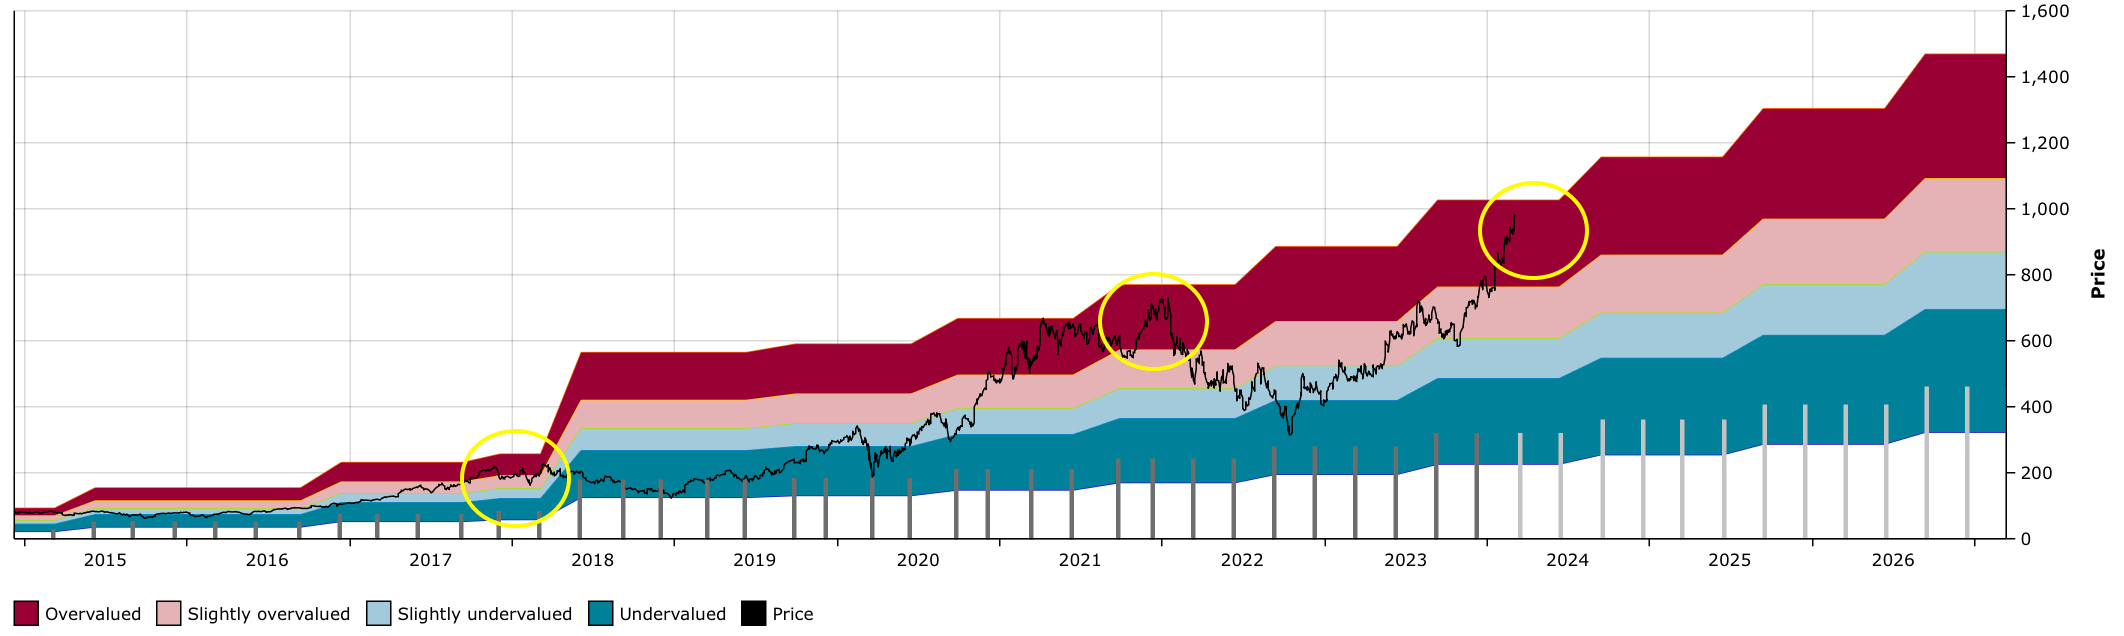
LRCX DFT Chart (Dividend Freedom Tribe)
Of course, unlike a pendulum clock, it is impossible to know ahead of time how far the pendulum will swing before reverting to the mean.
However, a conservative investor will take gains off the table progressively as stocks get expensive, knowing that they cannot know when the top is, but that if he doesn't at least attempt to sell when it's high, they will miss the top all together.
It's the same when you buy right? You will never know for sure that you are at the bottom, but you will buy when it's "low enough".
Hence our investing motto, "buy low, sell high, get paid to wait".
We're in the business of investing in value, and converting that value into higher dividend payments.
What do we mean by we convert value into dividends?
I always give the same example to express this idea. Say you buy a stock when it trades at $100 and it yields 4%. You get $4 in dividends per year.
Now say that stock is remotely related to AI, so the price doubles, but the dividend stays the same. The stock now trades at $200 and yields 2%. You'll receive $4 in dividends per year.
Sure you could pat yourself on your back and say that your yield on cost is 4%, or you could realize that your current yield is 2%, and just around the corner there is another stock which trades at $100 and yields 4%.
You can sell stock A for $200, and buy two shares of stock B for $100. You're now getting $8 in dividends per year.
A couple clicks on your computer screen, and you double your income.
It's not magic, it's converting value into dividends.
You buy low, you get paid dividends to wait, you sell high.
We have dozens of examples of this, but one which is quite current and relevant given the AI theme, is IBM (IBM).
In April 2020, when we said that it was "finally a good time to buy" IBM, we were counting on a reversion to the mean.
Of course, we had our reasons to count on it, but still, it wasn't obvious that after 6 years of the price going down, down, down, it would be a good time to buy.
One of our readers didn't buy it. His comment:
Correction: it is NEVER a good time to buy IBM
Why did we buy IBM, then?
The 5.3% yield at the time made it worthwhile for us to wait. (for more on this read this recent article of ours).
And 4 years later, the pendulum has swung.
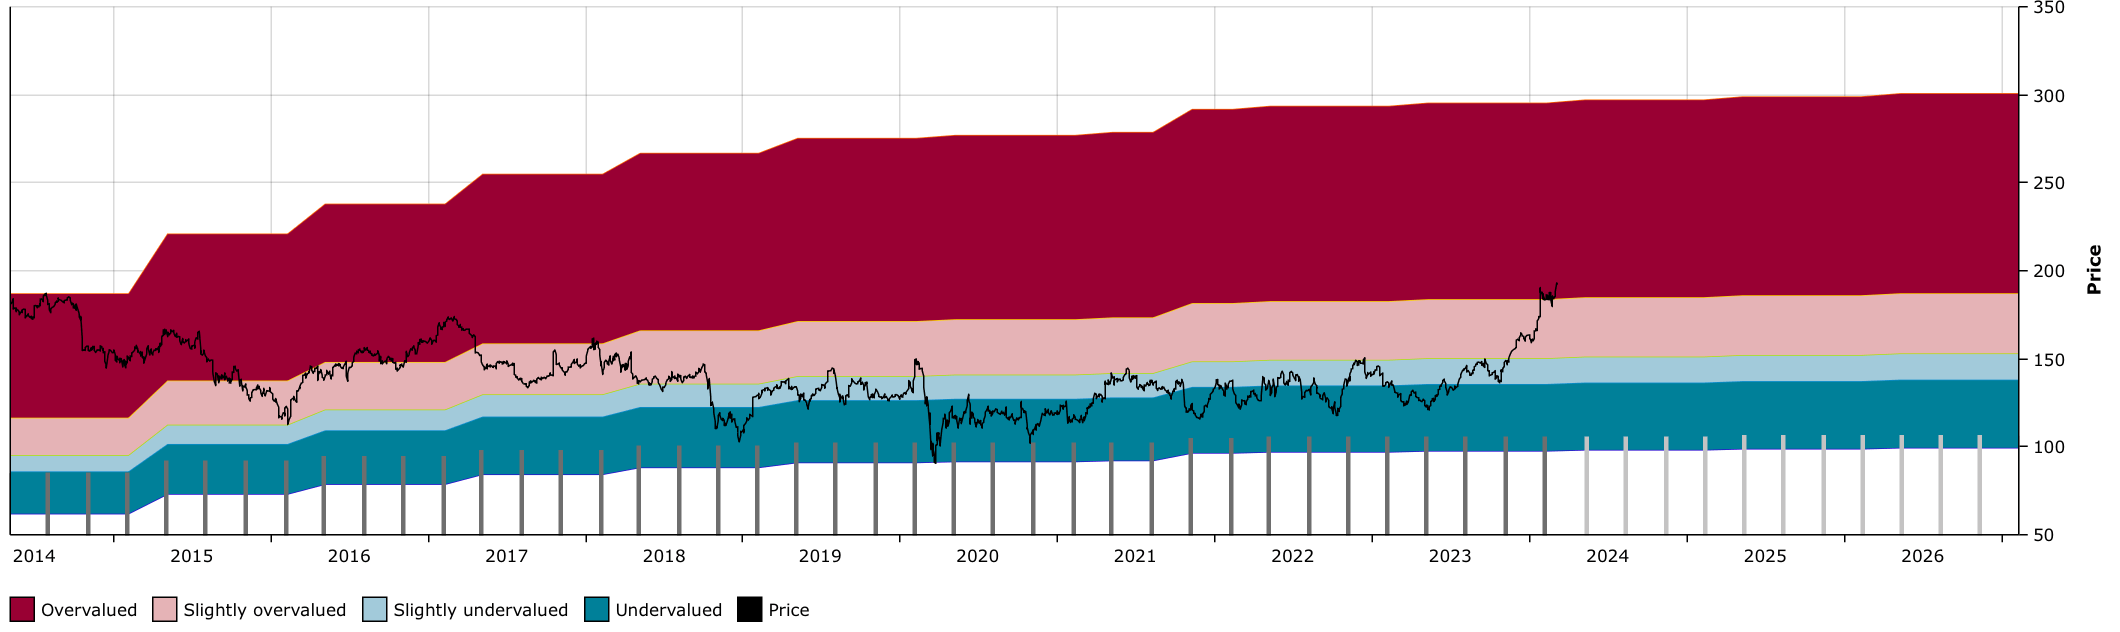
IBM DFT chart (Dividend Freedom Tribe)
IBM yields 3.45%. We have started taking gains in our IBM position, because we believe that we can redeploy those funds, thus harvesting the value we realized, and converting it into more dividends.
We're simply not too interested about a 3.4% yield growing at 0.5% to 2% per year.
It's an elegant system. It's a system that works. It's a system which keeps you honest, and allows you to avoid saying "if only I sell when it was at that price".
If you like the system, that's already two overvalued stocks covered, here's a third, then we'll give some replacement buys.
The latest data on market share of grocers in the US dates from 2022. It shows that Walmart (WMT) and Costco (COST) are by far the largest in the country.
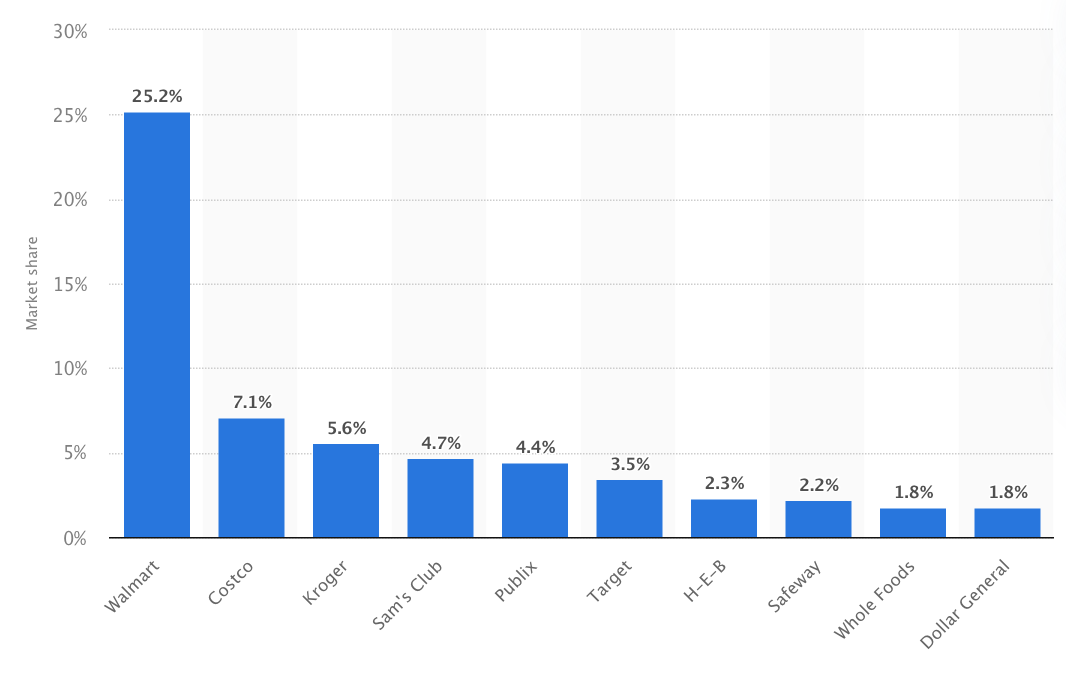
Statista
The buy in bulk, no thrills, low margin high volume model has worked great for Costco, which had doubled its sales over the past decade.
Their membership cards have 92.8% renewal rates, which obviously means they have a very loyal base of customers.
it's a good business, sure, but is it really something worth overpaying for?
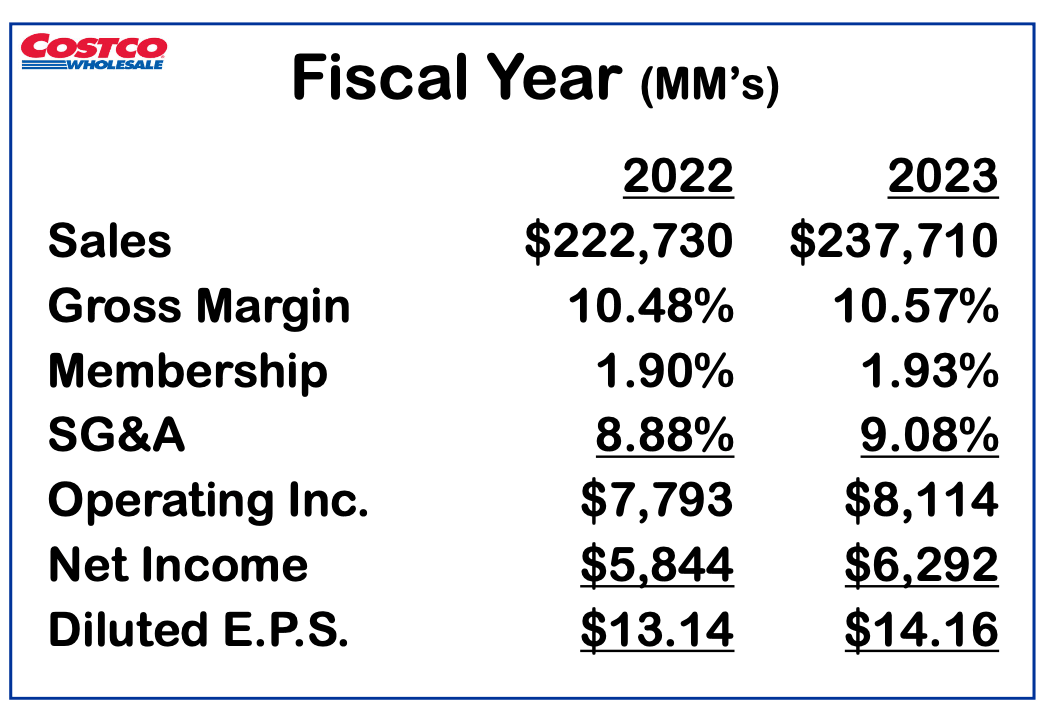
COST Investor Presentation
Revenue increased by 6.7% in 2023, earnings by 7.7%.
The rate of growth is slowly declining as Costco gets bigger and bigger. No doubt, maintaining a high percentage growth rate means that the nominal growth is exponential. As a company gets bigger, it gets tougher to keep growing.
Now what follows will be mainly for dividend investors, but even if you were not a dividend investor, how could you truly justify paying 50x earnings for what is effectively, a retailer?
To put it in context, say your kids have a lemonade stand they operate on the weekends which nets $100 per week (smart kids) or about $5,000 per year.
If your kids said they were going to sell the lemonade stand for $250,000 (50x earnings) how likely do you think they are to find a buyer?
Even if your kids told me they were going to open lemonade stands all across China, I wouldn't bank on finding a buyer at that price.
But right now, that's where the market sees Costco.
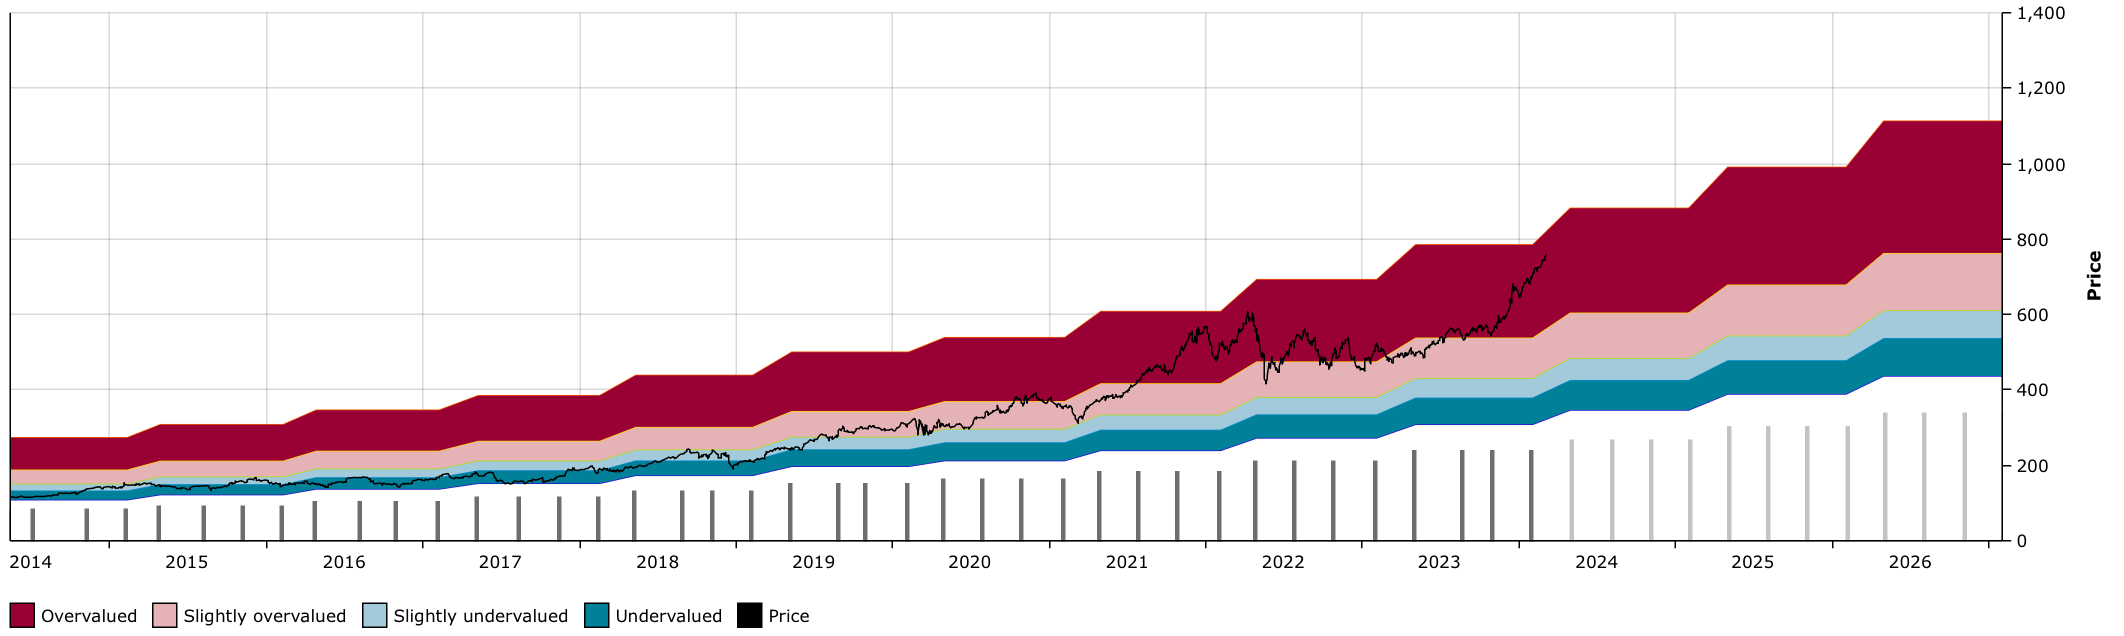
COST DFT Chart (Dividend Freedom Tribe)
Relative to its dividend, it's as expensive as it's ever been in the past decade. You're getting just a 0.5% yield. Looking at the chart above, you'd think this is an anomaly for Costco.
In the past decade, yes. Back in late 2004, Costco was just as overvalued.
Buying then would have left you with a 0% return 5 years later.
You wouldn't even have been paid anything significant to wait.
Neither are you getting paid anything of the sorts now.
One recent article on Seeking Alpha was titled "Costco, don't overpay for greatness".
I agree, you should let somebody else overpay for greatness, and sell them your shares.
On October 26th we highlighted Morgan Stanley (MS) as one of the top 15 All Weather dividend stocks for members of our investing group, the Dividend Freedom Tribe.
Since then the stock has appreciated by 26%, slightly outpacing the S&P 500.
What is particularly interesting though, is the bout of performance MS had in the last couple of weeks of December, a period when the market was starting to price rate cuts as a done deal.
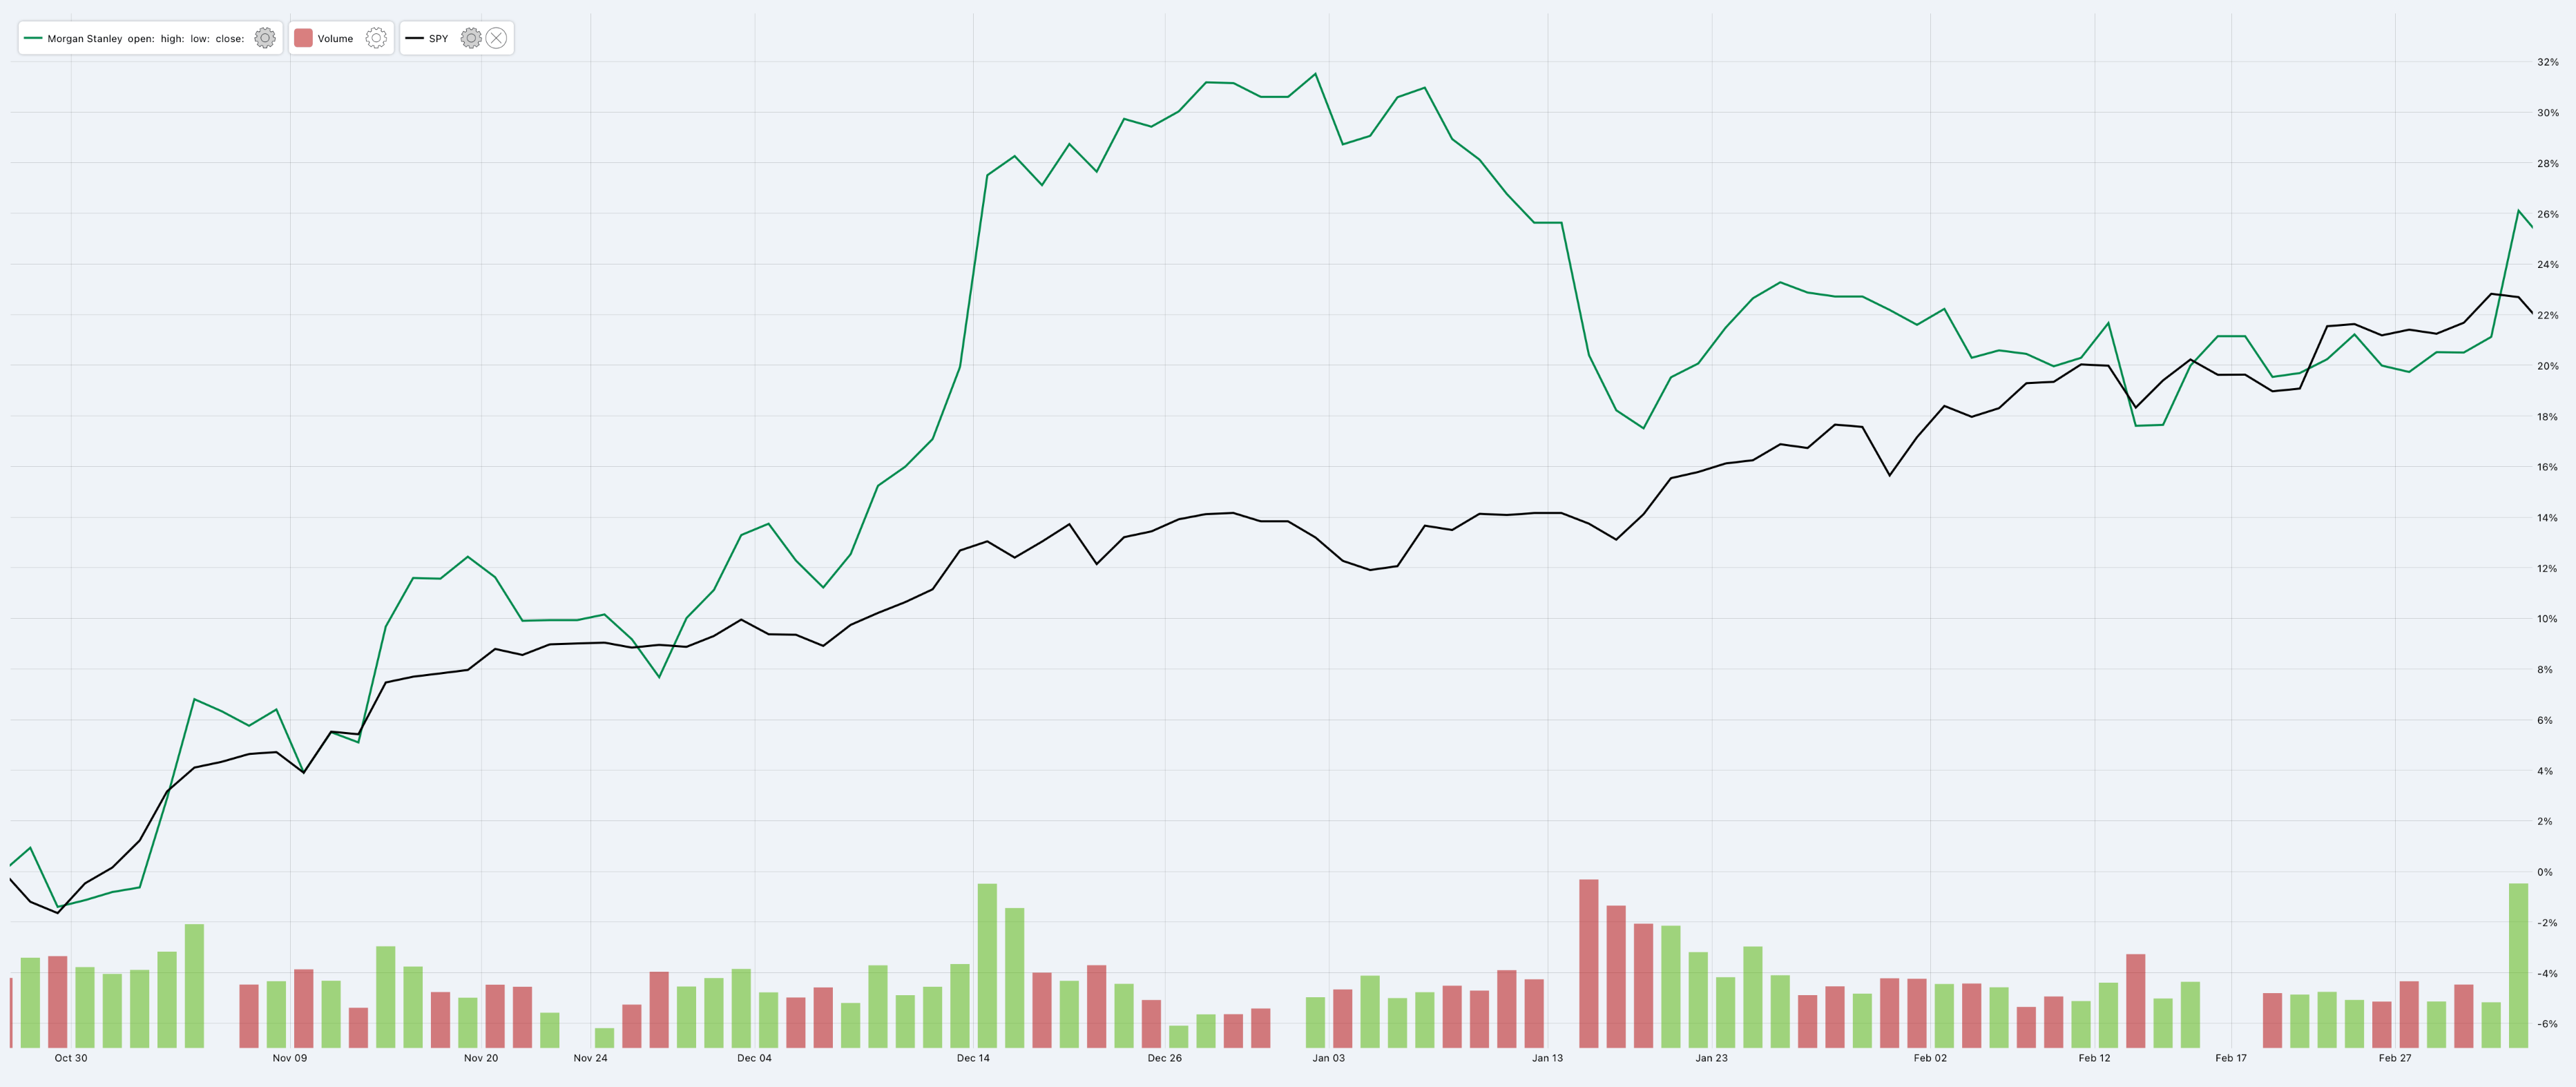
MS vs SPY (Dividend Freedom Tribe)
As far as I'm concerned, rate cuts are a done deal, May or June, it's coming.
And this might just be the swing in the pendulum required for MS to bounce back after a couple years of sluggish stock performance.
A Jefferies analyst recently rerated MS a buy highlighting the wealth management opportunity:
MS is moving past deal integration and toward cross-firm connectivity with a focus on the large WM opportunity already embedded in its existing client base and more collaboration across its three business segments
And yes, wealth management has been the growth engine for MS.
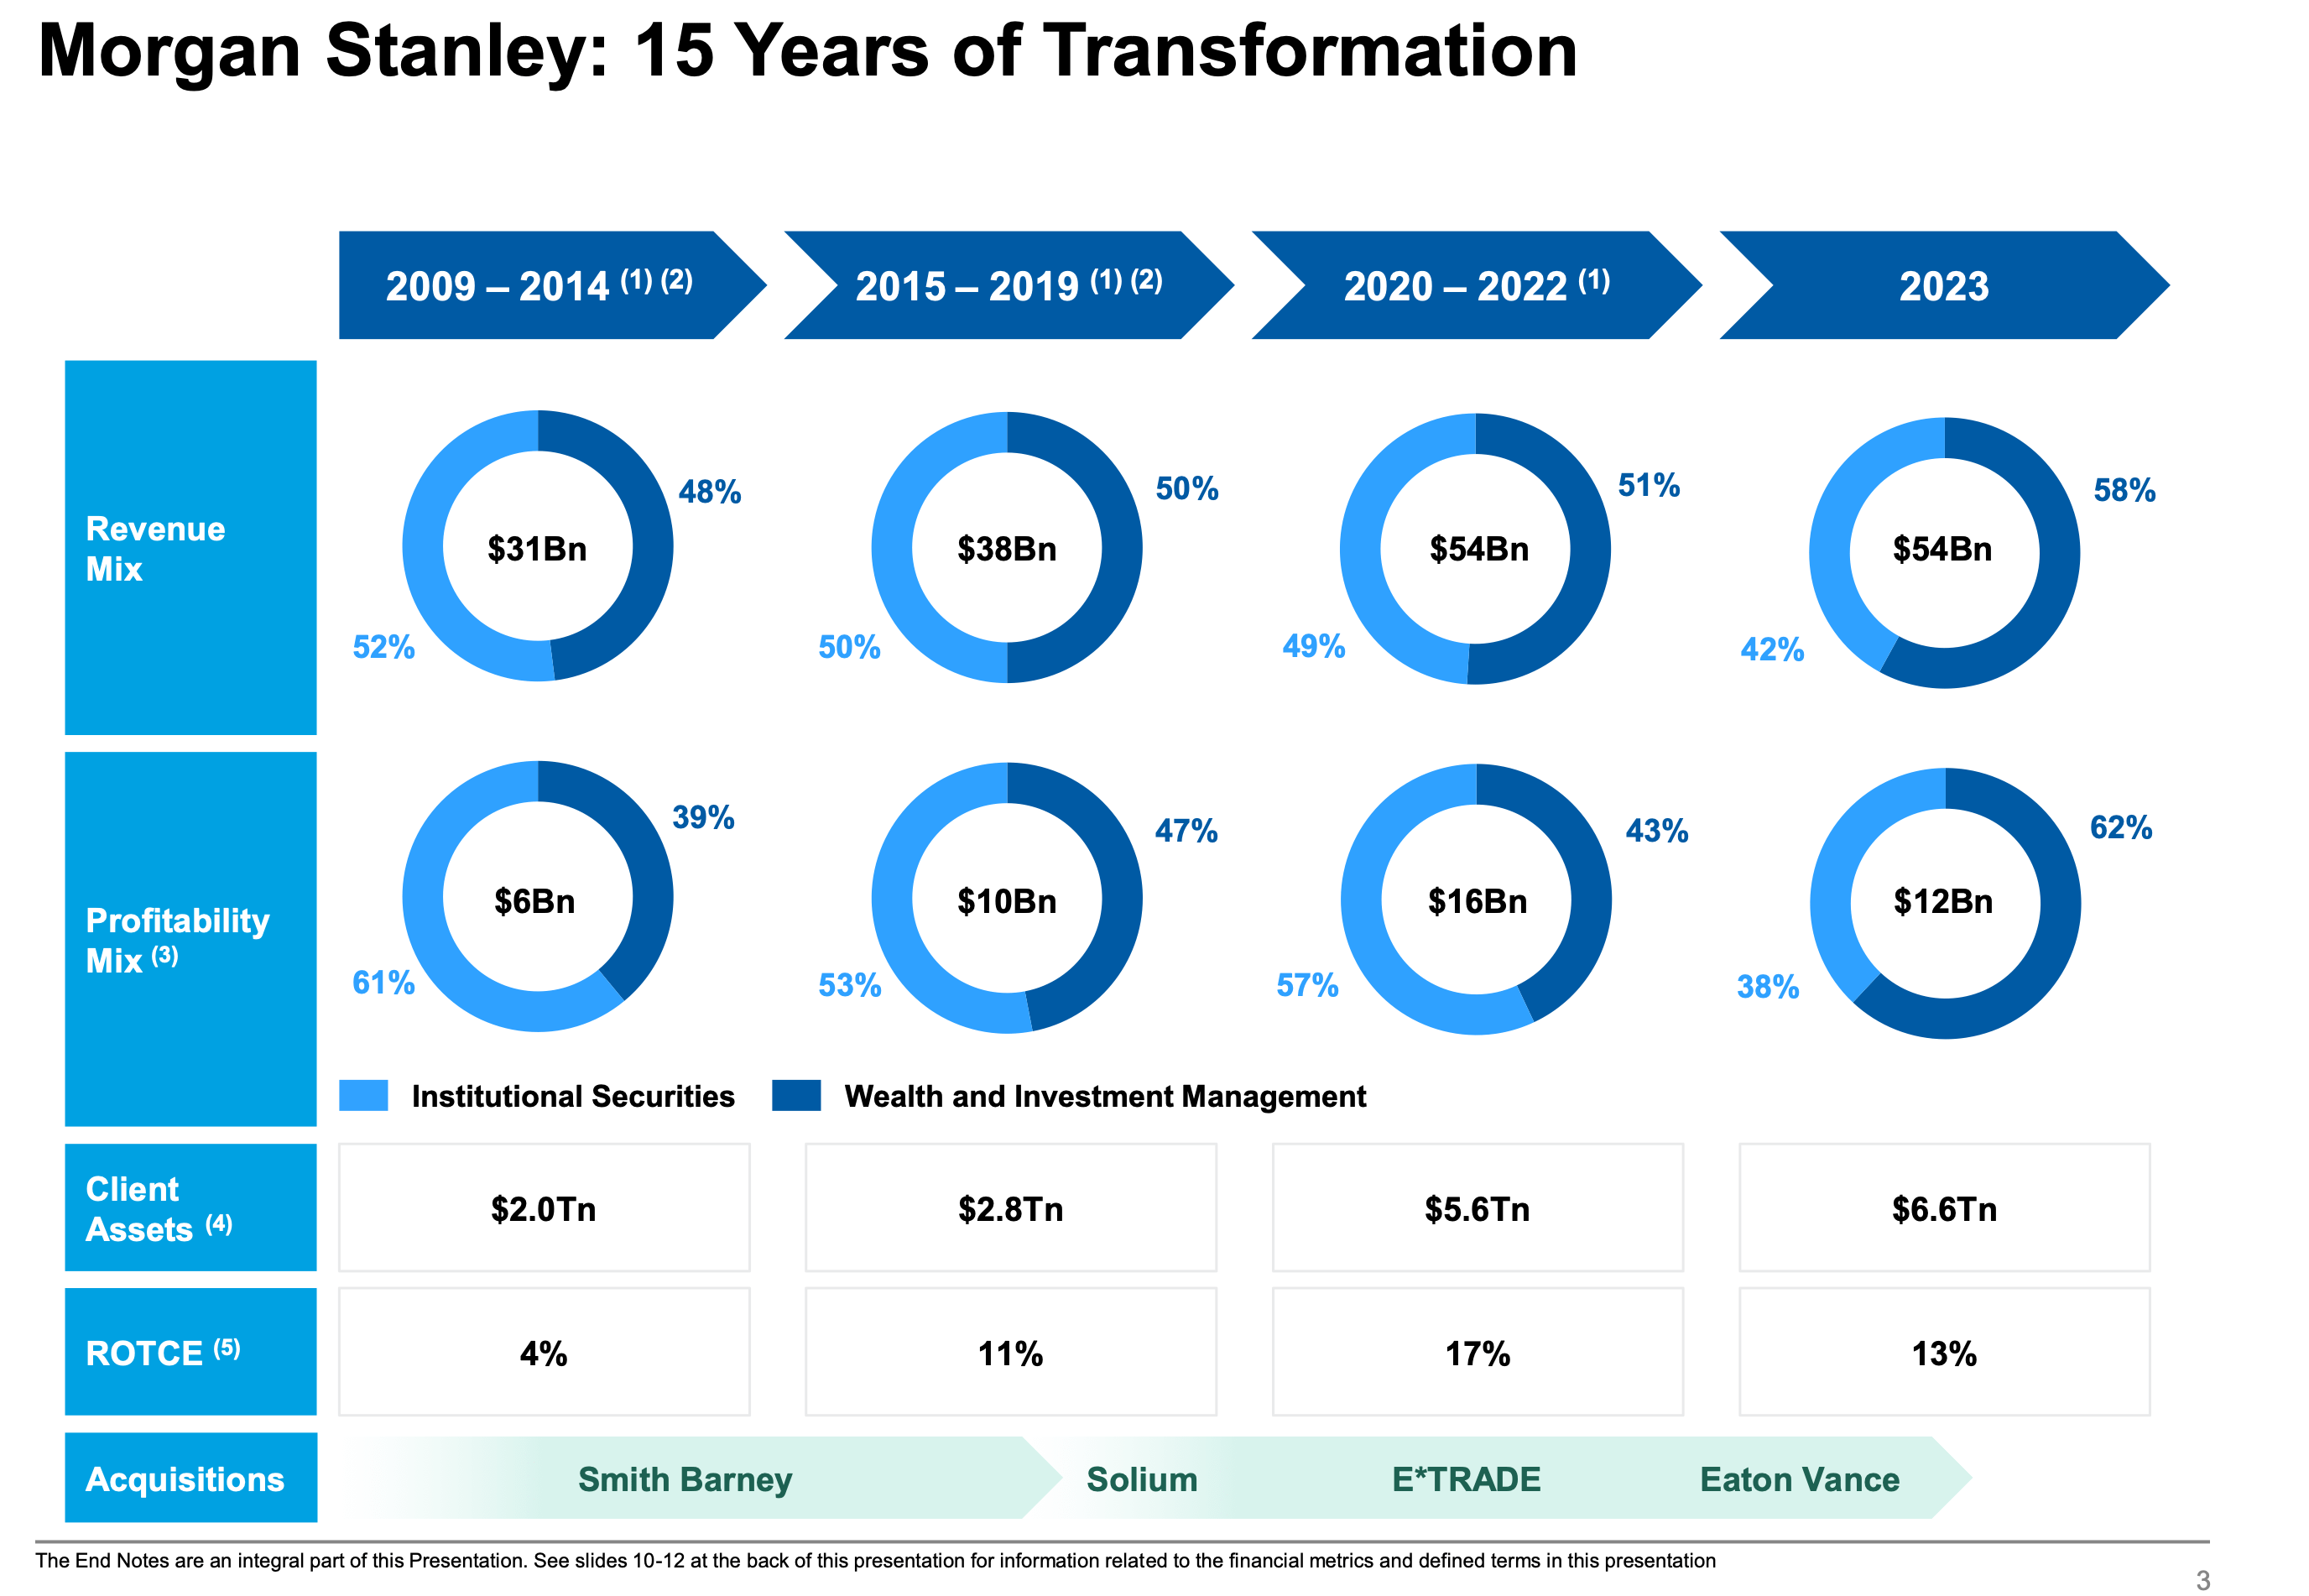
In fact, the key to understanding MS and its value proposition is to see how it has transformed over the past decade from a mainly banking firm to a wealth and investment management one.
During the period client assets have grown from $2tn to $6tn.
MS Investor Presentation
And MS sees a plan to move forward and reach lofty goals of $10tn in assets, 30% margins and 20% ROTCE.
What's more is that they recognize that both wealth management, and investment banking are at cyclical lows.
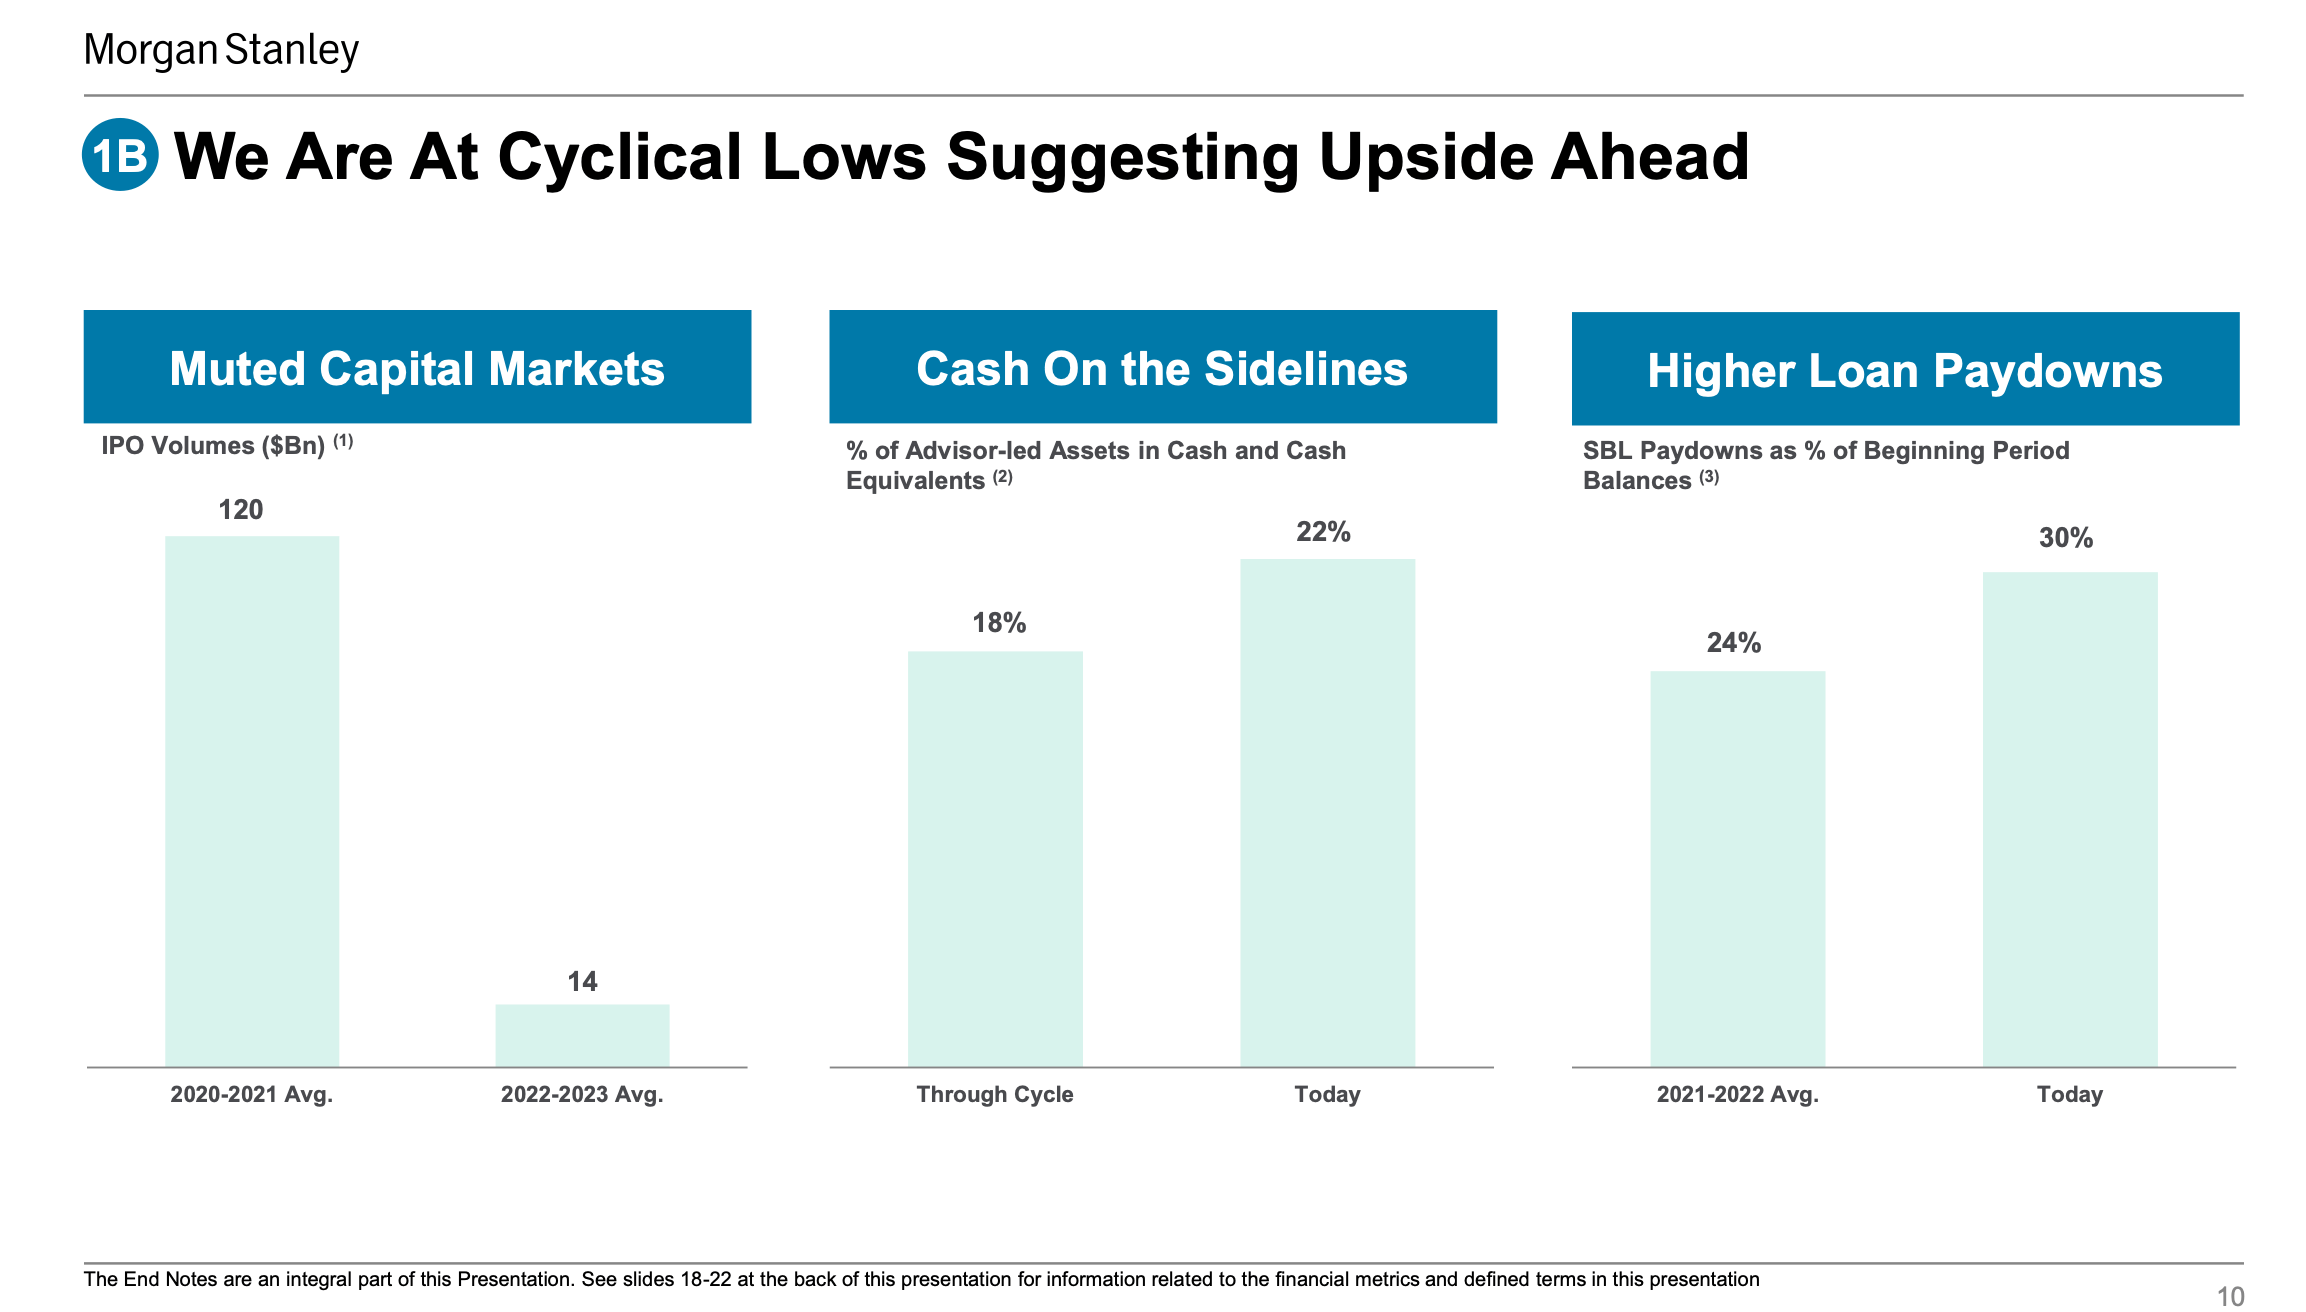
MS Investor Presentation
Despite being at cyclical lows, the firm remains incredibly profitable and continues to position itself in a way in which it will depend somewhat less on M&A activity for profitability.
Several elements played a role in dampening the M&A landscape in the previous year: inflation, rates, uncertainty in equity markets.
Global M&A in 2023 was below the average of 2006-2020.
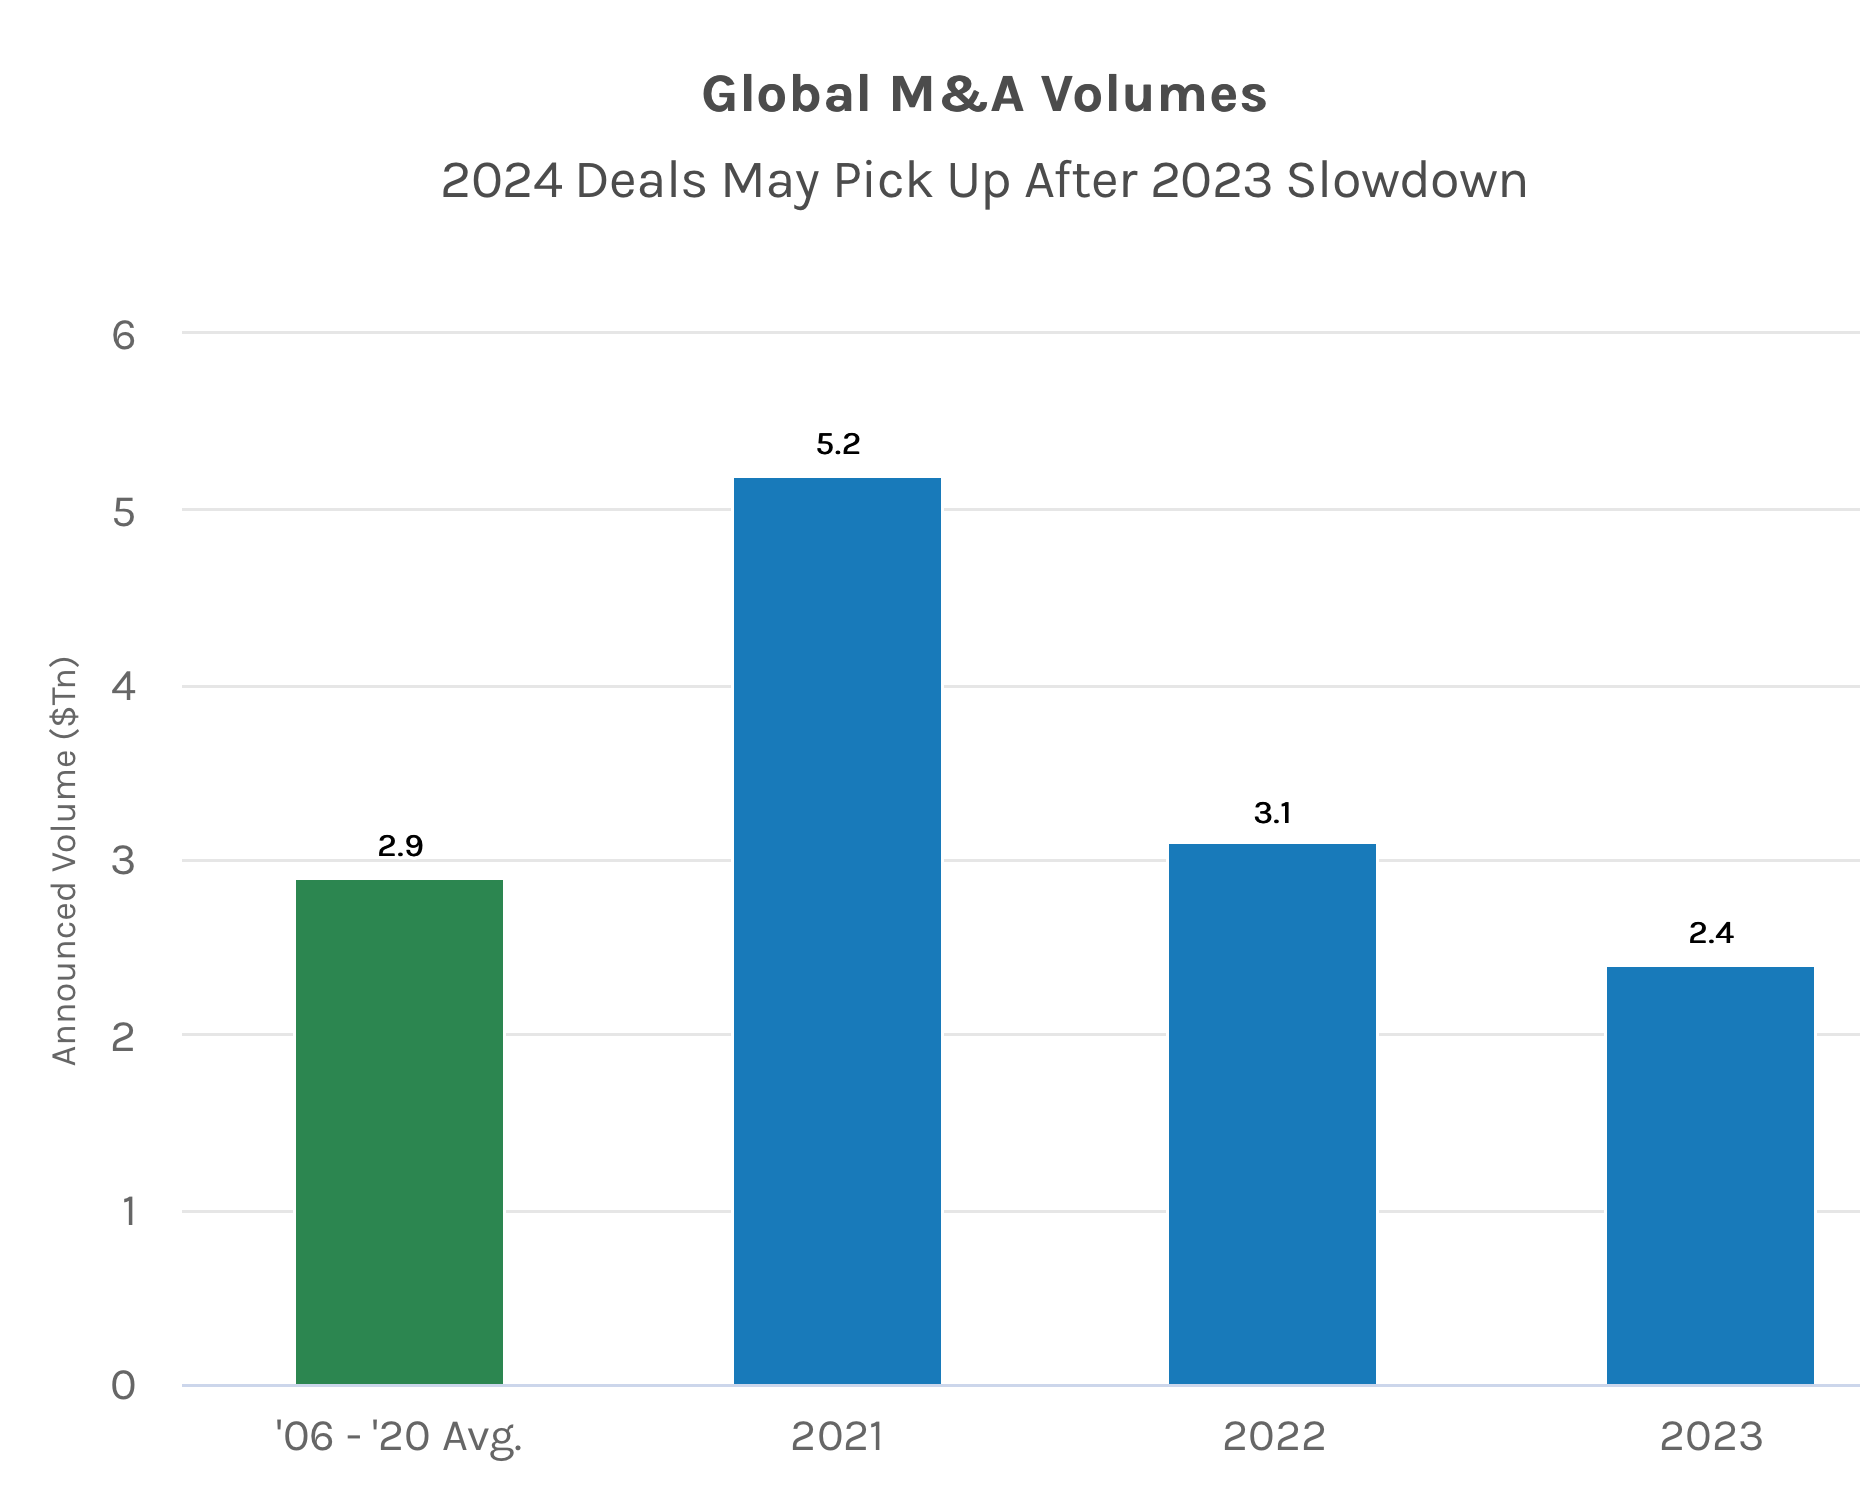
MS Investor Presentation
In 2024, they expect a revival in M&A driven by strong corporate balance sheets, record-high S&P 500, and growing CEO confidence.
And so once again, in M&A the pendulum swings back and forth. It has now swung below averages. It is therefore reasonable to expect it to swing back.
As it does, it leaves plenty of room for MS to surprise to the upside, as everyone is focused on the very good WM growth story. An investment banking comeback will be facilitated by rate cuts, high S&P 500 levels, and I look forward to it.
Morgan Stanley currently trades at $89 and yields 3.8%, significantly more than its 10 year median yield of 2.5%.
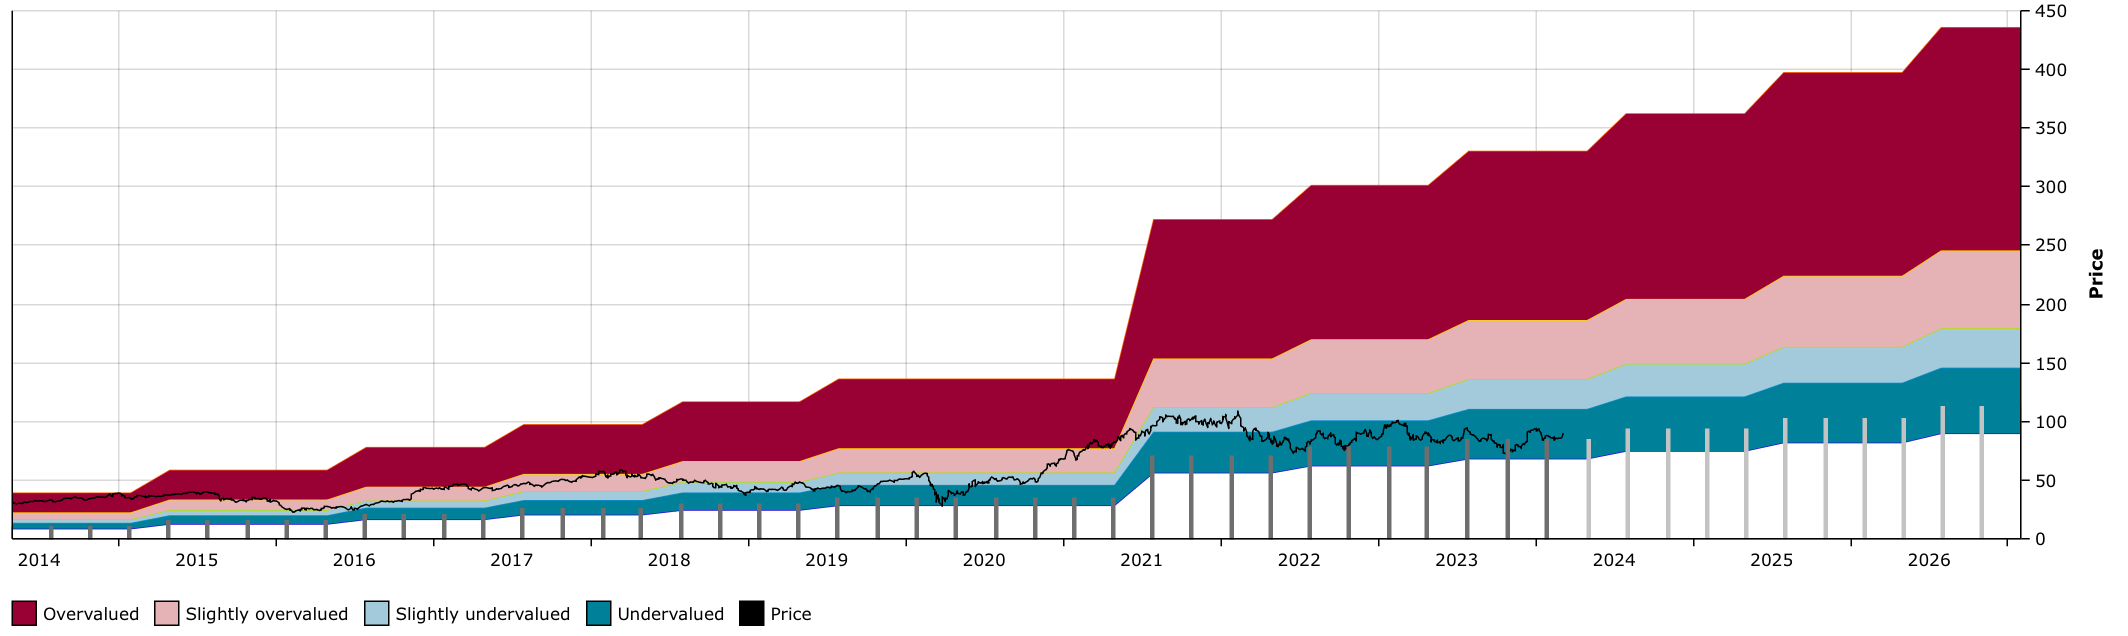
MS DFT Chart (Dividend Freedom Tribe)
At 14x earnings we can agree that there is room for a lot of expansion in valuation multiples.
MS is a brilliant stock to own for the rest of 2024.
I was keeping up to date with what fellow analysts had to say about LyondellBasell (LYB), and in the comment section of one of the articles, I read:
"Flat returns over 10 years, no thanks".
Looking at the DFT chart below, you'd realize that this is only true because buying in 2014 would mean buying when the stock was historically overvalued.
From a dividend investors perspective, buying a stock which grows the dividend at 5-7% per annum when it yields 2.5% is a losing proposition.
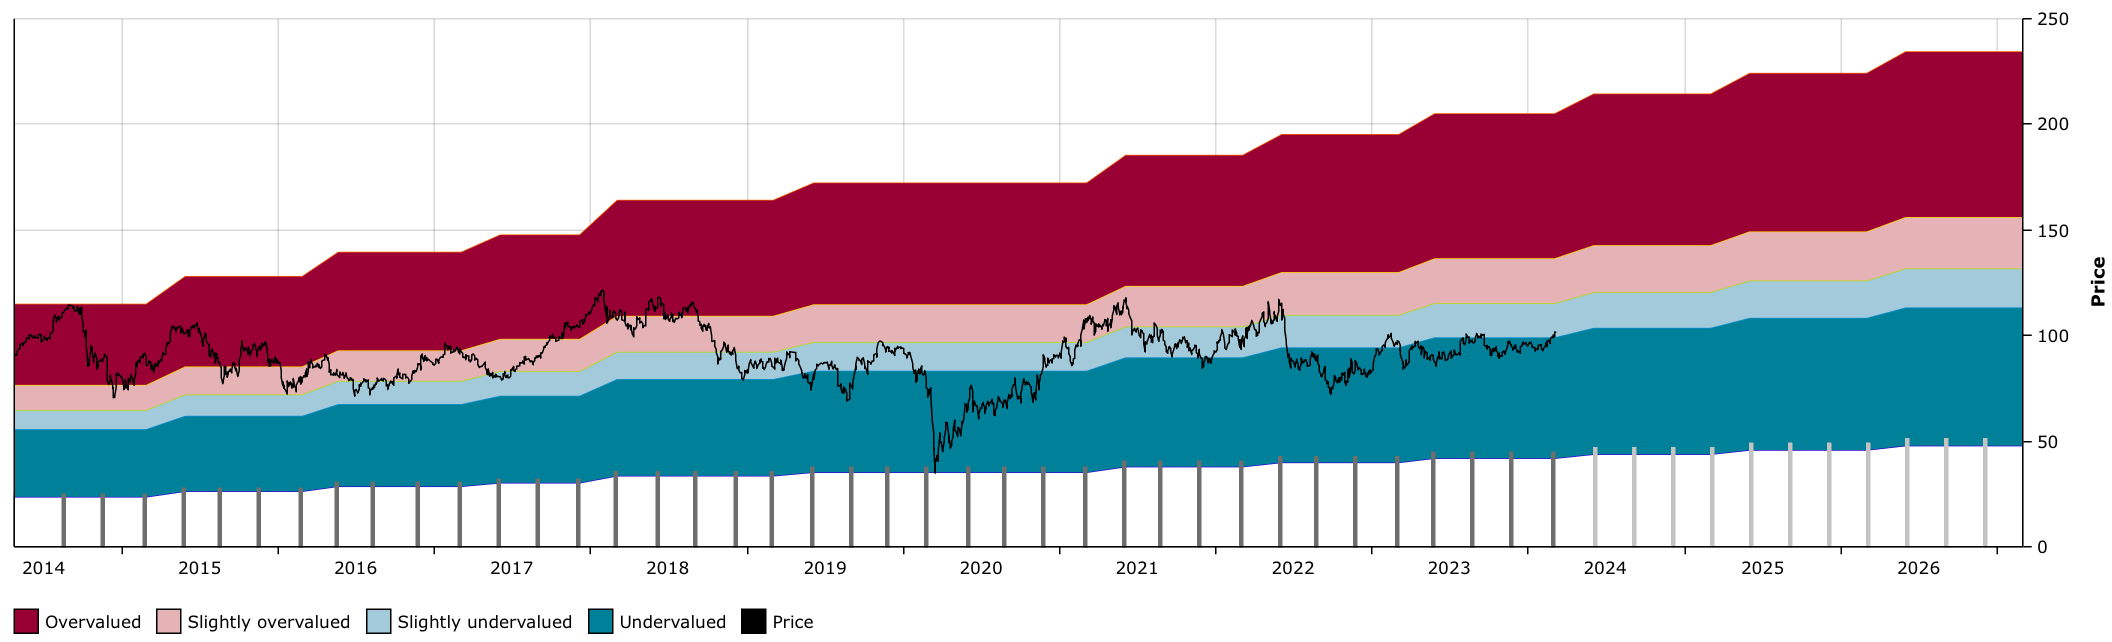
LYB DFT Chart (Dividend Freedom Tribe)
The pendulum swings in cyclical industries, and the demand for polyolefins (a fancy word for plastics) is also cyclical in nature.
Sure buying LYB 10 years ago would result in 10 years of stagnant price returns.
But buying in 2020 at $60 (let's ignore the bottom at $34, because we don't need to get the bottom) would result in 13.6% annual returns, before the dividend, which would have brought returns up to 20% per year.
Of course, all of this is to say that if you buy high, you cannot expect to get solid results.
Comparing a stock's price returns from its top of a previous cycle is only valid if you look at the top of the current cycle.
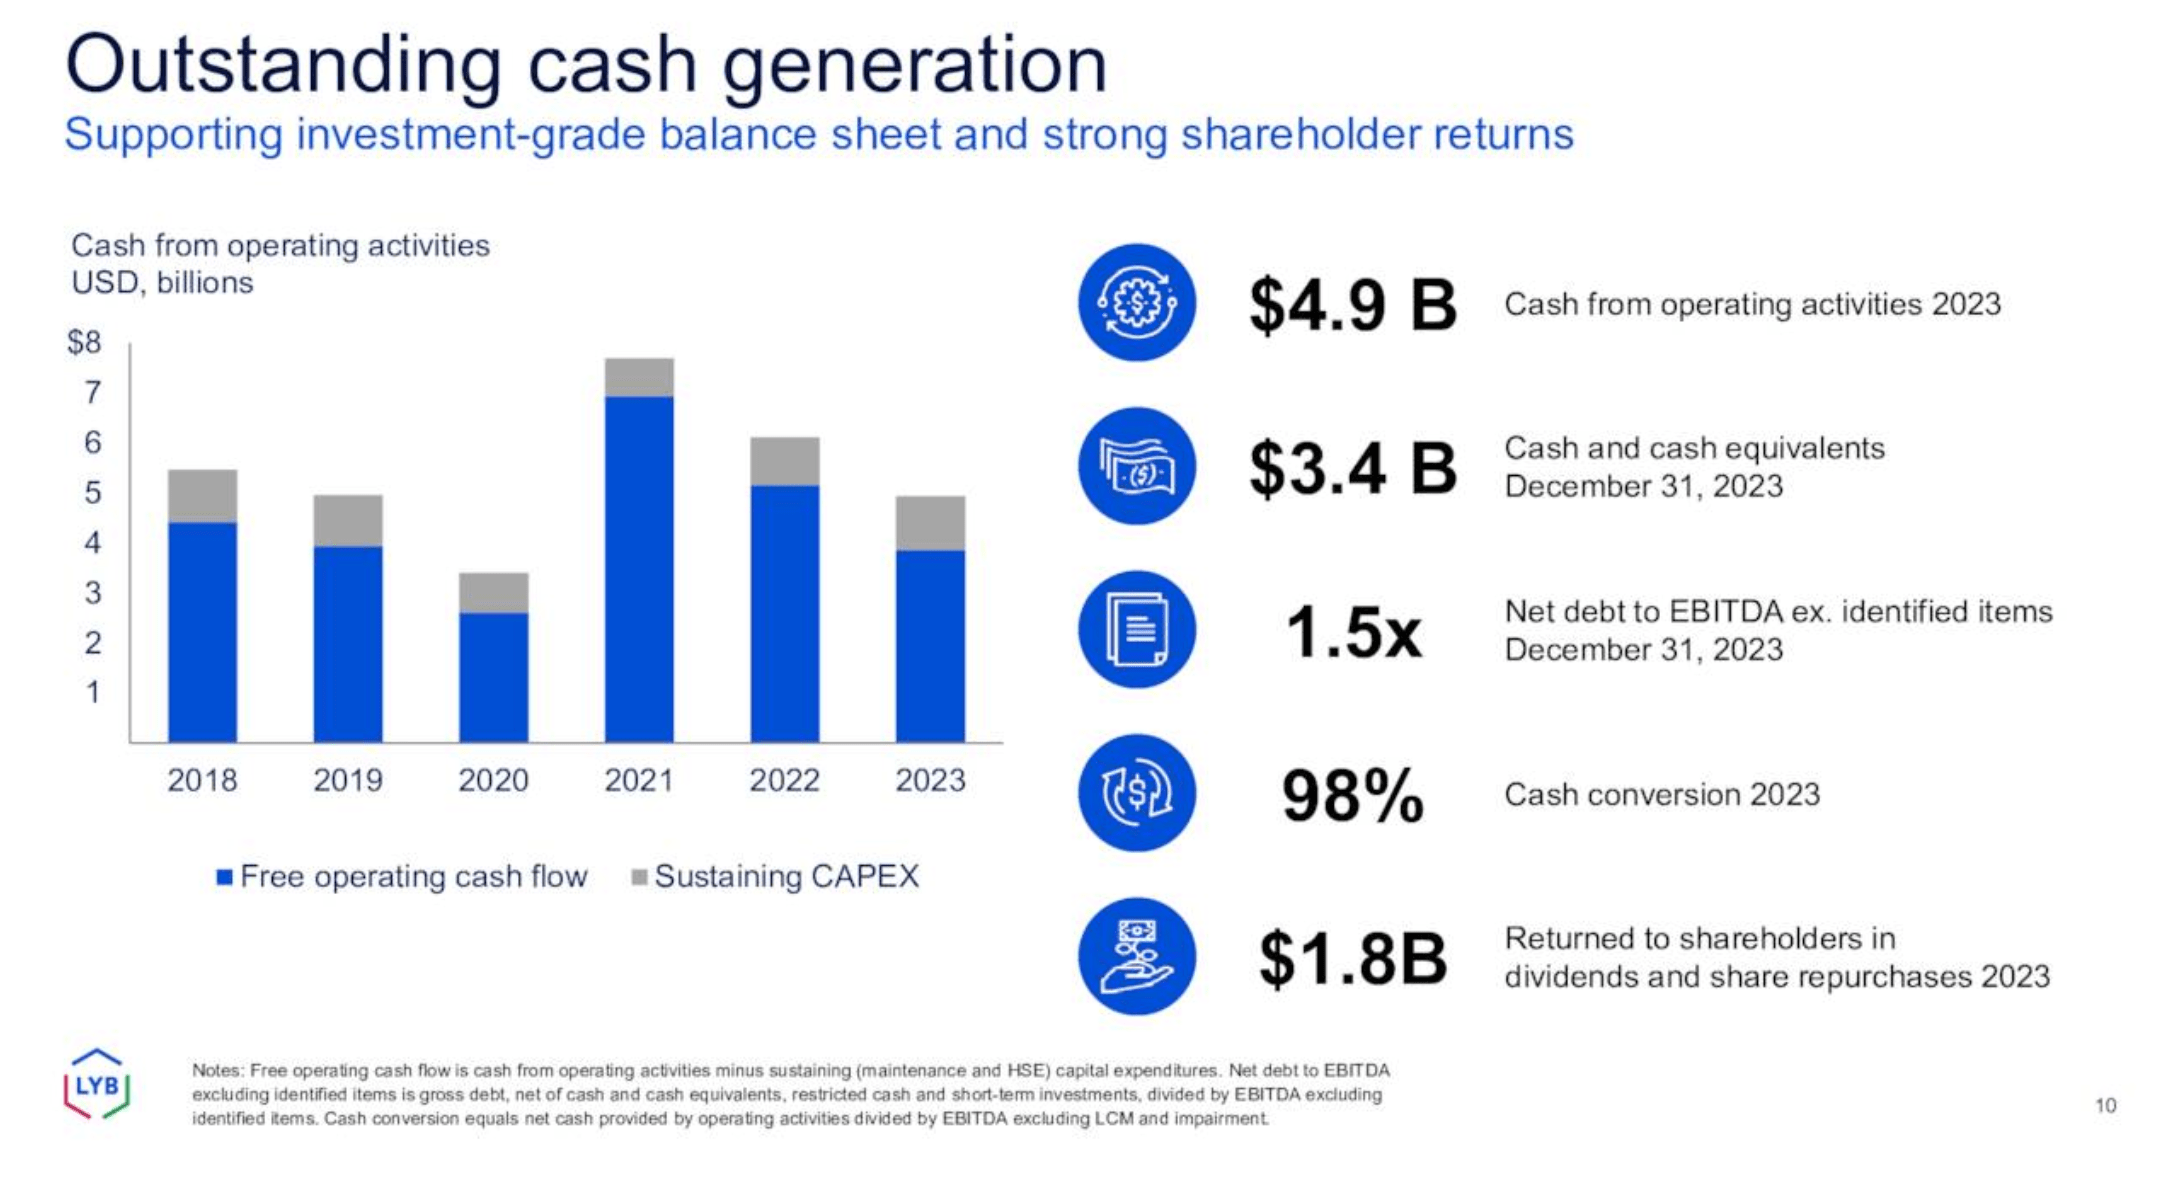
Today LYB trades at $101 and yields 4.9%. During the past two years it has increased the dividend by 5% each year, and I expect it to do the same this year.
The company generates huge amounts of cashflow, and pays out less than half of their FCF as dividends and buybacks.
LYB Investor Presentation
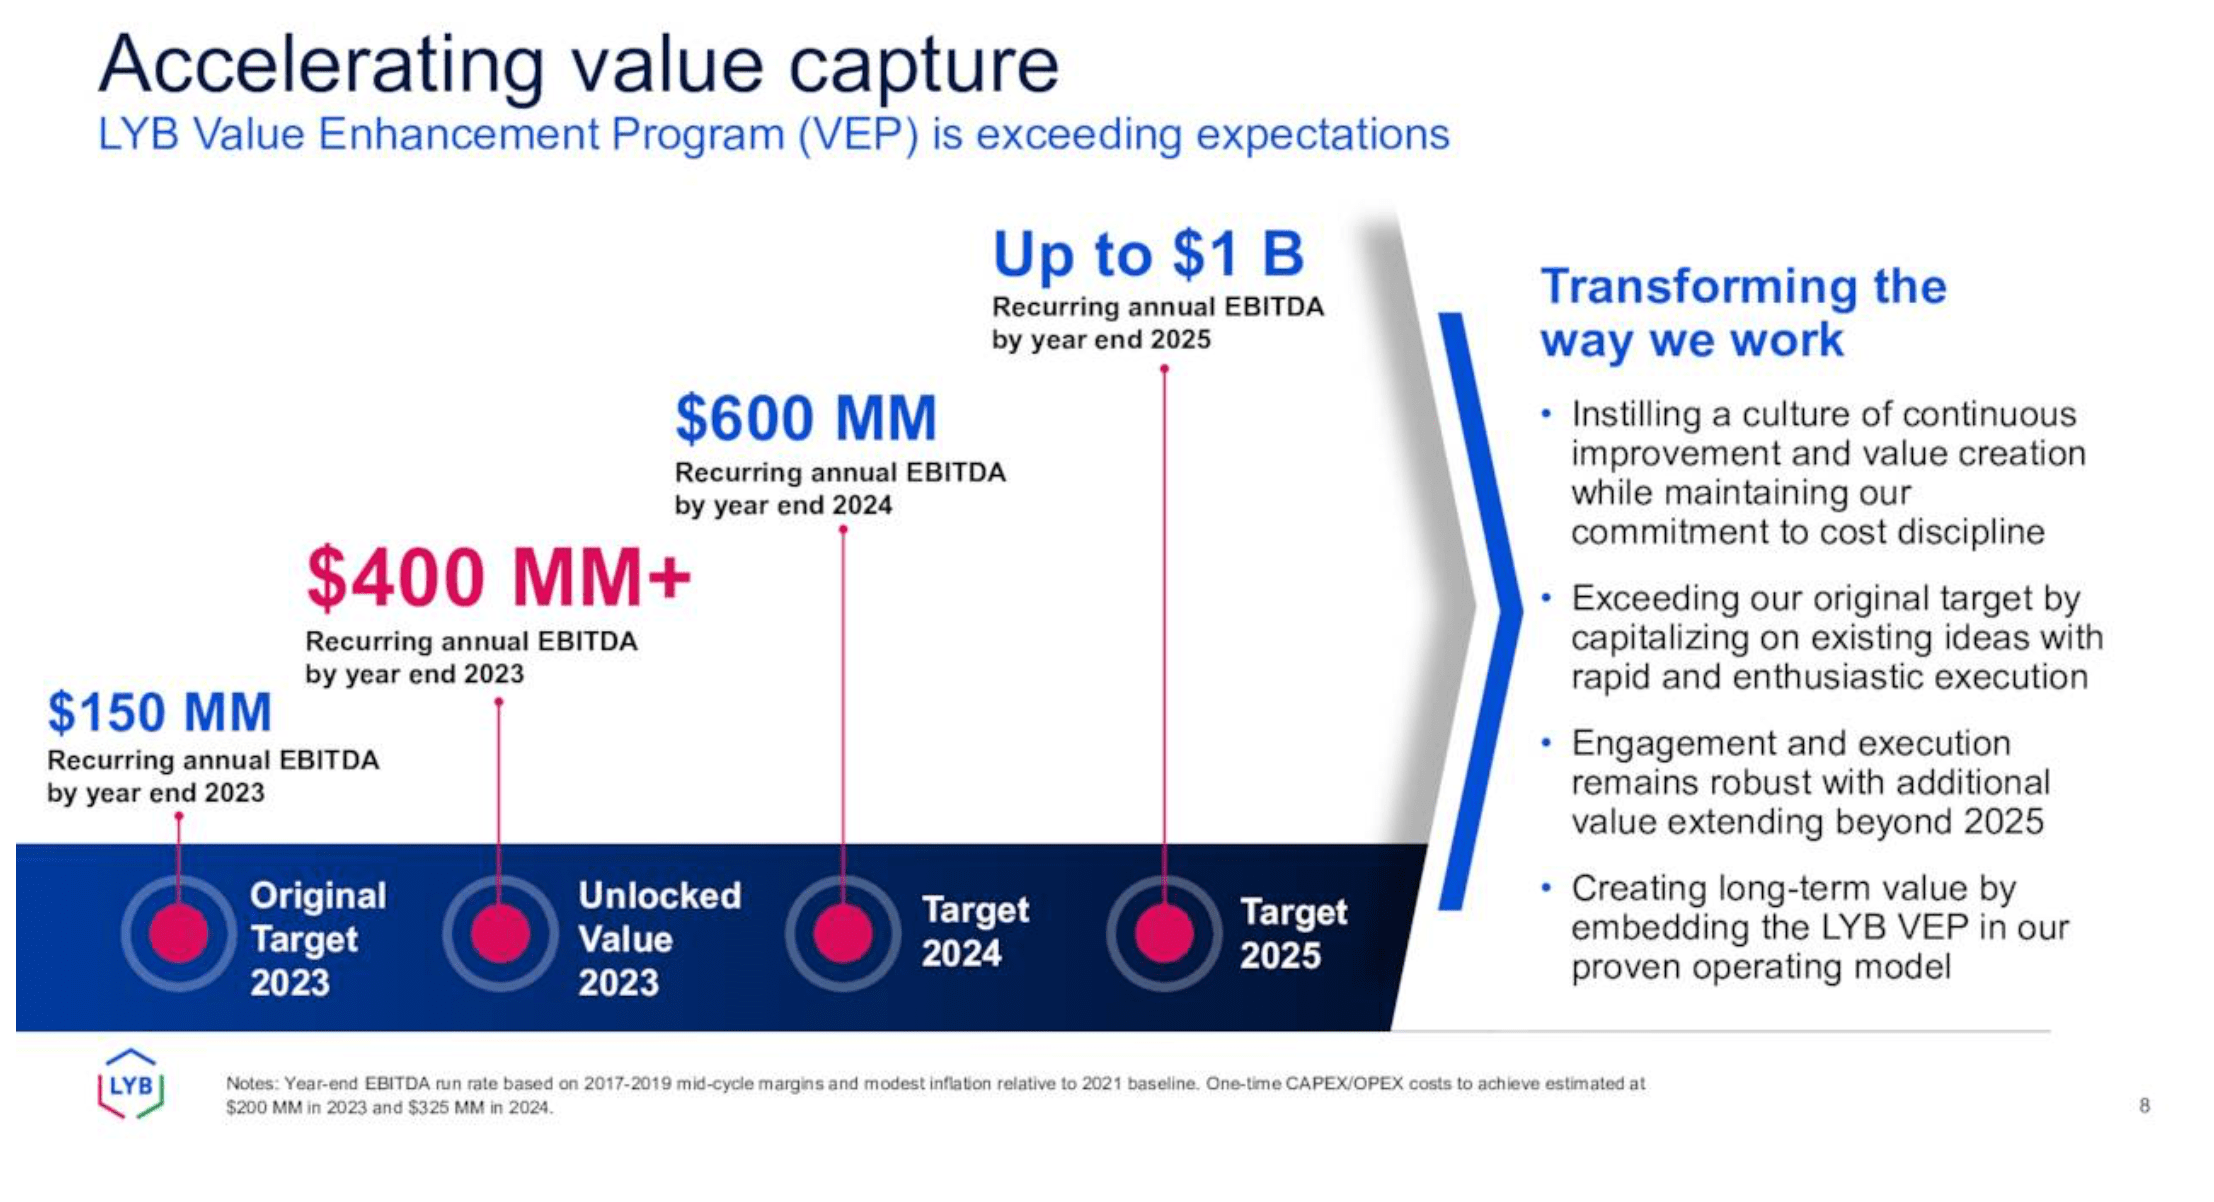
Management has identified throughout its operations different levers to unlock value and deliver long lasting improvements to EBITDA.
LYB Investor Presentation
Since launching the value enhancement program, they have exceeded expectations.
Within 2 years, they expect to unlock up to $1bn in extra EBITDA from having cut costs, integrated with various partners, and improved the operating metrics of the company.
Management is doing a brilliant job, the stock is gaining some momentum, and I believe we'll see it continue to go higher in 2024.
If not, we'll continue to collect a nice dividend growing at a good rate, which will be a prized commodity when interest rates start going down.
Chuck Carnevale made this quote popular on Seeking Alpha, and I'm making it my mission to use it so much that people attribute it to me (just kidding).
It captures the essence of our understanding of the stock market, and our investing philosophy.
A stock market implies that everything goes up and down in lockstep. It sometimes feels that way, but when you look closely you realize that, it is in fact a market of stocks.
For everything overvalued, there is something undervalued.
Every time a pendulum swings one way, another swings the other.
It is an imperfect exercise to capitalize on this, but active investors who do so in a conservative manner, can convert value into income, and enjoy an ever growing dividend stream.