
bymuratdeniz
bymuratdeniz
The SPDR S&P 500 Trust ETF (SPY) posted a 5.22% return in February, extending its positive streak this year. Vanguard's Dividend Appreciation Index Fund ETF Shares (VIG) locked in a lower gain of 3.41% last month. My watchlist underperformed both, posting a very weak return of 0.89%. After two strong months of outperformance to cap off 2023 the watchlist is experiencing a pullback in 2024. As we all know, some months are better than others, I remain optimistic the watchlist will remain competitive in 2024.
Even though SPY and VIG are off to a better start my watchlist remains slightly ahead of both on a long-term basis. Since inception, September of 2020, the watchlist has a CAGR of 13.16% compared to 11.41% for VIG and 13.01% for SPY.
My goal is not to beat SPY or VIG but to generate a long-term rate of return of at least 12%. Despite the poor start to the year, the watchlist remains ahead of this target.
The main goal of this watchlist is to find the best combination of high-quality companies trading for attractive prices. I believe this is the optimal long-term strategy for building wealth.
The top 15 dividend growth stocks for March 2024 offer an average dividend yield of 1.37%. Collectively, they have increased dividend payments at a rate of 32.83% during the last 5 years. Based on dividend yield theory, these 15 stocks are about 26% undervalued right now, and I think they are poised to offer strong long-term returns.
I would suggest considering two approaches to dividend investing. The first involves dollar-cost averaging into a diversified portfolio comprising at least 10-20 high-quality dividend-paying stocks spanning various sectors and industries. By adopting a dollar-cost averaging strategy, you mitigate the risk associated with attempting to time the market. Over an extended period, this method allows you to acquire shares at market highs, lows, and in-between, ultimately establishing an average cost basis situated in the middle.
The second method introduces a slightly higher level of risk. It entails investing in undervalued stocks while still adhering to a dollar-cost averaging strategy. In this approach, you diversify across a minimum of 10-20 distinct, high-quality companies spanning multiple sectors and industries. The increased risk stems from the possibility that your valuation methodology may prove inaccurate. However, by spreading investments across multiple stocks, the likelihood of correctly identifying undervalued opportunities improves. The potential upside resulting from accurate selections may well outweigh any underperformance stemming from less successful picks.
The criteria used to determine which stocks are included in my high-growth dividend stock watchlist remain unchanged for March 2024. It is made up of the 8 factors listed below that have historically outperformed the broad universe of dividend-paying stocks when analyzed collectively.
The rules identified 117 stocks for the month that were all ranked based on the above-mentioned metrics with the exclusion of market cap. I then computed the current valuation for each stock using dividend yield theory. All stocks were ranked for both quality and valuation and sorted by the best combination of both. Next, I computed a forecasted rate of return for the next 5-year period for each of the stocks. This return is based on forecasted earnings growth, a return to fair value, and the dividend yield.
The highest-ranked 15 stocks with a forecasted return greater than or equal to 12% were chosen for the watchlist. The long-term hypothesis for this watchlist is that it will outperform a broad-quality dividend fund such as Vanguard's Dividend Appreciation ETF, VIG and that it will generate a 12% annualized rate of total return.
Created by Author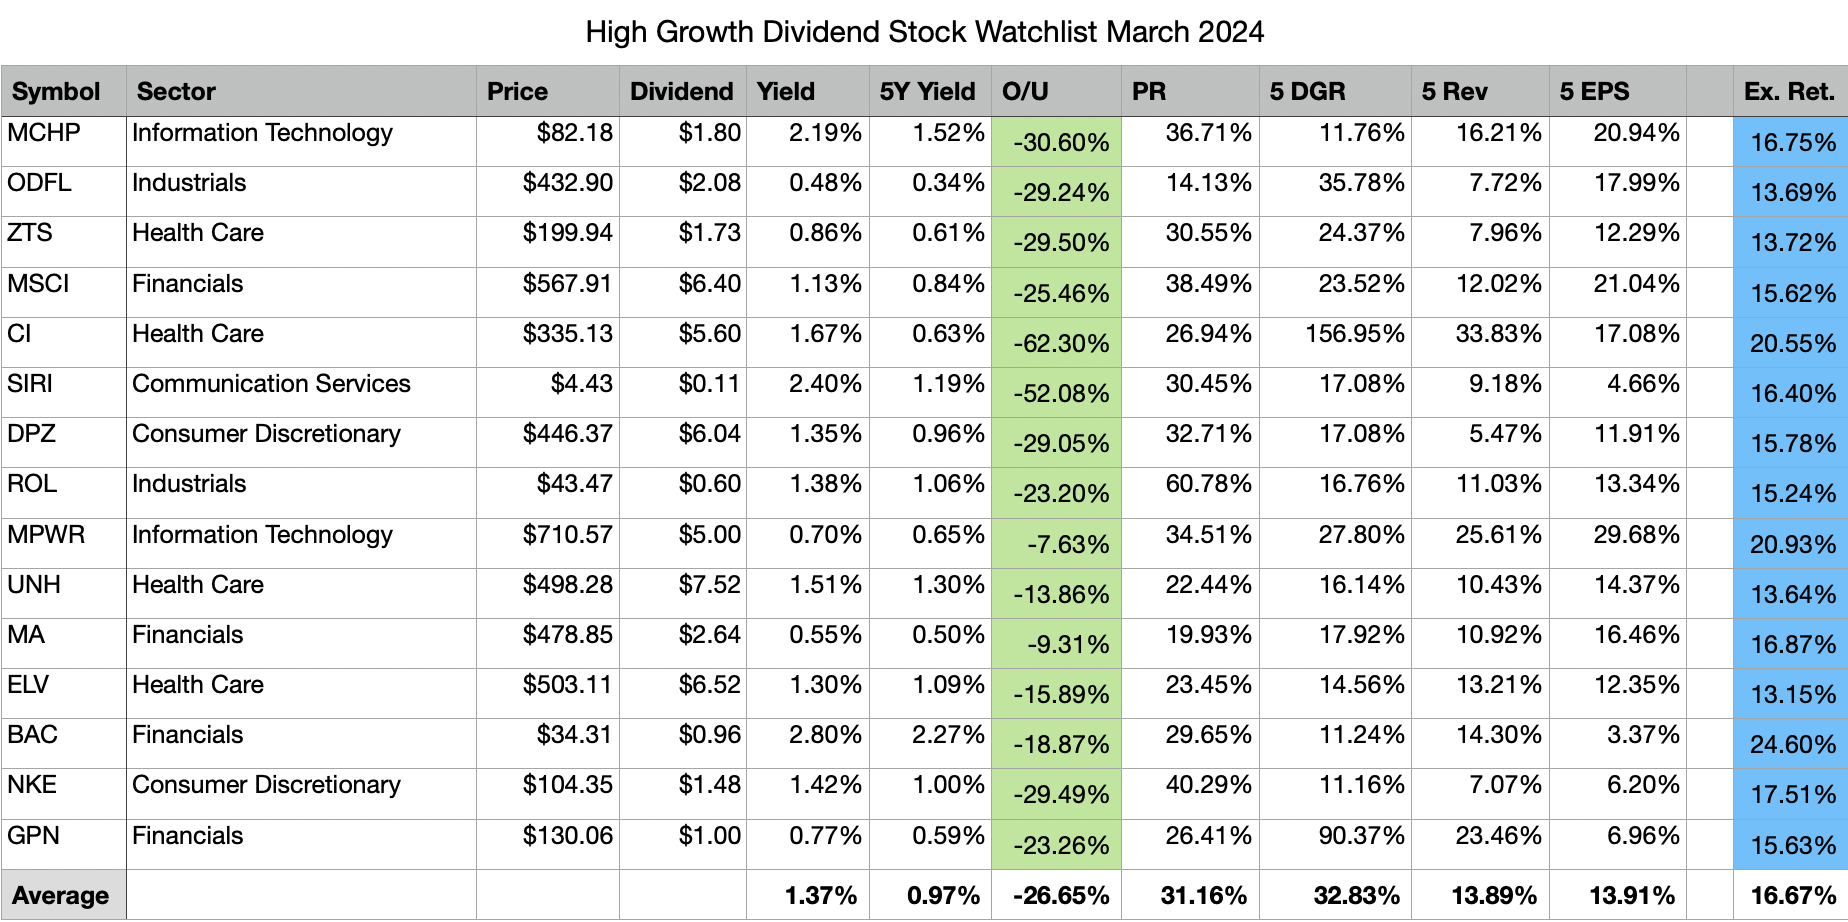
Above are the 15 stocks I am considering for further evaluation during the month. They are sorted in descending order by their rank and 5-year dividend growth rate.
The "O/U" column represents potential undervalue; this is a comparison of the current dividend yield to the historical dividend yield as a function of share price.
The expected return in the table above was computed using a discounted 5-year EPS forecast, a return to fair value, and the current dividend yield. There is also a margin of safety built into the forecasted return. These figures are just assumptions based on the available data and there is no guarantee these returns will be attained.
There are 5 changes to the top 15 list from the prior month. Allegion plc (ALLE), EOG Resources (EOG), MarketAxess Holdings (MKTX), SS&C Technologies (SSNC) and Visa (V) have fallen further down the list, or do not meet the 12% expected rate of return threshold and were replaced by Bank of America (BAC), Global Payments (GPN), Monolithic Power Systems (MPWR), NIKE (NKE) and Old Dominion Freight (ODFL). This is the first time Global Payments and Old Dominion are appearing in the top 15 list.
The top 15 list from February posted a modest gain of 0.89% and as a result the long-term alpha over both benchmarks has shrunk. The long-term annualized rate of return for the watchlist decreased from 13.21% last month to 13.16%. My target rate of return is 12%, and despite this minor setback in January, the watchlist is still sitting above its target.
Month | Top 15 | All | VIG | SPY |
1 Month | 0.89% | 3.98% | 3.41% | 5.22% |
3 Month | 7.41% | 11.74% | 9.01% | 11.78% |
6 Month | 5.06% | 12.15% | 10.51% | 13.68% |
1 Year | 11.62% | 19.65% | 19.76% | 30.17% |
2020 | 6.27% | 6.15% | 9.09% | 7.94% |
2021 | 33.81% | 31.55% | 23.75% | 28.76% |
2022 | -8.58% | -15.12% | -9.80% | -18.16% |
2023 | 20.89% | 21.88% | 14.50% | 26.18% |
2024 | -1.92% | 3.37% | 4.68% | 6.89% |
Since Inception | 54.14% | 49.35% | 45.96% | 53.41% |
Annualized | 13.16% | 12.14% | 11.41% | 13.01% |
Top 5 past and present watchlist stocks in February 2024:
None of the top 15 stocks selected for the month of February was amongst the top 5 performing stocks last month. In total, there have been 77 unique dividend stocks selected by this watchlist since September 2020. It is worthy to note that Activision Blizzard was amongst this list prior to being acquired by Microsoft.
Top 5 Stocks by Total Return since joining the watchlist:
Since not all stocks have been on the watchlist for the full 42 months of their existence, comparing a monthly average return can help normalize the results. Here are the top 5 stocks with the highest average monthly return since joining the watchlist.
The watchlist underperformed VIG in February. Only five watchlist stocks outpaced the ETF last month.
The remaining 10 stocks underperformed VIG.
Here are the total returns for all past and present watchlist stocks since first appearing on the watchlist. Out of the 77 stocks that are on this list, 63 (61 last month) have positive total returns and 14 have negative total returns, the average return is 37.68% (30.88% last month). The watchlist has been around for 42 months, and the average duration for all 77 stocks is 31.79 months.
Symbol | Since Joining | Count |
NVDA | 495.27% | 35 |
KLAC | 124.27% | 34 |
PGR | 123.90% | 37 |
AMAT | 114.27% | 37 |
COST | 109.26% | 42 |
CTAS | 104.02% | 37 |
LRCX | 100.83% | 37 |
MPWR | 96.35% | 36 |
INTU | 96.21% | 42 |
ADP | 94.10% | 42 |
CDW | 93.89% | 37 |
TSCO | 89.12% | 37 |
MSFT | 89.02% | 42 |
APH | 80.24% | 37 |
BK | 76.87% | 42 |
FAST | 64.61% | 42 |
ACN | 64.03% | 42 |
TJX | 63.03% | 37 |
JPM | 57.33% | 37 |
GGG | 56.42% | 42 |
MSCI | 55.17% | 42 |
UNH | 54.26% | 37 |
LOW | 48.48% | 42 |
SHW | 48.26% | 37 |
ROL | 47.19% | 25 |
CI | 46.32% | 24 |
HD | 45.19% | 42 |
NOC | 41.89% | 42 |
BLK | 41.66% | 42 |
EXPD | 38.15% | 37 |
WRB | 36.98% | 11 |
V | 36.72% | 42 |
FDS | 36.12% | 42 |
DFS | 35.89% | 6 |
SCHW | 35.14% | 37 |
MA | 35.13% | 42 |
BBY | 33.30% | 20 |
MCO | 33.03% | 42 |
BX | 31.92% | 19 |
ICE | 30.45% | 37 |
ROP | 30.04% | 42 |
WST | 27.22% | 42 |
LMT | 26.56% | 42 |
TMO | 25.73% | 35 |
USB | 23.19% | 40 |
BAC | 22.20% | 6 |
ZTS | 20.93% | 13 |
FDX | 16.71% | 24 |
CMCSA | 14.39% | 42 |
DPZ | 13.92% | 42 |
MCHP | 13.59% | 9 |
NTRS | 11.76% | 42 |
GS | 11.75% | 31 |
TXN | 9.79% | 37 |
JKHY | 9.40% | 42 |
DE | 8.75% | 27 |
KR | 7.55% | 8 |
ALLE | 7.41% | 8 |
EOG | 6.45% | 12 |
ATVI | 4.39% | 29 |
MS | 4.04% | 33 |
ELV | 1.58% | 1 |
SSNC | 0.04% | 36 |
NKE | -4.27% | 2 |
HUM | -5.79% | 36 |
WTRG | -6.07% | 2 |
TROW | -6.69% | 42 |
SBUX | -14.69% | 26 |
LAD | -22.06% | 35 |
DG | -26.07% | 35 |
SWKS | -28.64% | 26 |
SIRI | -30.65% | 23 |
BALL | -31.48% | 26 |
FMC | -51.98% | 21 |
AAP | -59.23% | 20 |
MKTX | -59.35% | 37 |
PARA | -73.66% | 32 |
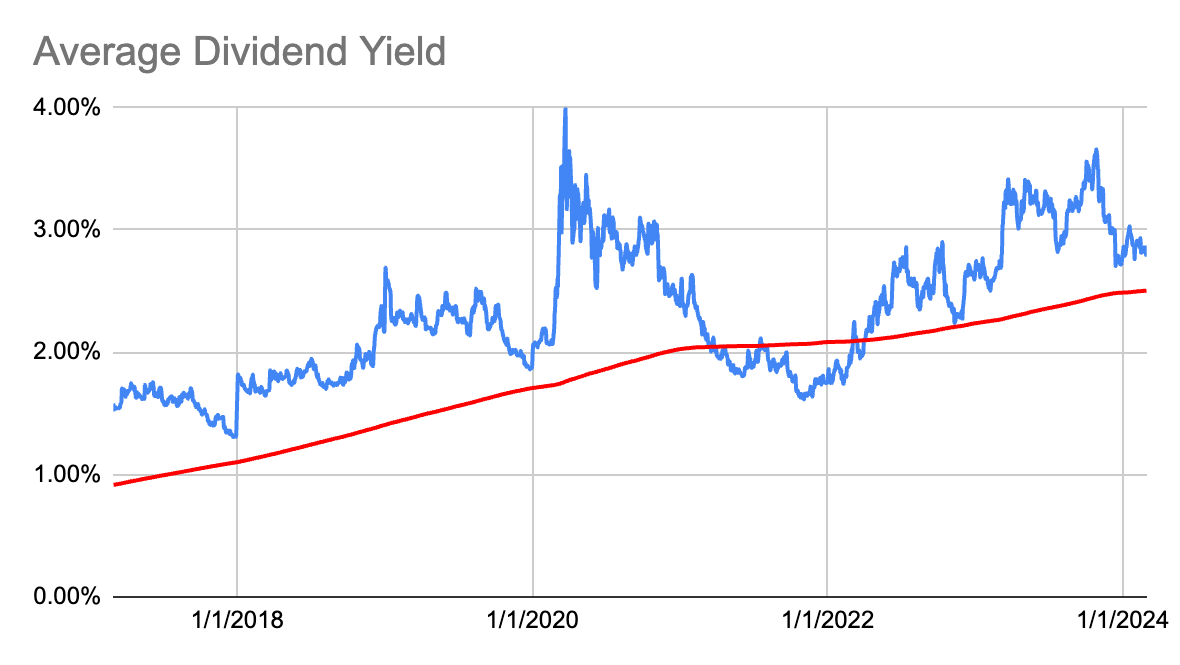
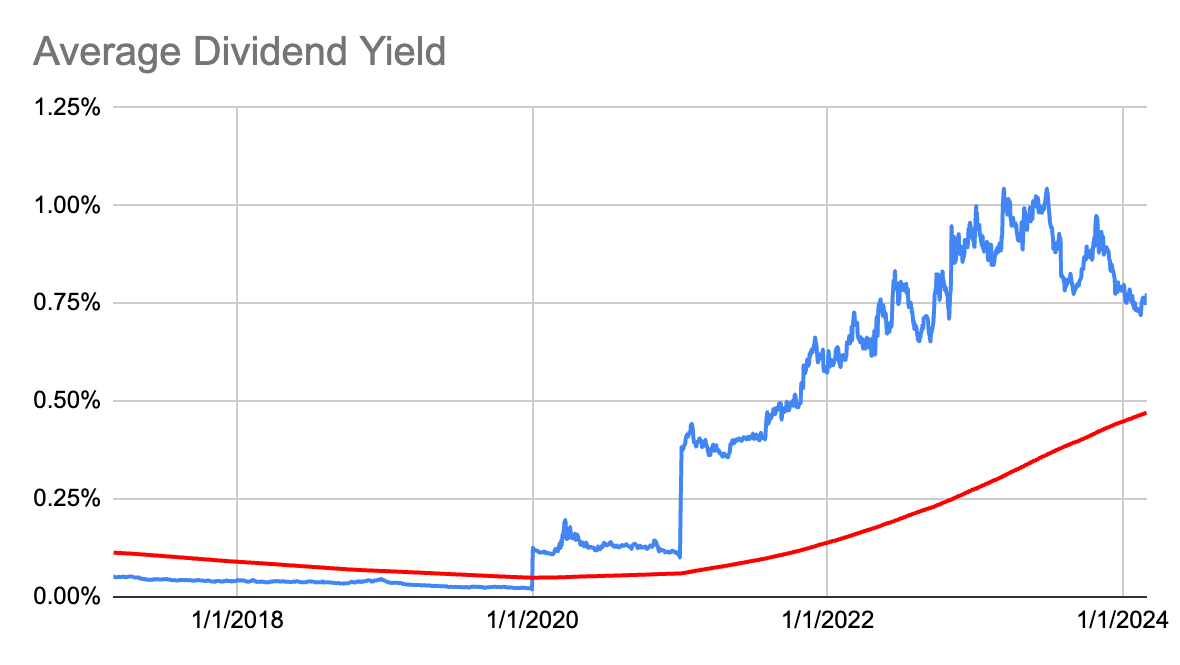
Below are a 7-year dividend yield theory chart, a dividend history chart, and a dividend growth table for the 5 new stocks on the watchlist this month.
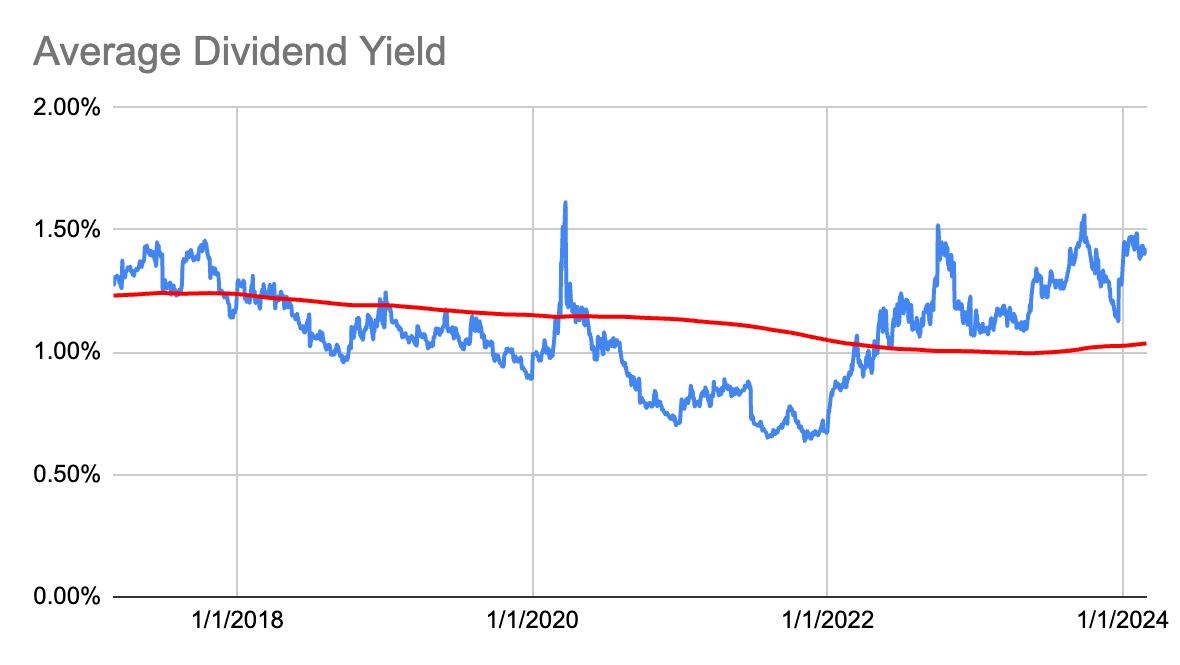
First up is Bank of America.
Created by Author Created by Author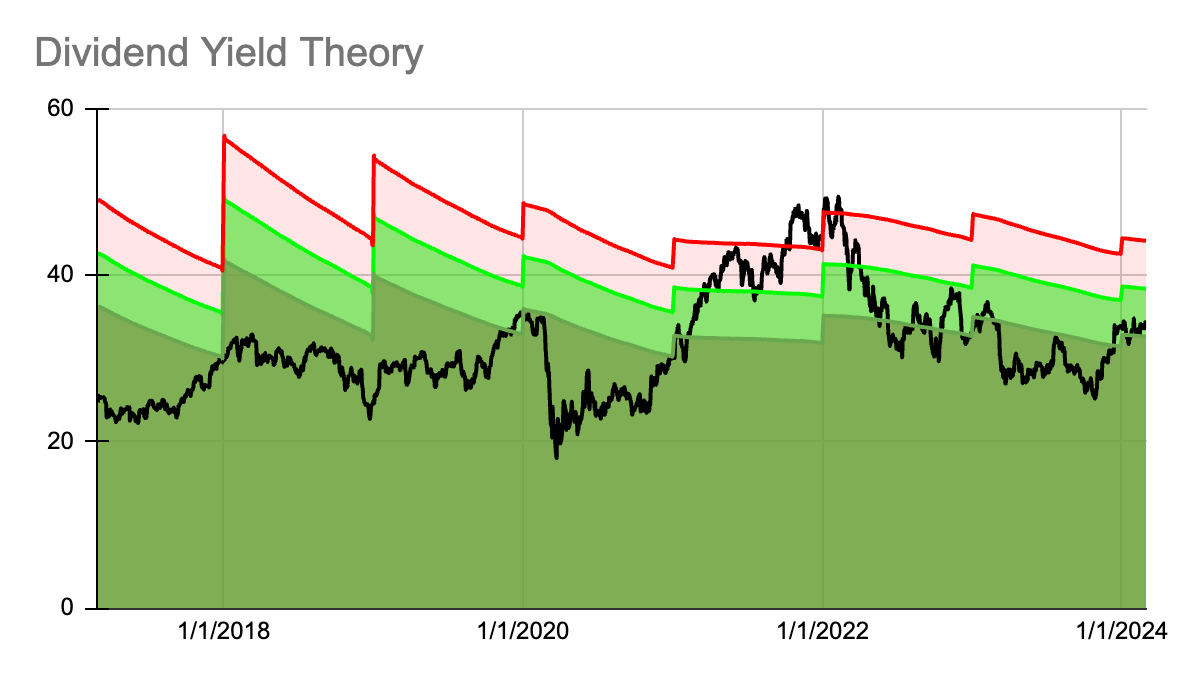
| Year | Dividend | Growth | CAGR |
| 2024 | 0.96 | 4.35% | |
| 2023 | 0.92 | 6.98% | 4.35% |
| 2022 | 0.86 | 10.26% | 5.65% |
| 2021 | 0.78 | 8.33% | 7.17% |
| 2020 | 0.72 | 9.09% | 7.46% |
| 2019 | 0.66 | 22.22% | 7.78% |
| 2018 | 0.54 | 38.46% | 10.06% |
| 2017 | 0.39 | 56.00% | 13.73% |
| 2016 | 0.25 | 25.00% | 18.32% |
| 2015 | 0.20 | 66.67% | 19.04% |
| 2014 | 0.12 | 200.00% | 23.11% |
| 2013 | 0.04 | 0.00% | 33.50% |
| 2012 | 0.04 | 30.32% |
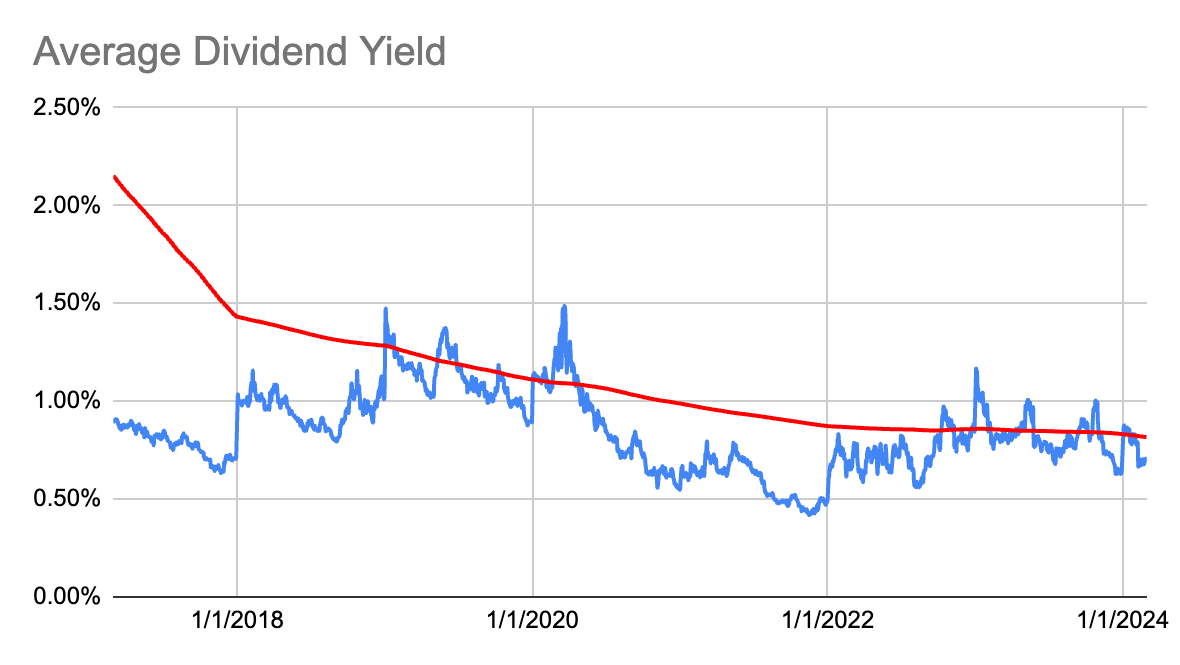
Up next is Global Payments.
Created by Author Created by Author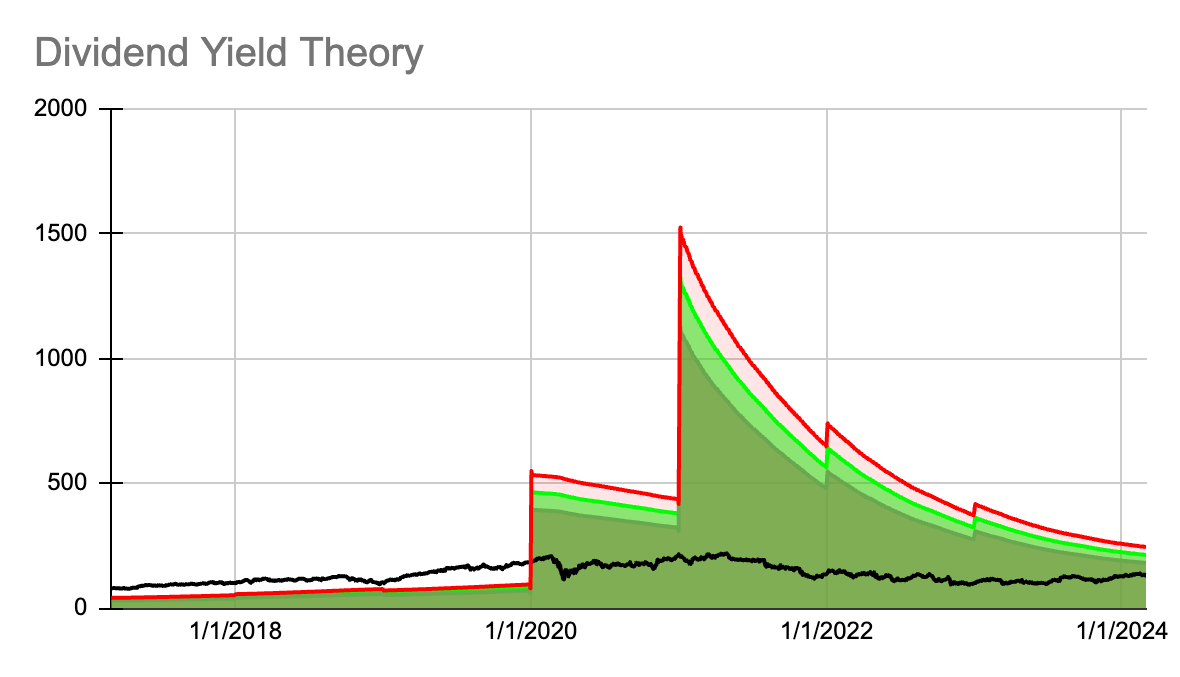
| Year | Dividend | Growth | CAGR |
| 2024 | 1.00 | 0.00% | |
| 2023 | 1.00 | 12.36% | 0.00% |
| 2022 | 0.89 | 14.10% | 6.00% |
| 2021 | 0.78 | 246.67% | 8.63% |
| 2020 | 0.23 | 462.50% | 45.20% |
| 2019 | 0.04 | -7.62% | 90.37% |
| 2018 | 0.04 | 8.25% | 68.75% |
| 2017 | 0.04 | 0.00% | 58.38% |
| 2016 | 0.04 | 0.00% | 49.53% |
| 2015 | 0.04 | 0.00% | 43.00% |
| 2014 | 0.04 | 0.00% | 37.97% |
| 2013 | 0.04 | 0.00% | 33.99% |
| 2012 | 0.04 | 30.77% |
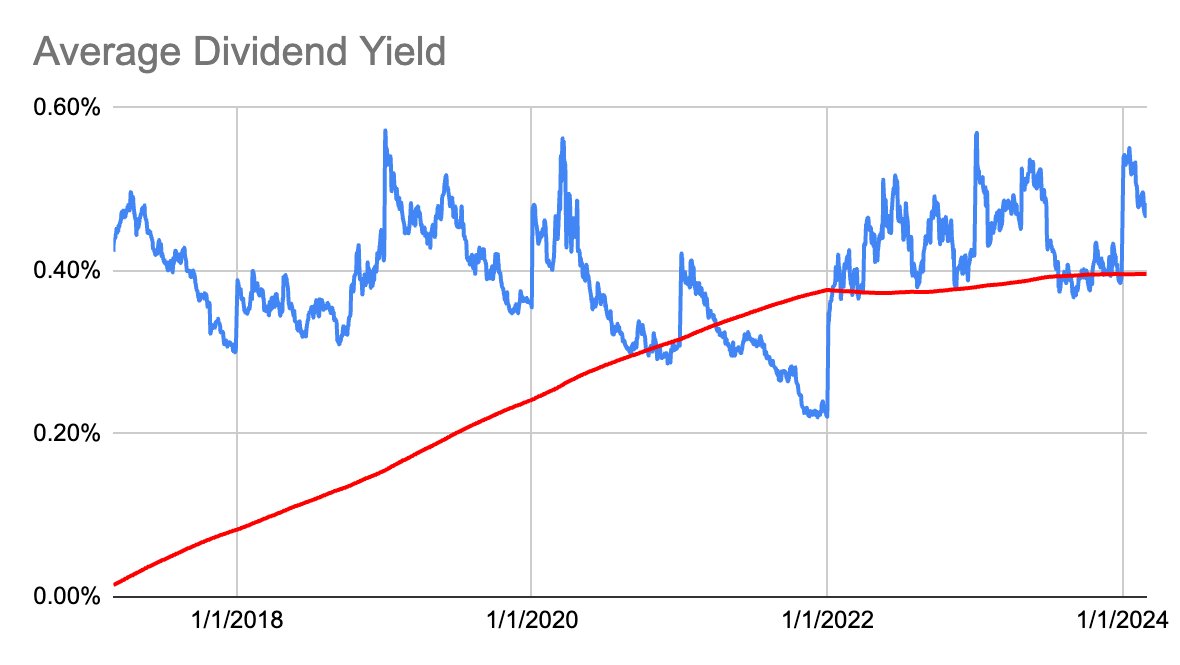
Up next is Monolithic Power Systems.
Created by Author Created by Author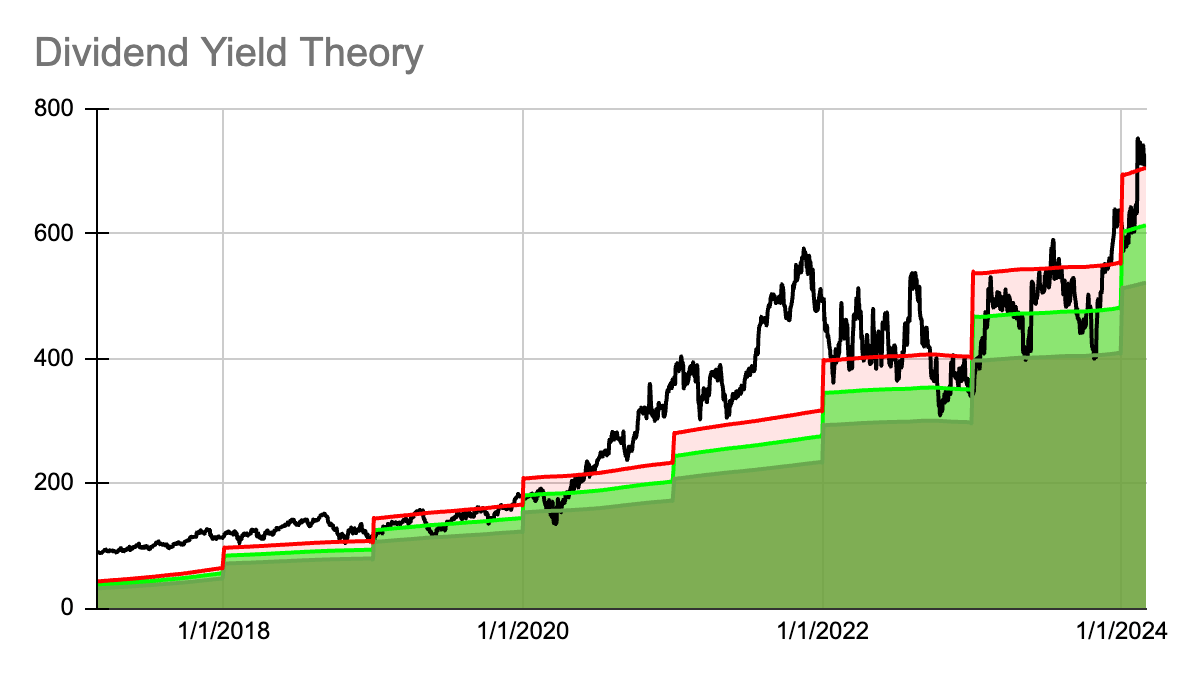
| Year | Dividend | Growth | CAGR |
| 2024 | 5.00 | 25.00% | |
| 2023 | 4.00 | 33.33% | 25.00% |
| 2022 | 3.00 | 25.00% | 29.10% |
| 2021 | 2.40 | 20.00% | 27.72% |
| 2020 | 2.00 | 25.00% | 25.74% |
| 2019 | 1.60 | 33.33% | 25.59% |
| 2018 | 1.20 | 50.00% | 26.85% |
| 2017 | 0.80 | 0.00% | 29.93% |
| 2016 | 0.80 | 0.00% | 25.74% |
| 2015 | 0.80 | 0.00% | 22.58% |
| 2014 | 0.80 | 77.78% | 20.11% |
| 2013 | 0.45 | -55.00% | 24.47% |
| 2012 | 1.00 | 14.35% |
Up next is Nike.
Created by Author Created by Author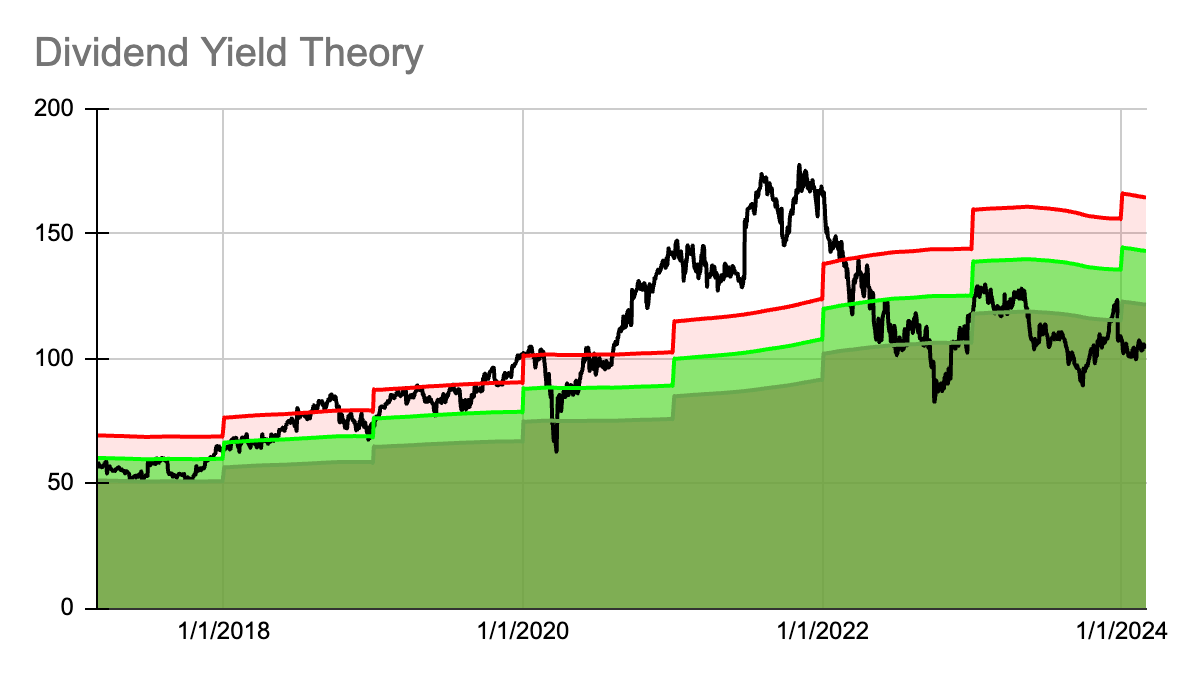
| Year | Dividend | Growth | CAGR |
| 2024 | 1.48 | 6.47% | |
| 2023 | 1.39 | 10.76% | 6.47% |
| 2022 | 1.26 | 11.06% | 8.59% |
| 2021 | 1.13 | 11.88% | 9.41% |
| 2020 | 1.01 | 11.60% | 10.02% |
| 2019 | 0.91 | 10.37% | 10.34% |
| 2018 | 0.82 | 10.81% | 10.34% |
| 2017 | 0.74 | 12.12% | 10.41% |
| 2016 | 0.66 | 13.79% | 10.62% |
| 2015 | 0.58 | 16.00% | 10.97% |
| 2014 | 0.50 | 14.94% | 11.46% |
| 2013 | 0.44 | 34.88% | 11.77% |
| 2012 | 0.32 | 13.54% |
Up Next is Old Dominion Freight.
Created by Author Created by Author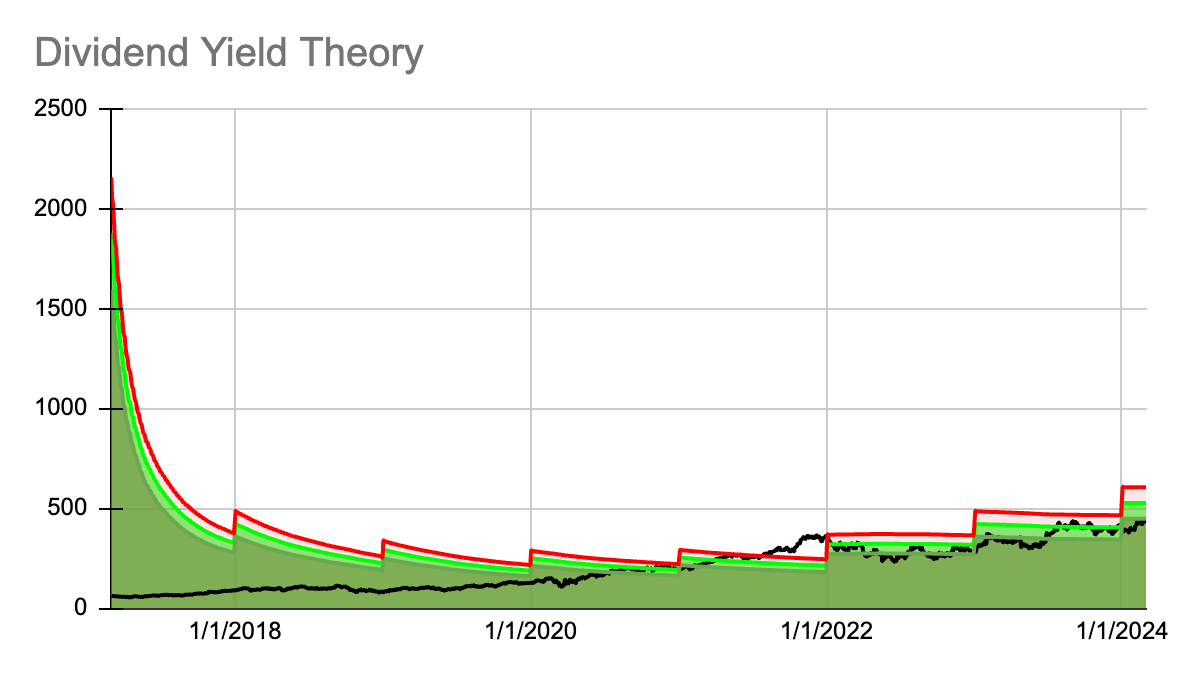
| Year | Dividend | Growth | CAGR |
| 2024 | 2.08 | 30.00% | |
| 2023 | 1.60 | 33.33% | 30.00% |
| 2022 | 1.20 | 50.00% | 31.66% |
| 2021 | 0.80 | 32.60% | 37.51% |
| 2020 | 0.60 | 33.09% | 36.26% |
| 2019 | 0.45 | 30.75% | 35.62% |
| 2018 | 0.35 | 30.00% | 34.80% |
| 2017 | 0.27 | 34.10% | |
| 2016 | |||
| 2015 | |||
| 2014 | |||
| 2013 | |||
| 2012 |
While this watchlist has produced some terrific investment ideas, it has also pointed out some awful stocks along the way. Four of the stocks presented during the last 42 months have gone on to lose more than 50%. A watchlist, much like an index, includes both good and bad companies. It's very difficult to create an automated stock selection strategy that only produces great ideas. However, rather than focusing on the few bad apples that have appeared on this list, let's shed a little light on its success. Seven stocks identified by this process have gone on to produce returns in excess of +100% and fifteen more have generated returns in excess of 50%.
I have used this list to find many great stocks that I have added to my personal portfolio, but I encourage you to simply use it as a starting point for further research. The watchlist aims to find the best combination of high quality companies trading for attractive prices. It's based purely on quantitative data and therefore may not consider important qualitative factors that may impact future returns.