
Chunumunu
Chunumunu
My last article about Morningstar, Inc. (NASDAQ:MORN) was published in July 2023, and I argued that the stock was still too expensive and rated the stock as a "Hold". However, in the last few months, Morningstar not only increased together with the overall market, it gained almost 40% and clearly outperformed the S&P 500. Despite being wrong in the last few months, I remain extremely cautious about Morningstar as an investment.
Morningstar will report its full-year results on February 22, 2024, and after the market was rather disappointed by the results of Moody's Corporation (MCO) as well as S&P Global (SPGI), let's take a look at Morningstar and what we can expect. In the following article, I will explain why I think we should be rather cautious about Morningstar - and not only for the upcoming earnings.
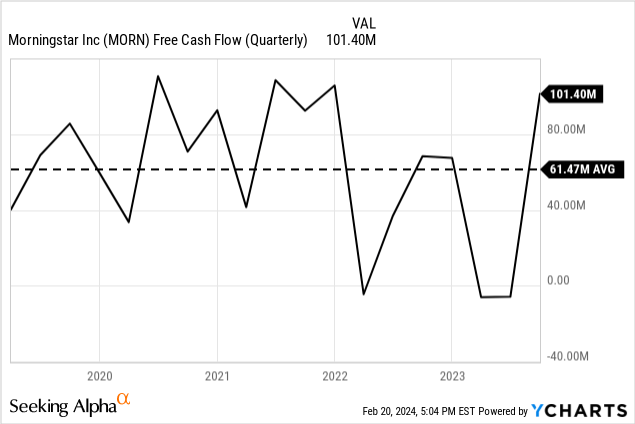
Before trying to answer the question of what to expect for the full-year results, we can start by looking back at third quarter results. Revenue increased from $468.2 million in Q3/22 to $515.5 million in Q3/23 - resulting in 10.1% year-over-year top-line growth. Operating income more than tripled from $22.0 million in the same quarter last year to $70.0 million in this quarter. However, when looking at the quarterly results in the last few years, Q3/22 was rather the outlier and the current quarter was just in line with most quarters in 2021, for example. And instead of a loss per share of $0.21 in Q3/22, Morningstar could report earnings per share of $0.91 in Q3/23. And finally, free cash flow increased 48.2% YoY from $68.4 million in Q3/22 to $101.4 million in Q3/23.
Morningstar Q3/23 Presentation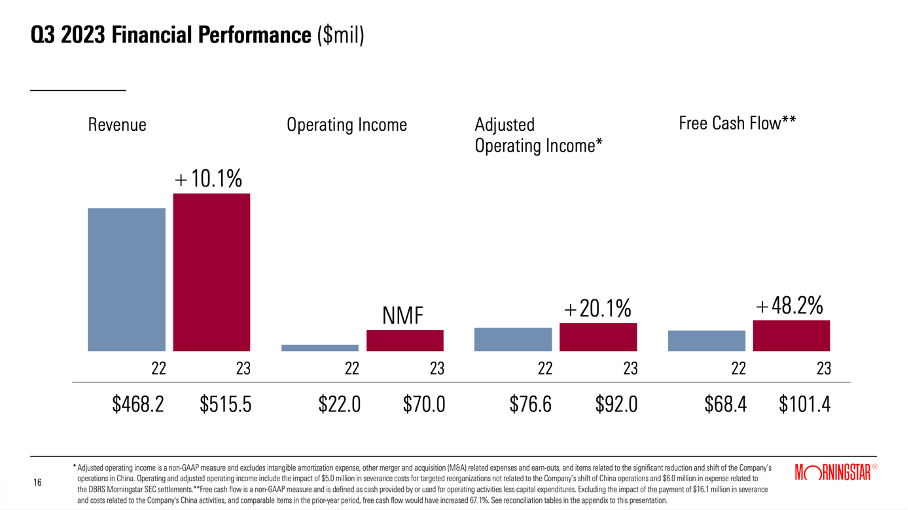
When looking at the three different types of revenue, Morningstar is reporting, especially transaction-based revenue was struggling. Revenue increased only 2.1% YoY to $59.5 million. Licensed-based revenue, on the other hand, increased 12.2% YoY to $384.5 million and asset-based revenue increased 6.2% YoY to $71.5 million.
About two weeks ago, two of Morningstar's major peers - Moody's and S&P - already reported full-year results and investors of the two major credit rating agencies were rather disappointed by the results. To be more precise, investors did not seem disappointed by the quarterly results (which were actually quite good), investors were probably disappointed by the guidance for fiscal 2024 (and maybe Moody's missing EPS estimates).
For fiscal 2024, Moody's Corporation is expecting revenue to grow in the high single digits or low double digits, with Moody's Investor Services growing in a similar range and Moody's Analytics growing about 10% once again. Free cash flow is expected to be in a range between $1.9 billion and $2.1 billion, which could result in double-digit growth when taking the higher end of the guidance.
Moody's Corporation
The problem - and the reasons investors were dumping the stock - was probably the guidance for earnings per share. In fiscal 2024, diluted adjusted earnings per share are expected to be in a range of $9.45 to $10.20 and compared to $9.90 in adjusted EPS in fiscal 2023 this would result in 3% growth in the best case and 4.5% decline in the worst case. And these are not the growth rates Moody's reported in the past, and certainly not enough to justify the current share price (we will get to this).
S&P Global, on the other hand, is expecting revenue in fiscal 2024 to increase between 5.5% and 7.5%. Diluted earnings per share are expected to be in a range of $10.70 to $10.95 (on a GAAP basis), which would result in 30% to 33% year-over-year growth. Adjusted earnings per share are expected to be in a range of $13.75 to $14.00 - resulting in 9% to 11% year-over-year growth for the bottom line.
S&P Global Q4/23 Presentation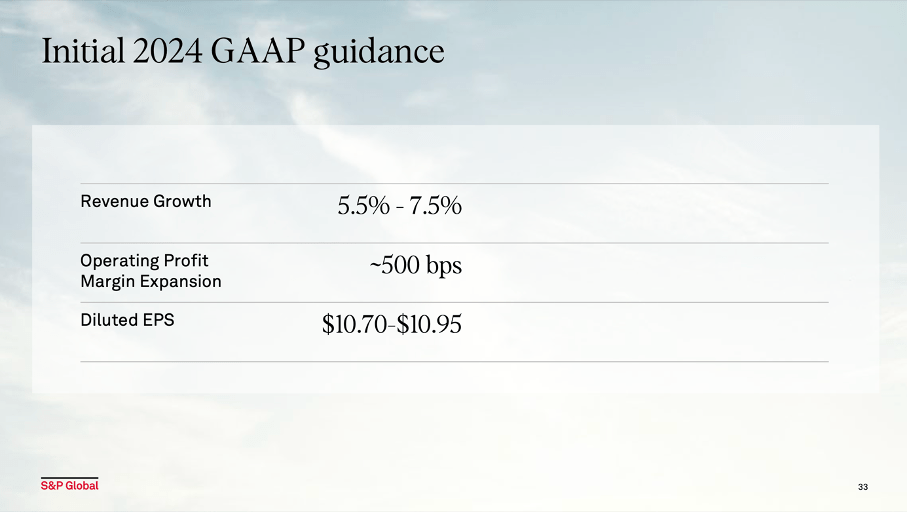
And especially on a GAAP basis, S&P Global is expecting margins to improve about 500 basis points. Overall, I would not see the guidance of S&P Global as disappointment - the stock declined nevertheless as the guidance was obviously softer than expected.
When looking at some of the major peers of Morningstar, we can - aside from the two credit rating agencies - mention companies like FactSet Research Systems Inc. (FDS) or MSCI Inc. (MSCI). Of course, it will be rather difficult to find the perfect peer, as every business is a little different. In case of Morningstar, the credit rating business is not playing such a huge role as Moody's Corporation (where it accounts for about half of revenue). The business of S&P Global is coming close to Morningstar: The segments market intelligence, global ratings, as well as indices, seem quite comparable to Morningstar's business segments. Of course, revenue distribution will be different, and comparisons are seldom perfect (Mastercard (MA) and Visa (V) might be an example of two almost perfect peers).
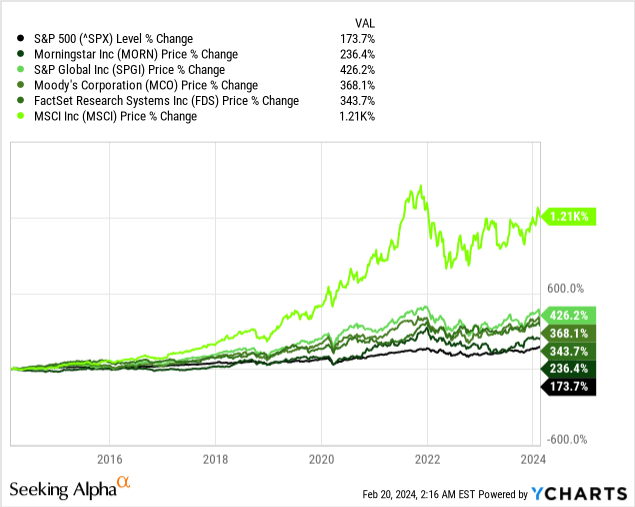
First, the financial services stocks mentioned here were all great investments in the past bull market and clearly outperformed the S&P 500 and made investors a lot of money. But in the recent past, the performance of these stocks rather lagged. Since the peak in late 2021 or early 2022, the five financial service companies all underperformed the S&P 500.
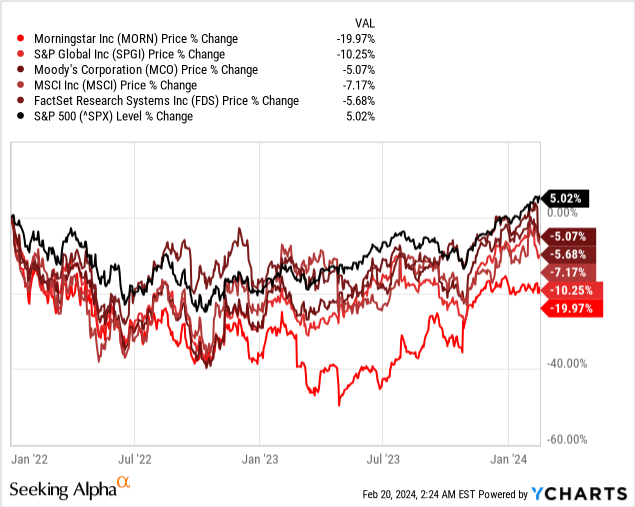
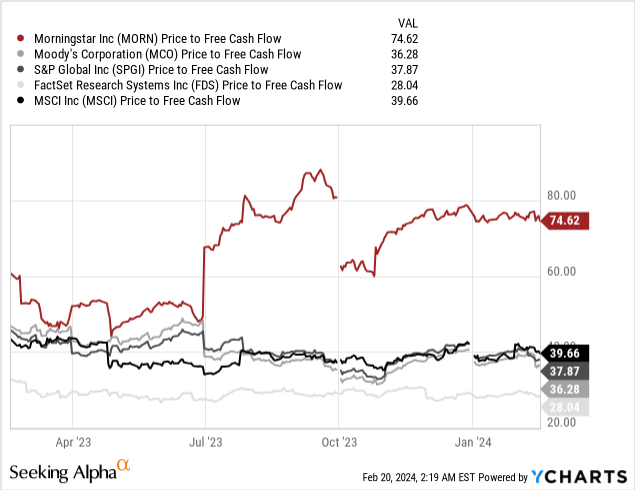
And there might be a reason - all the stocks are trading for rather high (or in some cases absurdly high) valuation multiples. Even now, most of the stocks are still trading for 30 to 40 times free cash flow (with Morningstar being the negative exception) and in late 2021, valuation multiples were even higher.
I already mentioned in my recent article about Moody's Corporation that a potential depression and phase of deleveraging could be a problem for Moody's Corporation and S&P Global. It could also be a problem for Morningstar - however, the company would be less affected as DBRS Morningstar (the credit rating agency) generated only $269.5 million in revenue in fiscal 2022 (14.4% of total revenue).
And although Morningstar is generating only a smaller part of total revenue from credit ratings, we should not underestimate the negative effect such a deleveraging process could have. In my Moody's article, I wrote:
The major problem is that such a deleveraging process is not like a recession. In case of a recession, we will see declining revenue and declining EPS maybe for a few quarters (or for a few years in the worst case). In case of a depression and long-lasting phase of deleveraging we are rather talking about one or two decades such a scenario could last. Additionally, as I have already pointed out in my last article, Moody's is usually reacting to "normal" recessions with revenue, earnings per share and free cash flow declining.
Morningstar Q3/23 Presentation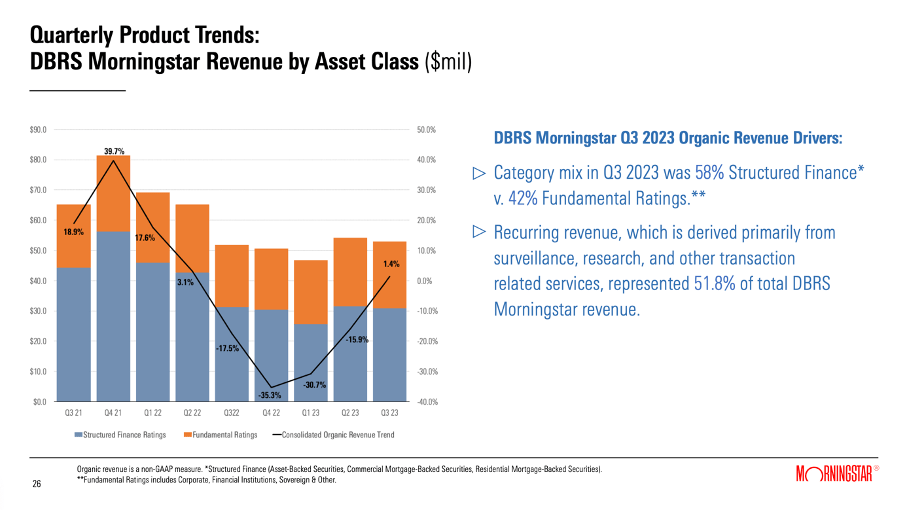
And we already see in the last two years that revenue from DBRS Morningstar declined - most likely due to higher interest rates.
And not only transaction-based revenue will be affected. Asset-based revenue would also be affected by a potential bear market - that will most likely go hand-in-hand with a phase of deleveraging. A bear market is also more likely, as the extremely high valuation multiples increase the risk of declining stock prices in the coming years.
Asset-based revenue is generated from Investment Management, Morningstar Retirement (formerly Workplace Solutions) and Morningstar Indexes, and all three are negative affected by declining prices. These asset-based fees are often a percentage of the assets under management and during a bear market, assets under management will decline (not only due to lower asset prices but also due to customers pulling funds). When looking at the last few quarters, we saw AUM decline in 2022, but in the last few quarters the situation improved again.
Morningstar Q3/23 Presentation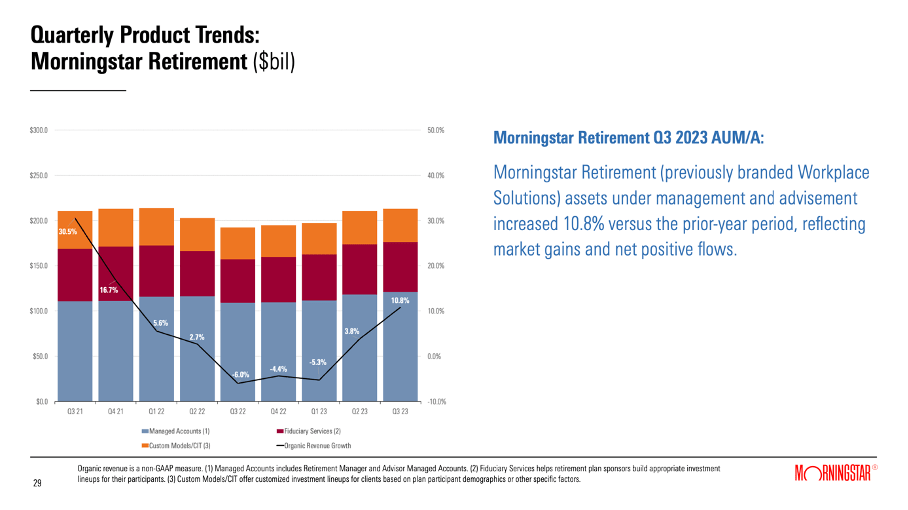
We can also argue that asset-based revenue was responsible for 14.1% of total revenue in fiscal 2022 ($264.9 million) and are also not paying such a huge role for the overall business. However, asset-based revenue and transaction-based revenue combined make up for almost 30% of total revenue and should certainly not be ignored.
And if we like to see a little positive news as well here, we can point out that licensed-based revenue might actually be quite sticky and the risk for declining revenue (or stagnating revenue) is much lower. In fiscal 2022, licensed-based revenue was $1,331.7 million and out of $1,870.6 million overall, it is responsible for 71.2% of total revenue.
Revenue from these products is mostly generated by (annual) subscriptions, and here are switching costs for the customers involved. A company will think long and hard about switching to the product of a competitor as it probably has to train its staff on the new program, and the process of switching all the data might also generate problems and lead to additional costs. When looking at Morningstar Data, we see solid growth rates around 10% almost every quarter. And in case of Pitchbook, we see growth rates slowing down, but still double-digit growth.
Morningstar Q3/23 Presentation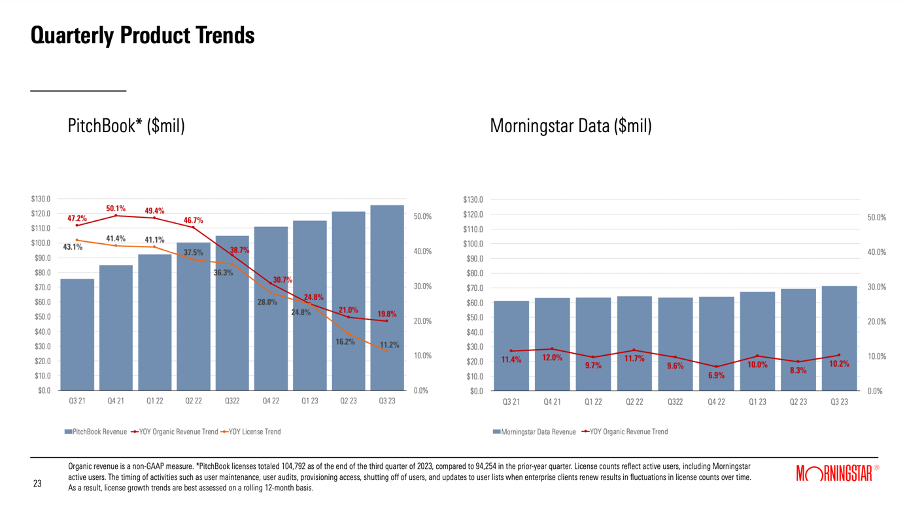
On the other hand, in case of a recession and deleveraging process (if the worst case should happen), the demand for market data and the volume of new debt issuance will decline. People will be less interested in investing and some companies (customers of Morningstar) will go out of business or cut their staff - therefore the company will need less subscriptions and licenses. This will lower revenue for Morningstar in this segment as well.
Morningstar already lagged the performance of several of its peers in the last two years, and the stock is still trading for extremely high valuation multiples (see section above). Based on this information, we can't really be bullish about Morningstar, as there seems to be little upside potential. But knowing that Morningstar struggled in the last few quarters (and even had to report a loss in some quarters) it is no surprise for the stock to trade for high valuation multiples (as low earnings per share can lead to high valuation multiples).
However, when using a discounted cash flow calculation, we also come to the conclusion that Morningstar is overvalued. As always, we calculate with a 10% discount rate, and we are using the last reported number of outstanding shares (42.9 million). But now, when making assumptions about the amounts of free cash flow and growth rates we use, it gets a little trickier. We could use the free cash flow of the last four quarters ($157 million) however after the free cash flow has constantly been declining in the last few quarters that amount is maybe not representative of the business. On the other hand, we could use the FCF at the peak in 2021 ($348 million) but that number might also be misleading. And we should probably use neither too optimistic nor too pessimistic assumptions for free cash flow.
And for growth rates, we could ask similar questions: What growth rates are realistic for Morningstar in the years to come - especially when considering the major risk of a bear market and deleveraging. At least between 2005 and 2021, Morningstar could grow its earnings per share with a CAGR of 24.36%, but that is cherry-picking of numbers. Free cash flow between 2006 and 2021 increased with a CAGR around 15%. But once again, these assumptions might be too optimistic and when looking at the growth numbers Morningstar currently is reporting, we see a CAGR of 11.01% for the last ten years. Earnings per share, on the other hand, declined with a CAGR of 2.89% in the last ten years.
In my opinion, we can use the average free cash flow of the last five years ($245.88 million on average) which could be a realistic assumption. We can also assume Morningstar will be able to grow in the high single digits in the next ten years (9% growth) followed by 6% growth until perpetuity. These are still optimistic assumptions, but somehow reflecting the risks described above.
Nevertheless, we still get an intrinsic value of $190.18 for Morningstar and the stock is overvalued at this point and Morningstar is still not a good investment in my opinion.
Going into the earnings release on Thursday, I would be very cautious about Morningstar. I am not necessarily expecting a huge drop on Thursday following earnings, but I don't see much upside potential in the coming quarters either (and it is not my style of investing - or trading - to buy stocks for a 5-10% potential gain).
As a shareholder, I don't know if you should sell, as the investment could work out if you are focusing on the long term (at least 10 years). But considering the combination of high valuation multiples and the risk of disappointing results - similar to Moody's Corporation and S&P Global - it would probably not be the worst idea to trim the position. And I certainly would not buy Morningstar at this point. The stock is still overvalued in my opinion, and financial services companies could face difficult times in the coming quarters or years.