
Andrii Dodonov
Andrii Dodonov
Per Markel Group Inc.'s (NYSE:MKL) 2019 annual report, their first engine is insurance, the second is Markel Ventures, and the third is investments.
The insurance engine struggled in 2023. Markel's consolidated combined ratio increased from 92% in 2022 to 98% in 2023 and consolidated underwriting profits dropped from $627 million in 2022 to $133 million in 2023. Nonetheless, the insurance engine from 2023 isn't the whole picture. The Markel Ventures engine and the investment engine are doing well, and I believe the insurance engine will recover from challenges faced in 2023. My thesis is that the heavy buyback activity from the last 3 years is a good sign. Among other things, the buybacks show management's confidence in the 3 engines.
My valuation approach and terminology come from the framework CEO Tom Gayner has used over the years. Throughout this article, I use the phrase "investment portfolio" to talk about the value of the investment engine and most of the insurance engine (apart from some insurance cylinders like insurance-linked securities ("ILS") and other insurance considerations like program services). Spelling this out, the 2019 annual report itemizes the cylinders of the insurance engine and the first 2 go in my "investment portfolio" valuation bucket (emphasis added):
Engine #1 - Insurance (Insurance, Reinsurance, Insurance-Linked Securities, and Program Services)
Again, the way I value this first engine is split. The balance sheet investment portfolio valuation captures insurance and reinsurance from this first engine along with the entire investment engine. I use a multiple on earnings power instead of the balance sheet to value the remaining cylinders of this first engine - insurance-linked securities ("ILS") and program services. I also use an earnings power multiple as opposed to the balance sheet in order to value engine number 2, Markel Ventures. I often refer to Markel Ventures as just Ventures throughout this article.
Having capital discipline for many decades, Markel does not buy back shares unless they are at attractive price levels relative to valuation. Per the 2020 annual report, there are 3 priorities ahead of buybacks (emphasis added):
For many years we've followed a four step triage on how we allocate capital. Our first priority is to support our existing businesses. We prefer to fund people who are already part of Markel and who have already proven their skills and abilities. Our second priority for capital is to acquire new businesses to expand the scale and resiliency of Markel. Our third priority for capital is to acquire publicly traded equity securities. Our fourth priority is to repurchase our own stock when we believe our shares to be trading below a reasonable estimate of intrinsic value.
Having to issue preferred shares in 2020 was unfortunate, but buybacks of the common stock have picked up nicely since that time ($ in millions):
Markel buybacks (Author's spreadsheet)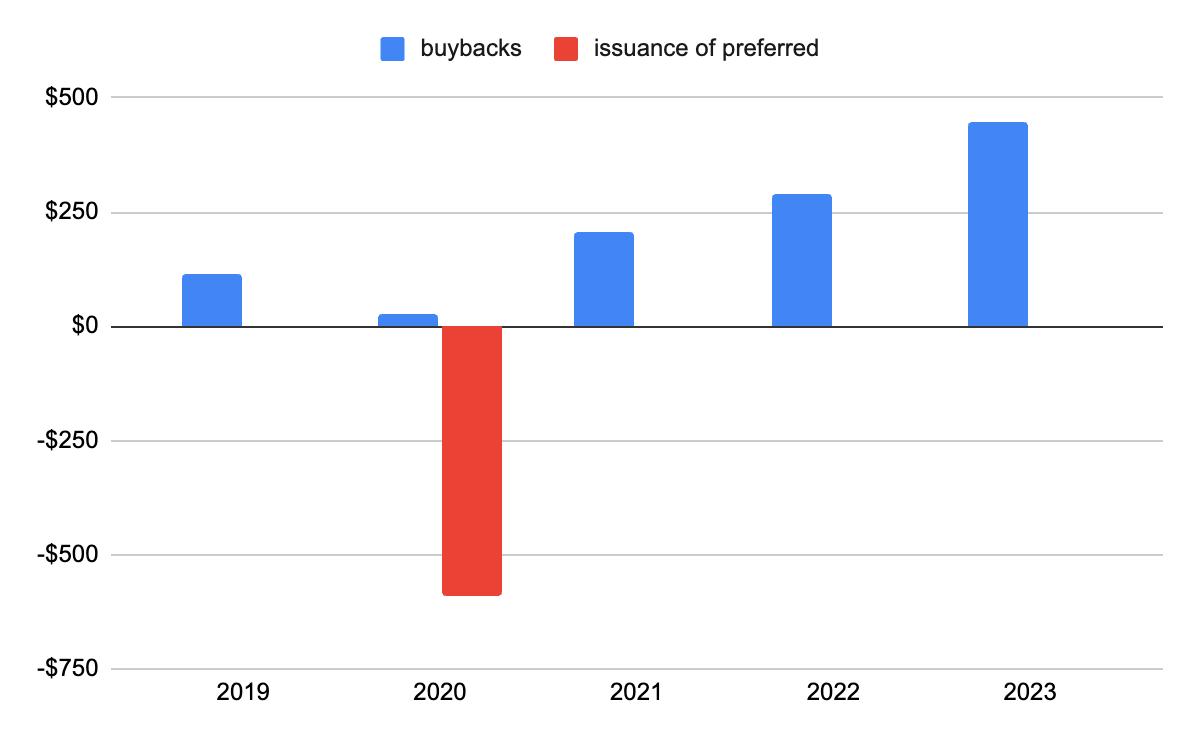
Putting buybacks in perspective, the 2020 annual report shows a common share count of 13,783,813 as of February 2, 2021. Three years later, the 2023 10-K shows the common share count went down nearly 5% to 13,110,035 as of January 31st.
Per the 4Q23 release, Markel's book value per common share had a five-year CAGR of 11% through December 2023. Sometimes book value and shareholders' equity are also mentioned without the "per share" consideration and CEO Gayner has talked about Marriott International, Inc. (MAR) having negative book value because of their buybacks. We see this with Marriott's 2023 balance sheet; the $20.9 billion in their "Treasury stock, at cost" balance sheet line destroys book value. Given the way Markel has focused on book value in the past and the way buybacks can lessen book value and shareholders' equity, I don't think Markel would be buying back a substantial amount of stock unless it was priced very attractively.
CEO Gayner is considered to be one of the investing greats, so it is also noteworthy that he has talked about buying Markel shares personally in recent quarters.
I like the way a February 2023 Seeking Alpha article talks about CEO Gayner's thought process with respect to a sum of the parts valuation. CEO Gayner explains his valuation method well in the Shareholders Meeting from May 2022 while showing the key numbers on a slide. Repeating Founding Father Patrick Henry's "I know of no way to judge the future but by the past" quote, CEO Gayner likes to look back at historical numbers while making bets about the future. CEO Gayner points out that Johnnie Walker Black Label is aged for at least 12 years, and we have a slide looking at Markel in 12-year increments. The 2022 numbers for the last 12-year increment weren't available at the time of the meeting, but assumptions were made from the 2021 numbers:
Markel in 12-year increments (May 2022 meeting)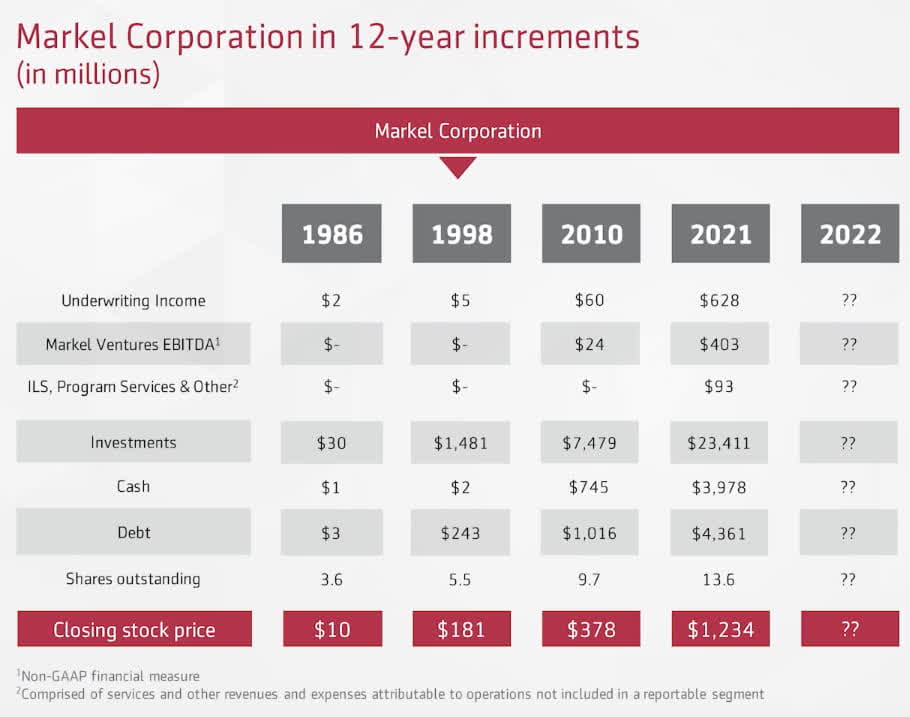
The numbers for "Investments" above come straight from the "Total Investments" line on the balance sheet. This figure is $23,411 million for 2021, $22,198 million for 2022 and $26,522 million for 2023. The "Cash" numbers above are also straight from the balance sheet, specifically from the "Cash and cash equivalents" line whose values are $3,978 million for 2021, $4,137 million for 2022 and $3,747 million for 2023. Wrapping up the balance sheet considerations above, the "Debt" numbers are from the "Senior long-term debt and other debt" line, and they are $4,361 million for 2021, $4,104 million for 2022 and $3,780 million for 2023.
Per the slide above, there was no value for Markel Ventures EBITDA or for ILS, Program Services & Other in 1986. As such, CEO Gayner's valuation method back then was simply to use the balance sheet approach in order to add investments and cash and then subtract debt (emphasis added):
If I were valuing the company, I would make the assumption that Markel would operate with an underwriting profit and that the insurance business would grow over time. If I believed that was true, I could simply take the total Investment Portfolio, subtract out the debt and divide that sum by the number of shares outstanding. That math would yield a suggestion of what each share of Martel would be worth.
Rolling into 1998, underwriting income did indeed grow. This same framework could be employed again for the 1998 period. CEO Gayner made a remark about him and Richie Whitt becoming co-presidents of Markel rolling into 2010. Also, the Ventures business was now in the picture with EBITDA of $24 million. In 2010, CEO Gayner started adding a valuation consideration for Ventures based on an EBITDA multiple.
Per another slide in the May 2022 meeting, Markel's stock has done well over long periods of time. It went up a prodigious 18x from $10 at the end of 1996 to $181 at the end of 1998. From there it went up 2x to $378 at the end of 2010. It then went up 3.5x to $1,317 at the end of 2022. Markel went public in 1986 and those investors who bought shares at the end of the year at $10 each had the opportunity to do extremely well if they didn't sell. Anyone holding on until the stock reached $1,139 at the end of 2017 got more than a 100-bagger:
Markel's historical stock price (May 2022 meeting)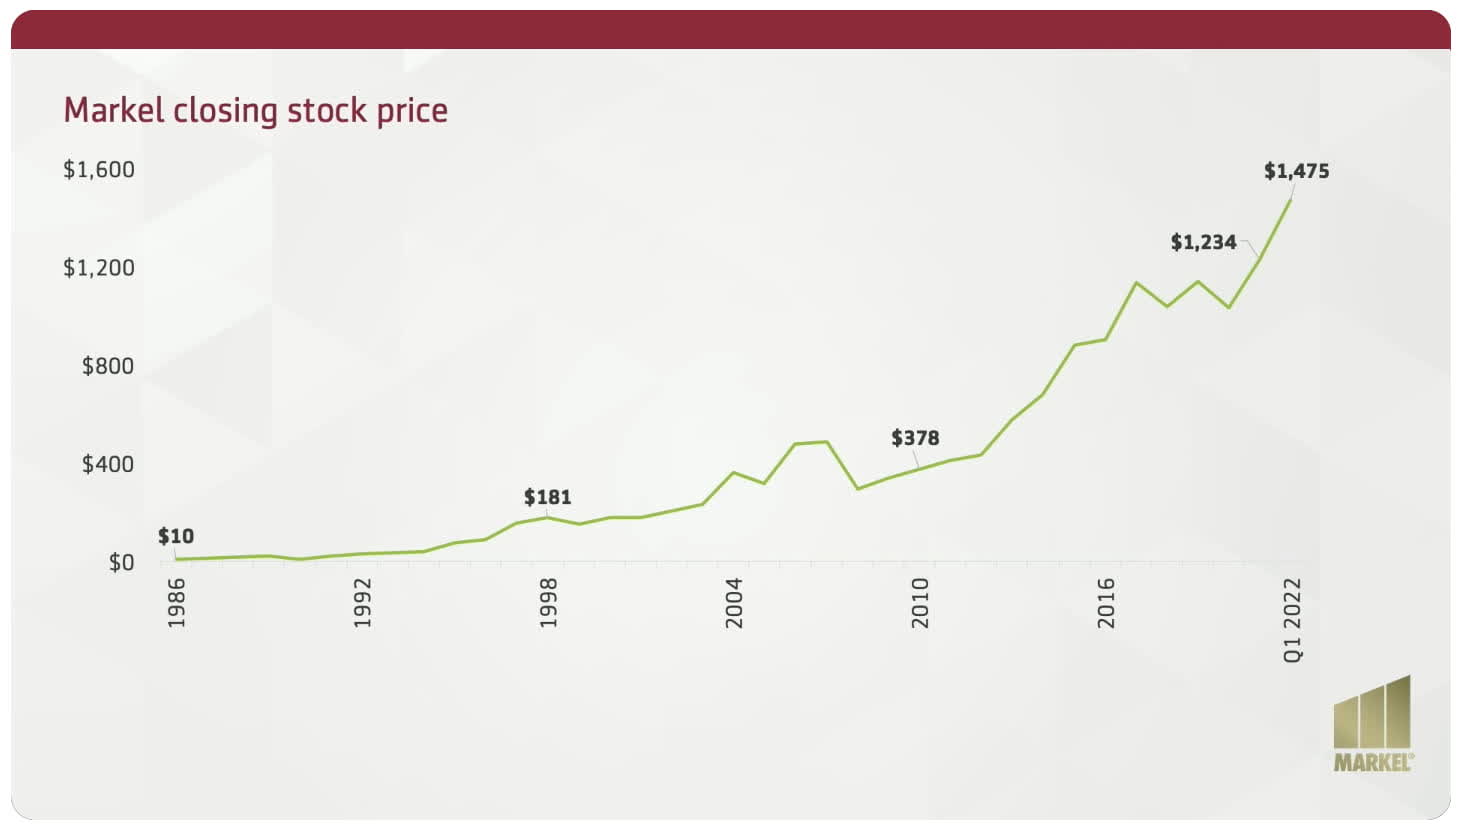
My valuation framework is very close to the one CEO Gayner laid out above. One of the reasons for this is because CEO Gayner knows the business better than anyone and his valuation thoughts are repeated in his letter to shareholders inside the 2022 annual report which came out in the spring of 2023 (emphasis added):
If you were valuing a fruit tree, the value is the present value of the fruit the tree will produce over time. Same thing with our investment portfolio. As such, we simply take the total value of our investment portfolio and subtract out all debt, to get an indication of the value of the balance sheet part of Markel. Another important part of estimating an indication of the value of Markel stems from the earnings power of our Insurance and Markel Ventures operations. We take the normal, annualized earnings from those operations and multiply that by a consistent and reasonable multiple year-by-year. That process provides an indication of the total value of Markel's income statement. Then we add those two parts together to determine our own sense of what each share of Markel is worth.
Markel's share price going back in time is given near the top of each annual report. Here are the numbers from 2015 to 2023 as presented in the 2023 letter:
Financial highlights (2023 letter)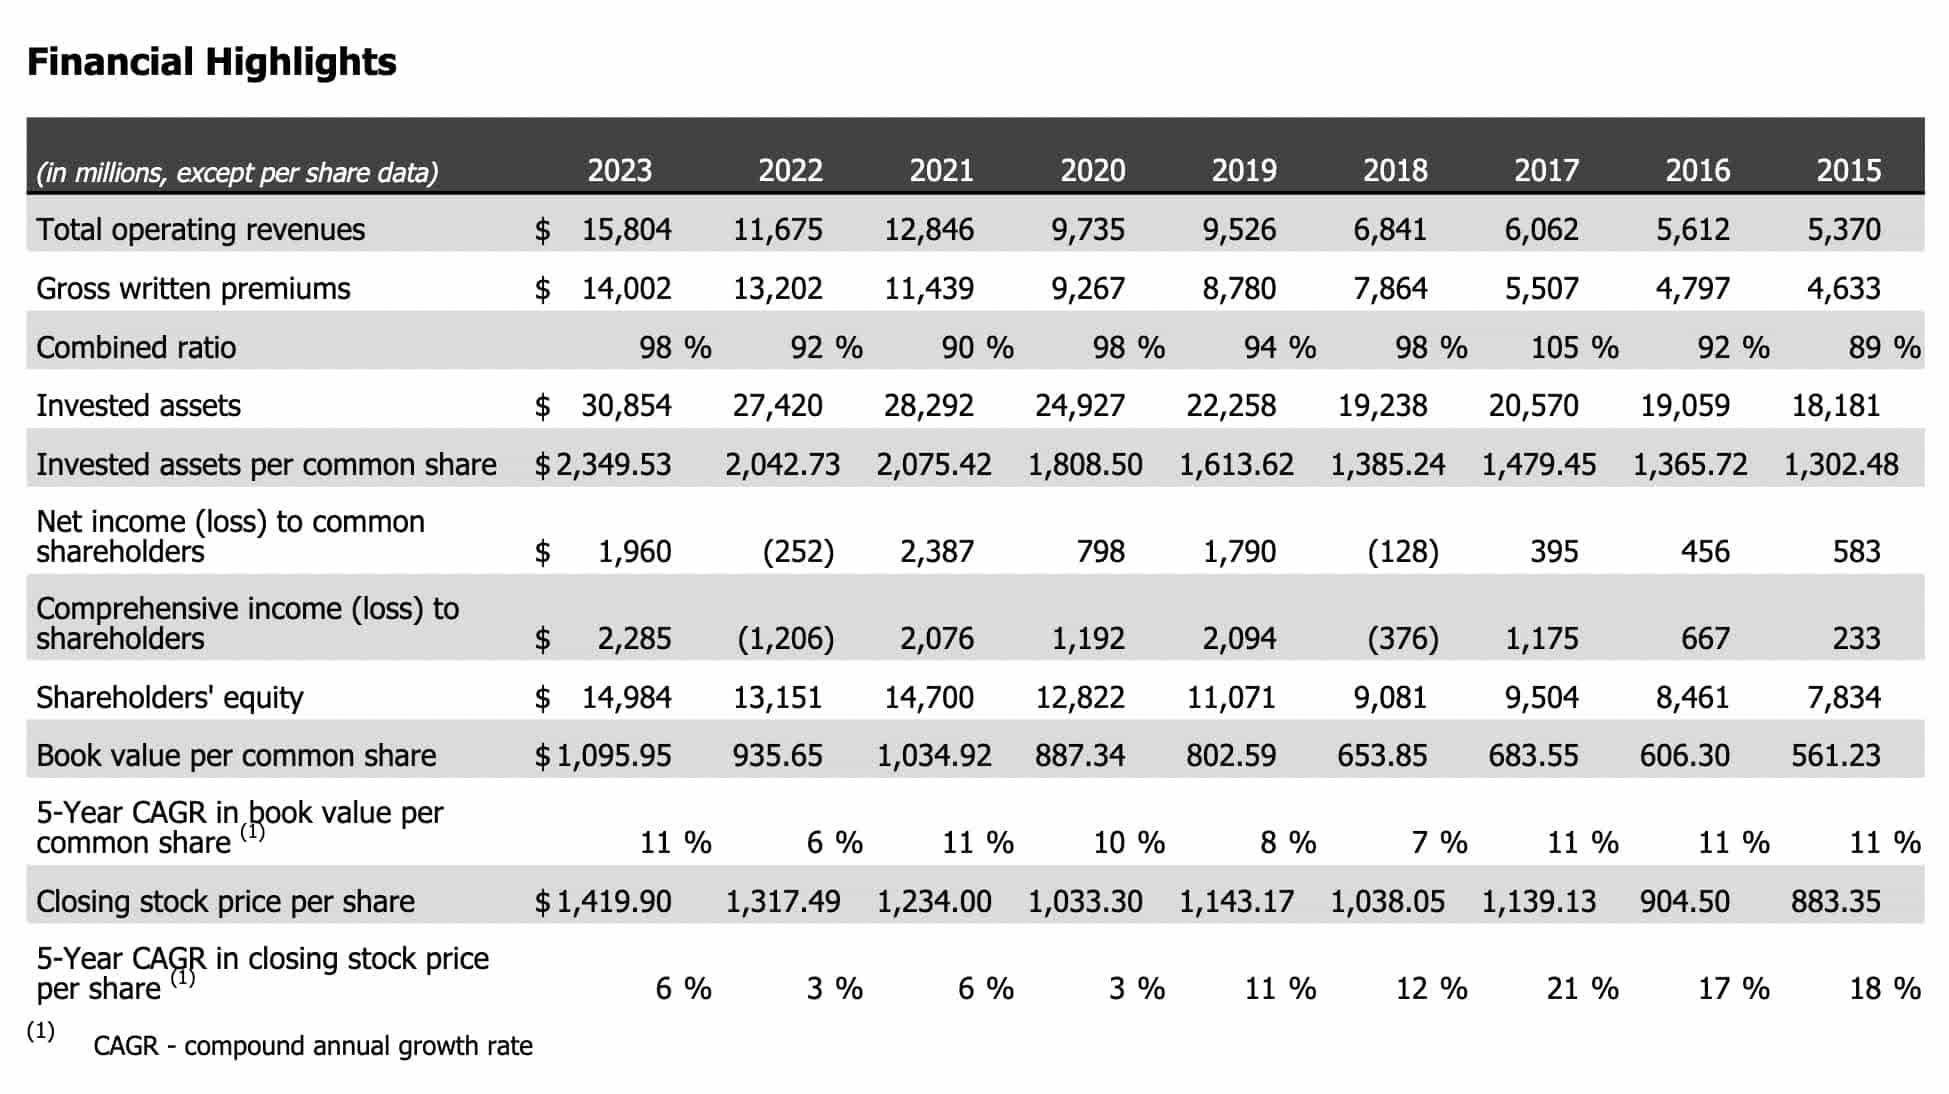
I like to look at key considerations like the investment portfolio over the years in a spreadsheet. Again, using 2023 as an example, we arrive at the $26,489 million investment portfolio figure by going to the balance sheet and taking the $26,522 million total investments line and adding the $3,747 million cash line. We then subtract the $3,780 million senior long-term debt line (in millions except share price and investments/share):
| share price | inv. portfolio per share | share price % of inv. port. | shares | investment portfolio | common market cap | |
2010 | $378 | $771 | 49% | 9.7 | $7,479 | $3,668 |
2011 | $415 | $774 | 54% | 9.6 | $7,434 | $3,981 |
2012 | $433 | $817 | 53% | 9.6 | $7,840 | $4,161 |
2013 | $580 | $1,041 | 56% | 14 | $14,570 | $8,125 |
2014 | $683 | $1,133 | 60% | 14 | $15,861 | $9,560 |
2015 | $883 | $1,107 | 80% | 14 | $15,500 | $12,367 |
2016 | $905 | $1,153 | 78% | 14 | $16,138 | $12,663 |
2017 | $1,139 | $1,235 | 92% | 13.9 | $17,168 | $15,834 |
2018 | $1,038 | $1,140 | 91% | 13.9 | $15,846 | $14,429 |
2019 | $1,143 | $1,326 | 86% | 13.8 | $18,297 | $15,776 |
2020 | $1,033 | $1,490 | 69% | 13.8 | $20,568 | $14,260 |
2021 | $1,234 | $1,693 | 73% | 13.6 | $23,028 | $16,782 |
2022 | $1,317 | $1,659 | 79% | 13.4 | $22,231 | $17,654 |
2023 | $1,420 | $2,022 | 70% | 13.1 | $26,489 | $18,601 |
One of the reasons the investment portfolio numbers have gone up over the years is because CEO Tom Gayner invests in wonderful companies at fair prices. I believe good results will continue in the future as the 2022 annual report explains the logic behind investment decisions (emphasis added):
In our equity operations, we continued to follow our four-part, time-tested, discipline. As you will find in this annual letter for decades, those four parts are to invest in profitable businesses with: one, good returns on capital and not too much debt; two, that are run by managers with equal measures of talent and integrity; three, with reinvestment opportunities and/or capital discipline, and; four, at reasonable valuations.
Per the spreadsheet numbers above, the share price was close to the investment portfolio per share from this balance sheet investment portfolio approach during the 2017 to 2019 period meaning the stock was not cheap by historical standards; it got a bit ahead of itself. Since then, the share price as a percentage of the investment portfolio has been at a lower level while the value of Markel Ventures and the other non-balance sheet considerations has gone up!
In other words, I believe this is a nice opportunity to invest in Markel when the stock isn't expensive by historical standards in terms of this framework. Over time, I think the share price as a percentage of the investment portfolio should go up as the Ventures segment becomes a bigger part of the picture. The share price was 70% of the investment portfolio per share for 2023 which is well below the range of 86 to 92% from 2017 to 2019 and the Ventures segment wasn't as meaningful to the overall economics back then.
The 4Q23 Giverny Capital Asset Management letter says Markel sometimes has trouble finding high-quality companies to buy at attractive prices such that it can be difficult to bring new companies into their Ventures segment. It also says Markel's insurance expense structure is high:
Meanwhile, in its insurance operations, Markel has an elevated expense structure - it spends about 33 cents of every dollar collected in premiums on its own overhead. Its leanest competitor spends 21 cents of every premium dollar on overhead. Markel's cost structure stems from an unwieldy technology stack that would be very expensive to upgrade. I have great respect for Markel, but the combination of middling investments and a challenging expense structure caused me to believe I could find better value elsewhere.
I'm not terribly worried about Markel not finding new companies to purchase for the Ventures segment. If limitations persist, then it means they'll allocate more capital to fractional ownership of public companies in the stock market. However, the point above about their insurance operations having an elevated expense structure is concerning. My valuation framework from CEO Gayner is the high end of the investment portfolio bucket and I wouldn't argue with investors who cite considerations like the above Giverny letter and discount this up to 25%. As such, my valuation range for the investment portfolio part of the business through 2023 is $19,867 to $26,489 million.
Like CEO Gayner, I use a multiple on earnings power for Ventures along with program services, insurance-linked securities ("ILS") and other groups.
There are many businesses in the Ventures group including the houseplant company, Costa Farms. The 10-K has an income statement and a summary cash flow statement for Ventures but the summary cash flow statement doesn't have itemized lines:
Statements for Ventures (2023 10-K)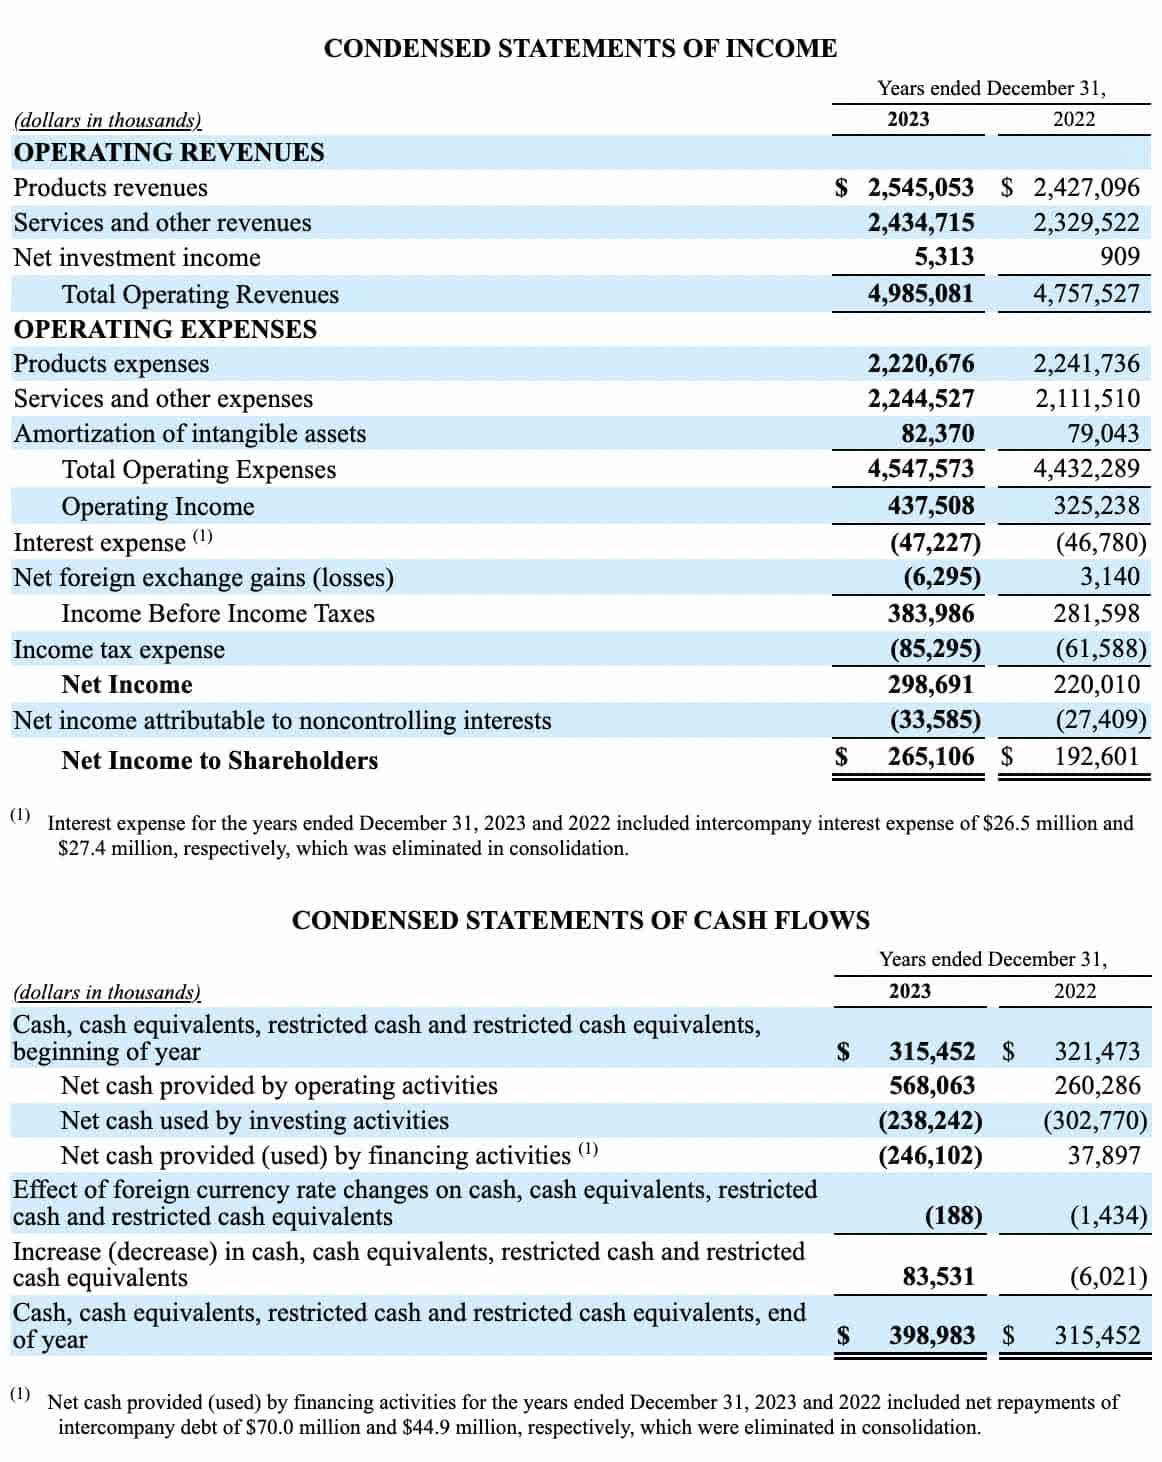
The 10-K also breaks down depreciation and amortization for Ventures:
Ventures EBITDA (2023 10-K)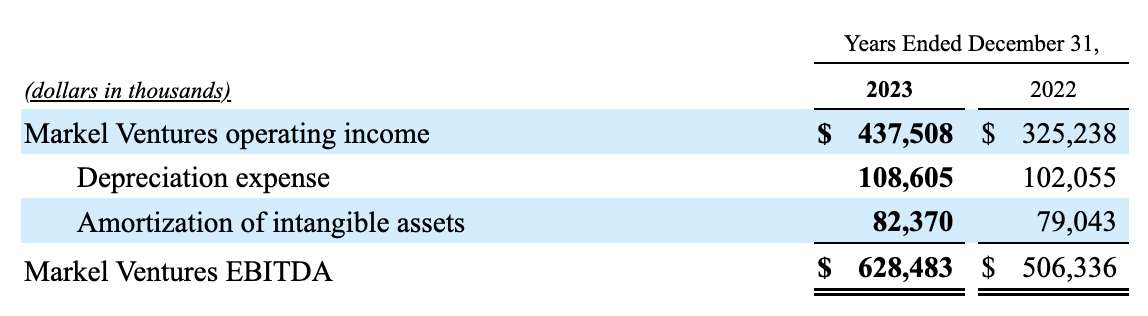
Per the income statement, Ventures had pretax income of $384 million on revenue of $4,985 million in 2023. These respective figures were $282 million and $4,758 million in 2022. Given the accounting requirements for purchase accounting, it's a good bet that the economic hit from amortization is less than the accounting hit which was $82 million in 2023 and $79 million the previous year. It would be wonderful if management could give us more color on the amortization for Ventures each year such that we have an idea about how much of the $82 million figure for 2023 is an accounting hit as opposed to an economic hit.
I wish management would do more to clarify the economics for Ventures. I can understand using pretax earnings with amortization backed out because the economics from the "A" for amortization often differ from the figures we see with purchase accounting. However, Markel uses EBITDA and the "I" for interest expense is important. We see above the accounting figure was $47 million for this in 2022 and 2023, but there is a footnote about intercompany components which were eliminated in consolidation. I would like it if this footnote was explained in more detail in the 10-K or the letter to shareholders. The "D" for depreciation is also important. Per the 2023 figures from the Ventures EBITDA table in the 10-K, depreciation was $109 million and amortization was $82 million. Another part of the 10-K says 2023 capex for Ventures was $221 million. These respective figures for 2022 were $102 million, $79 million and $225 million.
I'd like it if management would make it clear why the capex for Ventures is so much higher than the depreciation. It would be helpful to know what part of capex is composed of maintenance investments and what part is composed of growth investments.
Per the 2020 annual report, Markel cumulatively invested about $2.7 billion in the 15 years leading up to that time in order to buy the businesses within Ventures. It goes on to say a reasonable analyst would conclude the Ventures businesses are worth far more than the $2.7 billion paid. The 2023 letter gives an update on Ventures:
Since the launch of Markel Ventures in 2005, we've cumulatively written checks for acquisitions totaling roughly $3.7 billion. Over the same time, we've built up the cash and received dividends of roughly $1.9 billion from these operations. The Markel Ventures engine also fully funded all their capital expenditure programs and working capital needs. In rough justice math, that means we've got approximately $1.7 billion on the line for a set of businesses that produced $628 million of EBITDA on $5 billion in revenues last year.
It would be nice if management would explain the way they think about free cash flow ("FCF") for Ventures. Again, we don't see itemized cash flow statement lines above which bring us to the Ventures net cash provided by operating activities totals of $260 million for 2022 and $568 million for 2023. Per the comments above, we know capex for Ventures was $225 million in 2022 and $221 million in 2023. As such, if all the capex was hypothetically for maintenance instead of growth then hypothetical accounting FCF for Ventures would be $35 million for 2022 and $347 million for 2023. In a perfect world, we wouldn't have to work in terms of hypotheticals; rather than merely emphasizing EBITDA, it would be nice if management could provide more details.
Like any business, the Ventures segment is worth the amount of cash which can be pulled out of it from now until judgment day discounted back to today's dollars. This isn't the same thing as pretax income, but that is what I'm using at this time. A Ventures valuation of 10 to 12x the pretax income of $384 million implies a range of $3.8 to $4.6 billion. I could probably have a higher multiplier and a higher valuation for Ventures in the future if management were to do more in order to explain the economics and the future cash flow prospects. Hopefully, in the future management will make it more obvious to me how much of the amortization is from purchase accounting and how much is from economic realities.
The 2018 annual report describes the ILS business in more detail than other years, but there are still questions for outsiders. Per the 2018 annual report, Markel received inquiries from U.S. and Bermuda authorities about CATCo loss reserves recorded in late 2017 and early 2018. Ultimately, CATCo operations ceased in 2019. The 2018 annual report describes the ILS business in detail. One of my takeaways is that the ILS business is a lot like the reinsurance business, but ILS coverage isn't tied to specific coverage or policies. Additionally, this ILS quote from the 2018 annual report about the manager providing only a small, if any amount of the capital helps clarify why a balance sheet approach isn't used for valuation:
The bulk of the capital comes from the investors, and the ILS manager earns management fees, as well as performance fees based on outcomes.
Non-GAAP operating income for the ILS and other groups excluding underwriting, amortization of intangibles and goodwill impairment went from $92.6 million in 2021 to $302.1 million in 2022 to $215.4 million in 2023:
ILS financials (4Q23 release)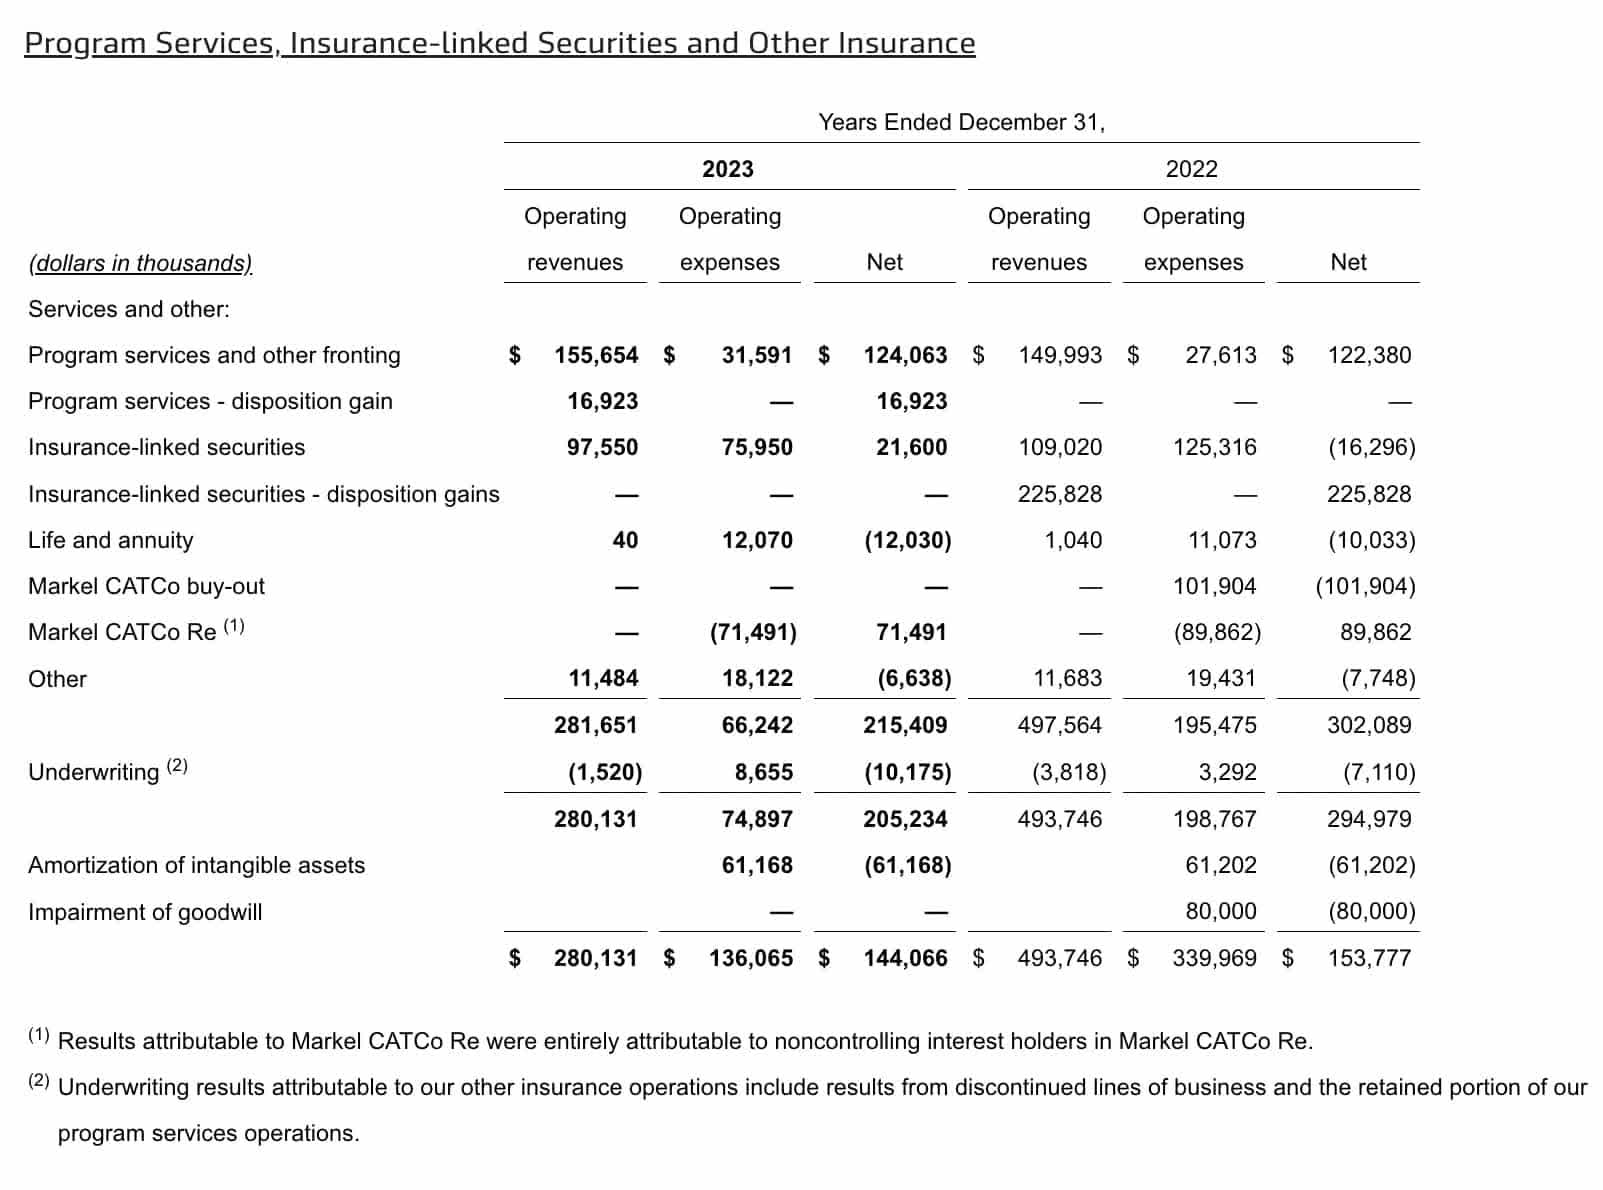
The figures for ILS groups jump around a lot. Per the 2022 annual report, these groups had cumulative operating losses of $28 million from 2013 to 2017 and their cumulative operating income from 2018 to 2022 was just $104 million.
Given the volatility in the ILS space and the way CATCo operations ceased, I'm hesitant at this time to apply a multiple of more than 4 to 5x to the 2023 figure of $215.4 million, implying a valuation range of $0.9 to $1.1 billion.
My sum of the parts valuation is as follows:
$19.9 billion to $26.5 billion investment portfolio.
$4.7 billion to $5.7 billion Markel Ventures and ILS groups.
-----------------------------------------------------------------
$24.6 billion to $32.2 billion.
The $600 million in preferred shares described in the 2020 annual report need to be addressed:
In May we raised $600 million of preferred equity to increase the conservatism and heft of our balance sheet and to help fund our growth opportunities. The preferred stock is callable beginning in 2025.
Some investors say the preferred shares should be added to the common market cap or else subtracted from the investment portfolio like other debt. One reason I haven't done either is because of accounting considerations regarding Hagerty, Inc. (HGTY) which have historically under-reported Markel's economic interest. I think the preferred shares and Hagerty type accounting considerations may come reasonably close to being a wash.
Per the 2023 10-K, there were 13,110,035 shares outstanding as of January 31st. Multiplying by the March 4th share price of $1,483.75 gives us a market cap of about $19.5 billion. The market cap is less than my valuation range, so I think Markel Group Inc. stock is a buy for long-term investors.
Disclaimer: Any material in this article should not be relied on as a formal investment recommendation. Never buy a stock without doing your own thorough research.