
andresr
andresr
Last week was exciting for anyone who owns Nvidia (NVDA).
Bloomberg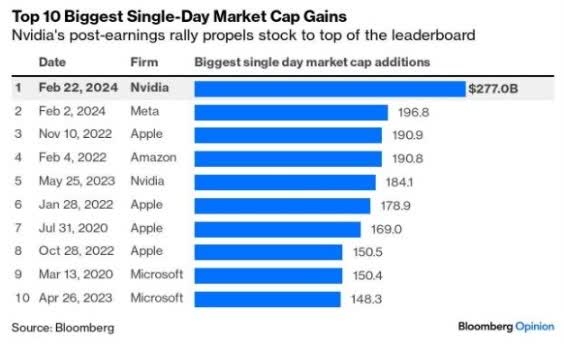
While that rally was largely justified by fundamentals, I understand how all the media hype about AI and NVDA, in particular, has a lot of investors, especially value and income investors, nervous about stocks right now.
There are plenty of doomsday permabears out there saying this is another tech bubble and another 50%-plus market crash is just around the corner.
I could debunk that claim, but I don't have to.
During the tech bubble, the S&P hit a 50% historical premium on forward PE, and on a trailing 12-month PE, the Nasdaq hit a record 200X.
That means the market was pricing 200% annual growth for the foreseeable future for tech stocks linked to the Internet.
Earnings tripling year after year after year was what was priced into the Nasdaq 100 at the March 2000 peak.
Does any reasonable investor think three times earnings growth for over a year or two is possible? Not really, it was pure speculation, the "greater fool" theory at work, in all its silly and destructive splendor.
But guess what? The very speculative nature of the bubble created opportunities for smart investors to keep buying amazing companies throughout the bubble.
Ycharts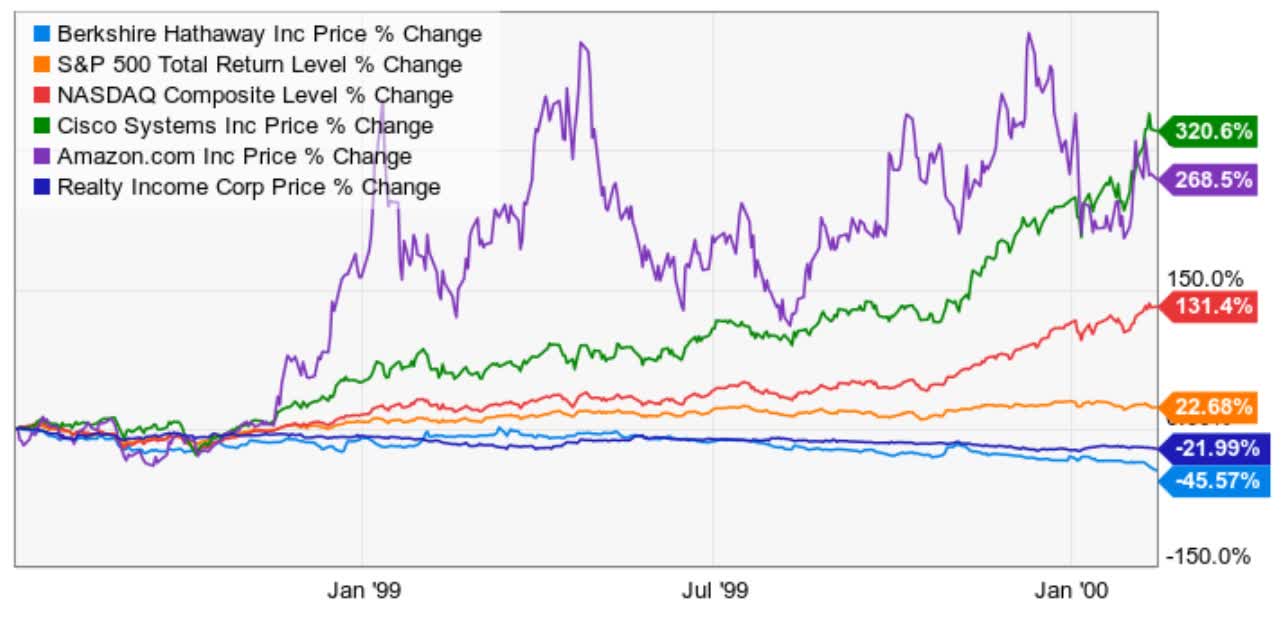
It's always been and will always be a market of stocks, not a stock market. Did you know that Berkshire (BRK.A) (BRK.B) was almost cut in half during the last three years of the tech bubble?
Or that amazing income payers like Realty Income (O) fell by more than 20%?
"To heck with value or dividends, all you need is growth!" was the rallying call of the day.
Ycharts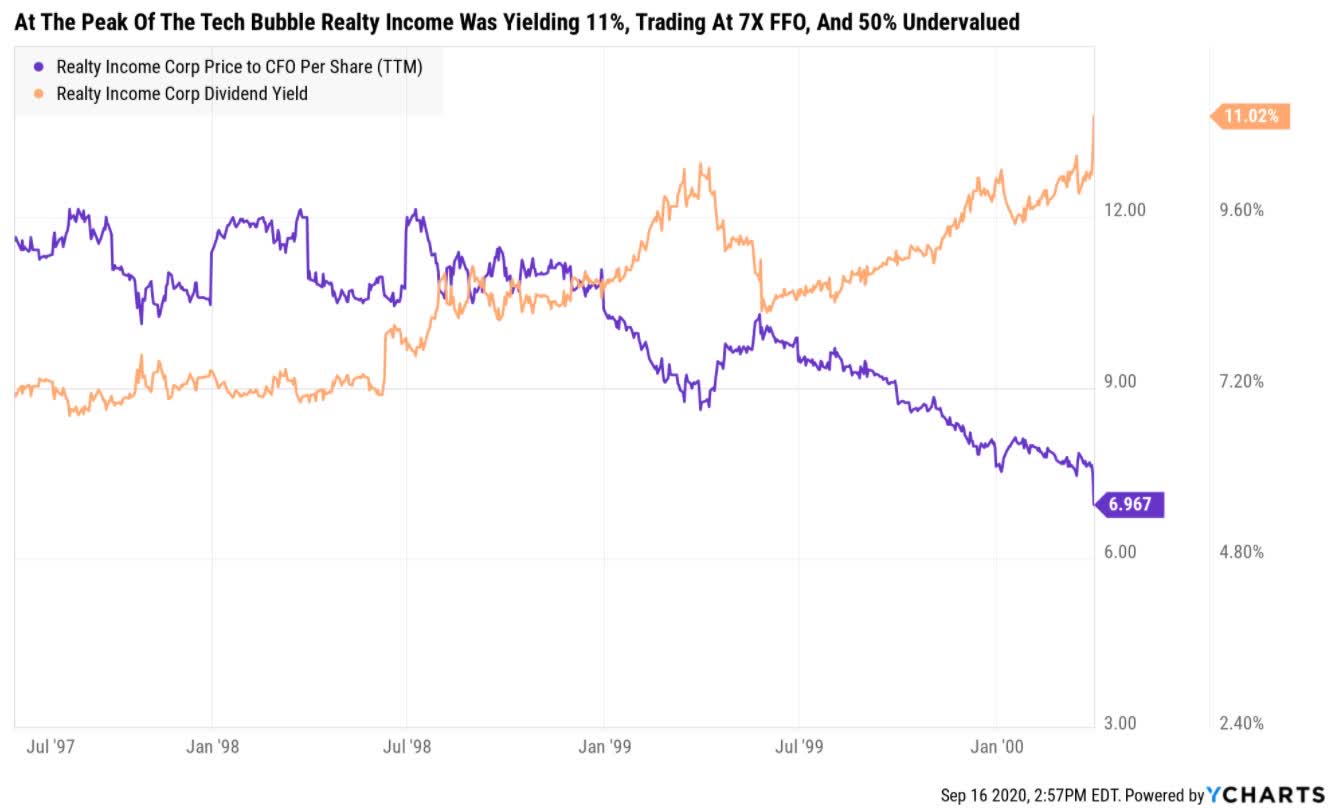
Realty Income was trading at 7X FFO, a 50% historical discount, at the peak of the mania, and a very low risk 11% dividend yield.
Enterprise Products? It was trading at 4X cash flow (a 60% discount) and 13% very low-risk yield.
Yes, at the most overvalued market in US history, when tech stocks were trading as if they could 750X earnings every five years, you could find incredible quality dividend stocks yielding 12% and trading at multiplies so low they were priced for -9%!
Ycharts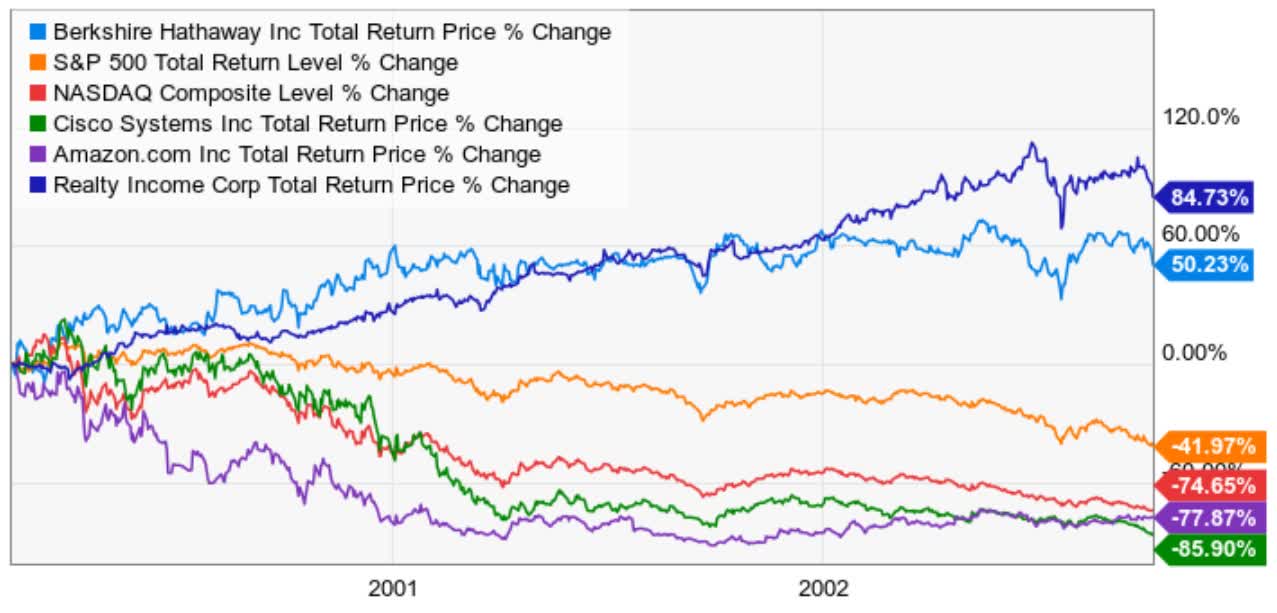
When valuations become so extreme, even in a recessionary bear market, stocks can go up, as BRK and O (and EPD) and many other value stocks did.
Wide Moat Research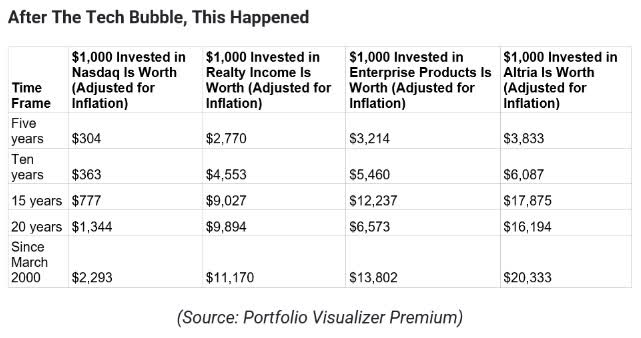
Realty Income, Enterprise, and Altria (trading at an 85% discount due to the Tobacco settlement + value bear market) delivered life-changing income and returns over the next few years and decades.
And all because they were so unloved during the worst bubble in US history.
So you see, even if this were precisely like the tech bubble (it's not), I would still recommend buying quality companies at good to great valuations.
There has never been a period in which nothing great was on sale, and as we just saw with the tech bubble, it's unlikely there ever will be.
Peter Lynch, the legendary fund manager who delivered 29% annual returns for 13 years at Fidelity and became a household name, popularized the idea of growth at a reasonable price, or GARP.
Divided the PE ratio by the expected long-term growth rate (five years or longer) and see how close you get to 1.
This isn't a perfect metric, of course, none are (see risk section for a detailed explanation of the weaknesses of PEG), but it's a good way of avoiding dangerous bubbles, like paying 3,000X earnings as some tech stocks hit in March 2000.
Ben Graham, the father of securities analysis, valuation theory, and Buffett's mentor (and one of the greatest investors in history in his own right) actually recommended switching from book value to a PE, or price to cash flow (of some kind) valuation model before he died in 1977.
Why not just stick with book value, which made Graham a legend in the 1930s and 1940s?
Because the economy had changed the best companies were no longer simple industrials or financials where their assets were easy to quantify.
Graham specifically explained how brand value and intellectual property (patents) made book value useless for valuing companies like IBM (IBM) (one of the Nifty Fifty).
He recommended future-proofing your valuation methodology by using earnings, cash flow, or dividends, the bottom line that creates intrinsic value.
No matter how famous a brand is, how strong patents might be or how vast a company's moat is, or how fast a company's sales grow, if that doesn't translate to earnings, cash flow, or dividends, then those things have no value.
And if they drive the bottom line, then they drive intrinsic value.
The idea is that PE, price to cash flow, dividend yield, etc., - valuations will always work, at least if you know which ones to use and over a statistically significant time period.
Over the long term (10+ years), the market is a "weighing machine" that factors in everything good and bad about a company and determines, through average and median multiples, what a company is worth.
Pacer Funds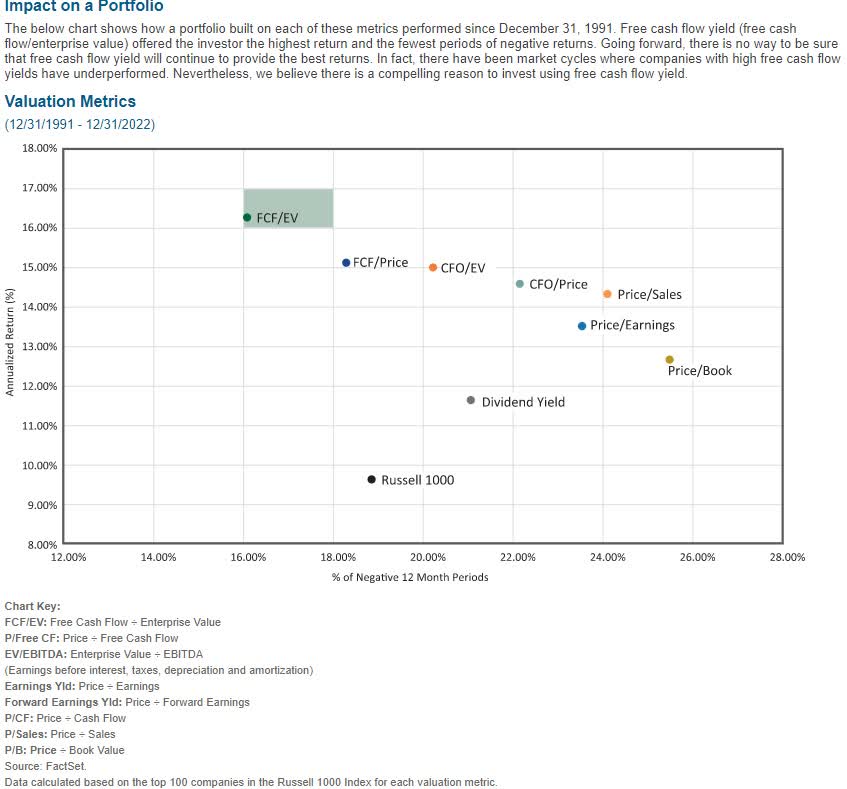
Over the last 33 years, you can see how book value did a poor job in generating strong returns and had the highest annual volatility.
In contrast, PE/ratio did a better job, but price/cash flow did even better.
But the single best valuation metric of the last 33 years, and most likely ever, is enterprise value/free cash flow or EV/FCF.
Enterprise value is market cap + debt - cash.
Imagine a company that trades for $100 billion on the stock market, that has $10 billion in debt and $100 billion in cash.
This is an extreme example because, in today's world, this could never happen. That's because such a company would have an enterprise value of $10 billion.
Someone could buy the company for just $10 billion because the cash on the balance sheet would pay for the acquisition, and they would only have to pay off the debt.
Enterprise value tells you the true cost of acquiring the entire company, including its debt.
This is why on Shark Tank, they often ask about debt on the balance sheet and any assets because they're trying to estimate enterprise value.
Free cash flow is Buffett's favorite way of valuing a company's "owner earnings."
Imagine a company that generates $10 million per year in sales, has $4 million in cost of goods, $1 million in salaries, and $1 million in other expenses like rent.
The gross profit is $6 million, and the operating profit is $4 million.
If the tax bill is $1 million, then the net profit is $3 million. That's what the owners of the company could put into their pocket at the end of the year if they wanted to.
Now imagine it takes $1 million per year in advertising to sustain that $10 million in sales, and the company spends $1 million per year on top of that to grow the business.
That now leaves $1 million per year in free cash flow, what's left over after running the business and investing in future growth.
This is the true money the owners can take out as distributions (dividends) stockpile for a rainy day or use to acquire a competitor.
For big companies, free cash flow is king because it can be used for buybacks, dividends, paying down debt, stockpiling cash, or acquisitions.
Ultimately, free cash flow is what gives any company value, and it's what butters the bread of income investors like me;)
It's also what we use to calculate PEG ratios, because it's the most effective valuation metric when combined with the enterprise value of the last 33 years.
In other words, using the best valuation metric resulted in twice the volatility-adjusted average annual returns for 33 years.
To rebalance our Phoenix portfolio, an all-blue-chip quality portfolio created during the Pandemic crash, I'm using PEG to find 20 stocks in a majority of sectors.
Let me show you how I use the Zen Research Terminal to find all investing ideas and recommendations and manage my family's charity hedge fund.
| Screening Criteria | Companies Remaining | % Of Master List | |
| 1 | Add PEG ratio to the fundamental metrics at the top of the screen | 0.00% | |
| 2 | BHS Rating "reasonable buy, good buy, strong buy, very strong buy, ultra value buy" | 311 | 61.58% |
| 3 | Non-Speculative | 271 | 53.66% |
| 4 | Blue-Chip Quality Or Better(10+ Quality) | 267 | 52.87% |
| 5 | Credit Rating Investment Grade (BBB- or better) | 214 | 42.38% |
| 6 | LT Total Return potential 10+% | 128 | 25.35% |
| 7 | Sort By PEG Ratio | 0.00% | |
| 8 | Go Down the List of lowest PEG ratios and select three companies per sector until you get to 20 companies in the majority of sectors | 0.00% | |
| 9 | Go to "tickers" and "control F" Find the tickers and select them to create a 20-stock portfolio | 20 | 3.96% |
| Total Time | 3 minute |
If you just use the 20 lowest PEG ratio stocks, you'll get a low PEG ratio to be sure, but you'll be almost 50% financials.
While our financial system is a lot safer than it was in 2007, being more than 33% concentrated in one sector is not prudent risk management (according to Schwab, Fidelity, and most asset managers).
That's why I selected the top three low PEG names in each sector, capping them at three, and kept going until we had 20 companies, so we could put 5% into each, a statistically diversified portfolio, in a majority of sectors.
Fischer et Al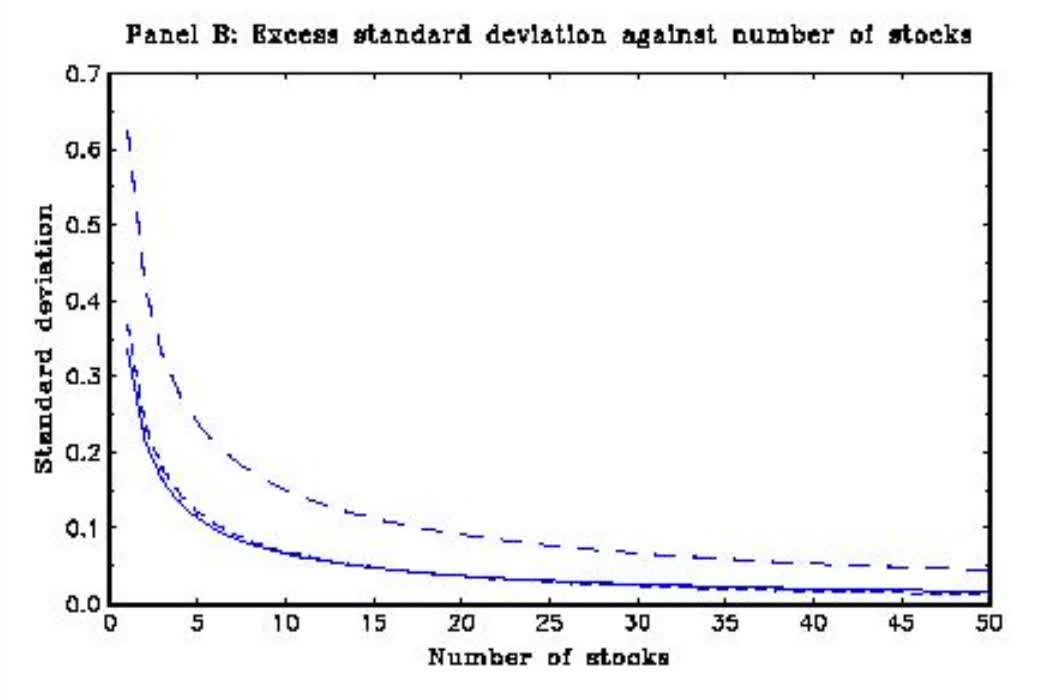
95% of the benefits of diversification, in terms of reducing fundamental risk, can be obtained from just 32 stocks and 90% from 20 stocks.
For the purpose of convenience, this is why most of our portfolios are 20 stock portfolios.
5% in a company is a high conviction, but if the wheels fall off the bus unexpectedly, you won't lose your shirt.
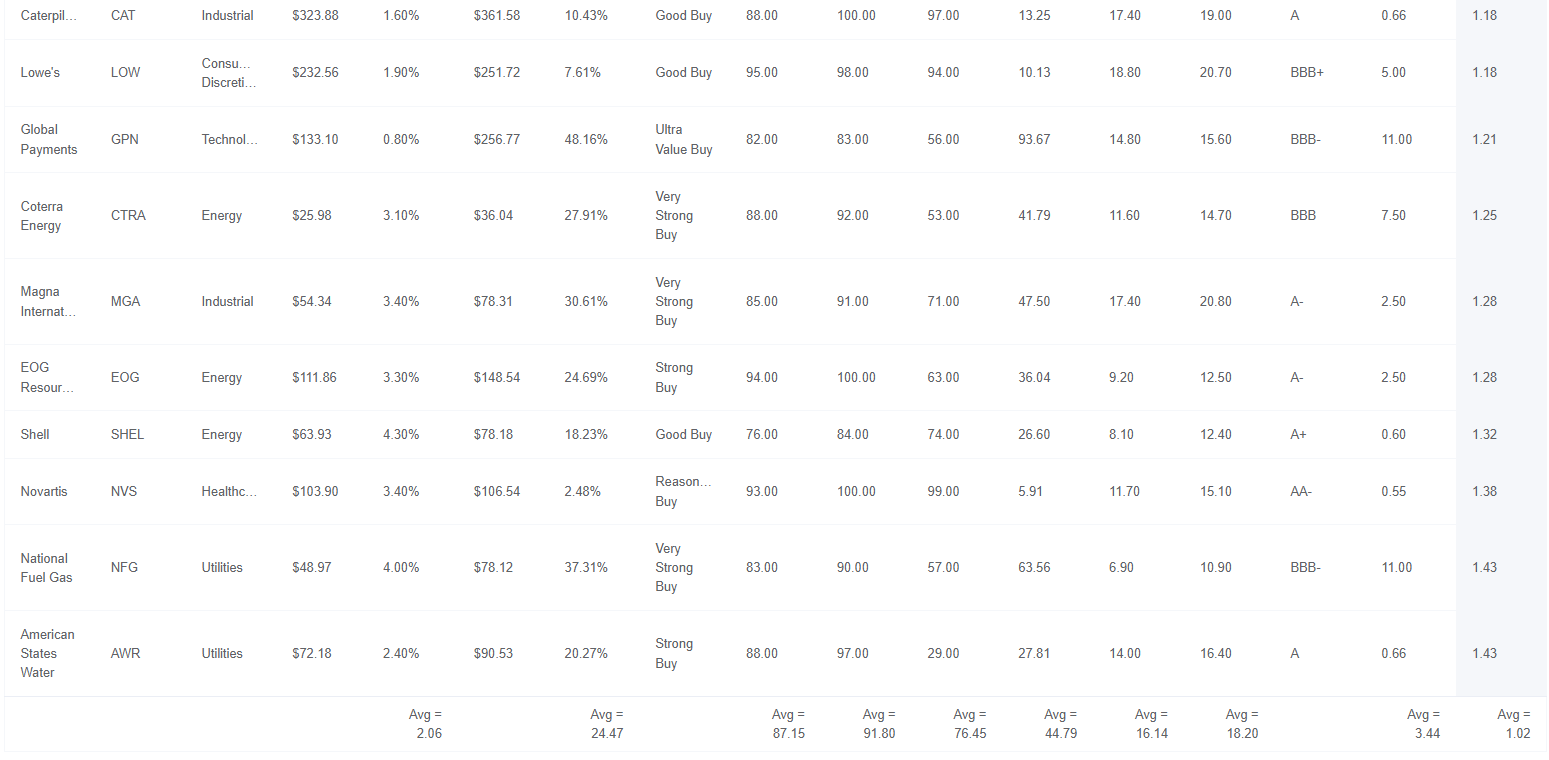
The bottom line is that these GARP companies offer far more than just growth at a reasonable price.
They yield an average 2.1% yield, with 92% dividend safety.
They're 87% quality Super SWANs (think wide moat aristocrats) with A-credit ratings and S&P long-term risk management percentile of 76% or top 24% of all companies in the world.
And as for valuation? 25% discount to historical fair value, and a PEG ratio of 1.0, growth at a reasonable price.
16% to 17% FactSet median long-term growth consensus means that from fair value 18% to 19% income growth and total return potential but from today's valuation the 10-year consensus total return potential is:
An almost 7X return potential over the next ten years, according to FactSet.
But you don't have to wait a decade for the potential for such strong gains, 4X better than FactSet expects from the S&P.
The average 12-month fundamentally justified total return potential is 45%!
This is not a forecast, but it tells you what kind of return fundamentals would justify.
While past performance isn't proof of future results, it can tell us whether or not the 18% to 19% income growth and total return potential forecast from FactSet's analyst consensus is reasonable.
Portfolio Visualizer Premium Portfolio Visualizer Premium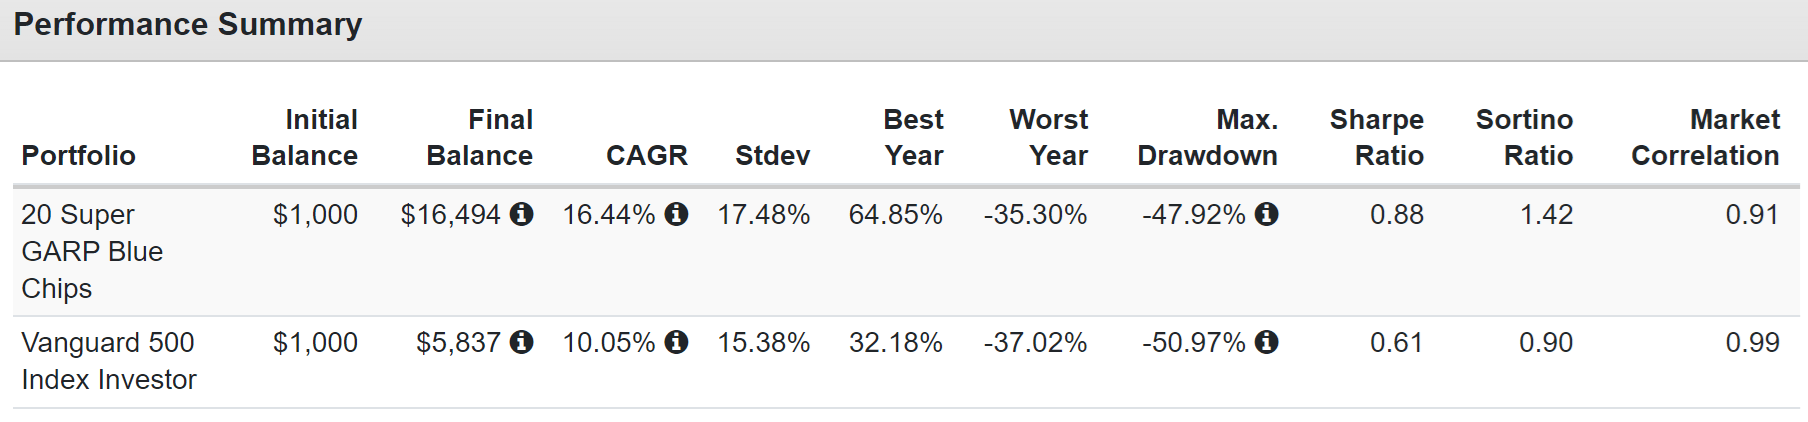
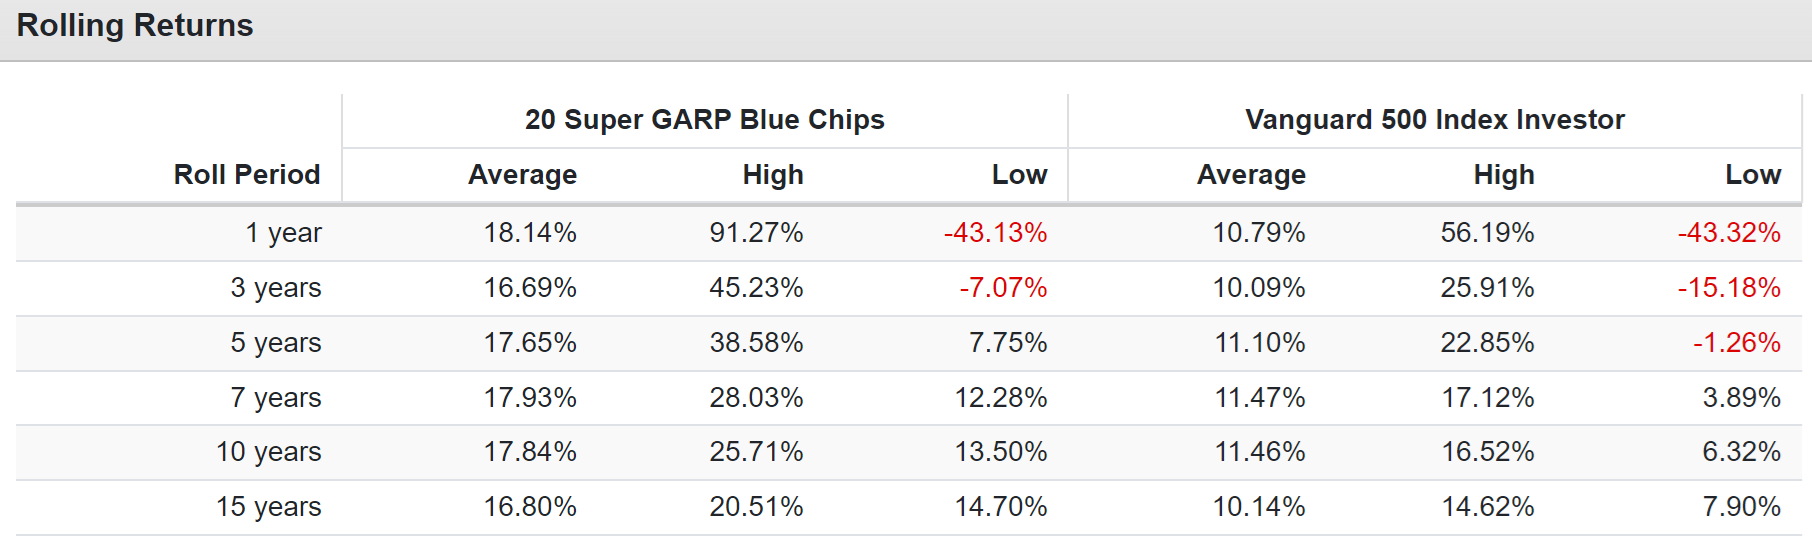
Both the historical 16% returns for 19 years and average rolling returns across all time frames confirm that the growth forecasts from analysts are reasonable or at least consistent with historical results.
20% annual income growth for the last 17 years
Portfolio Visualizer Premium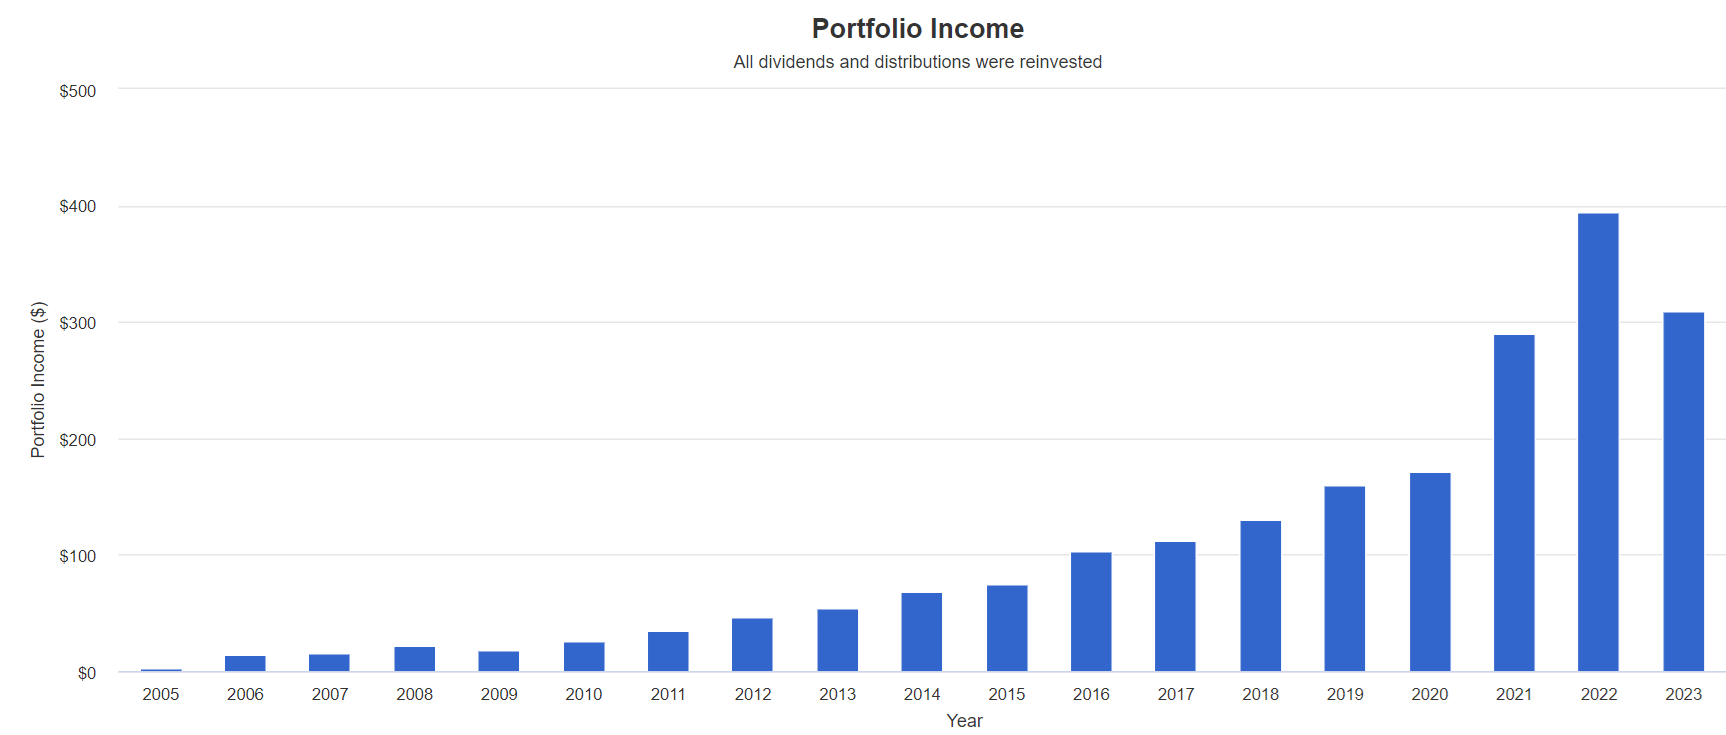
20% annual income growth for the last 17 years confirms that 18% to 19% consensus income growth in the future is also reasonable or at least historically consistent.
What are these GARP blue-chip opportunities?
Dividend Kings Zen Research Terminal Dividend Kings Zen Research Terminal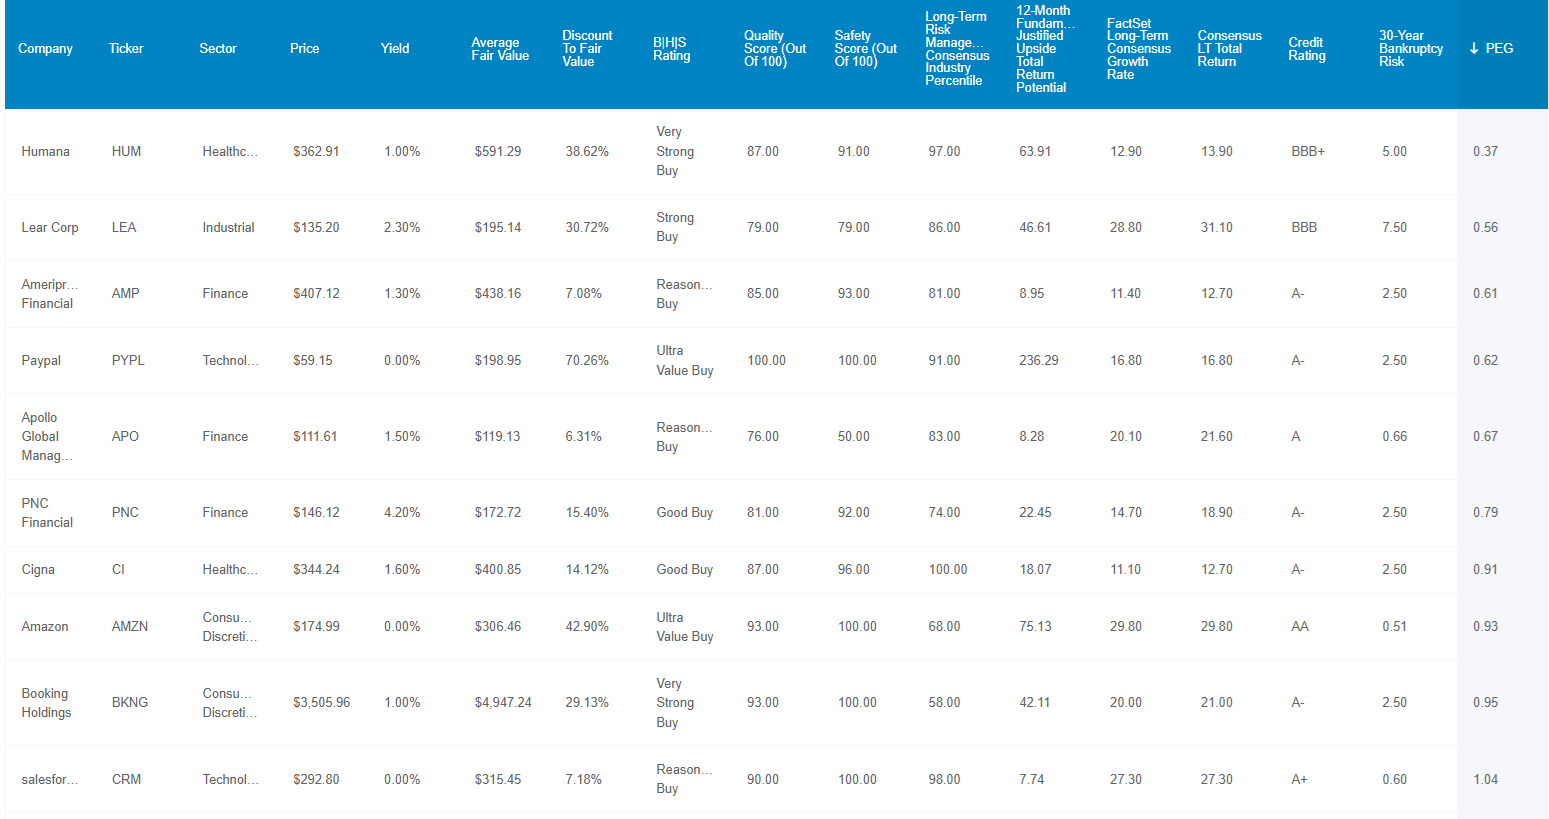
But while the long-term return potential is certainly outstanding, and the historical returns and income growth are exceptional, that doesn't mean you have to wait for a decade to enjoy the benefit of GARP investing.
Remember that the 12-month fundamentals justified a total return potential of 45% for this portfolio.
And when you look out three years, things look even more attractive.
FAST Graphs, FactSet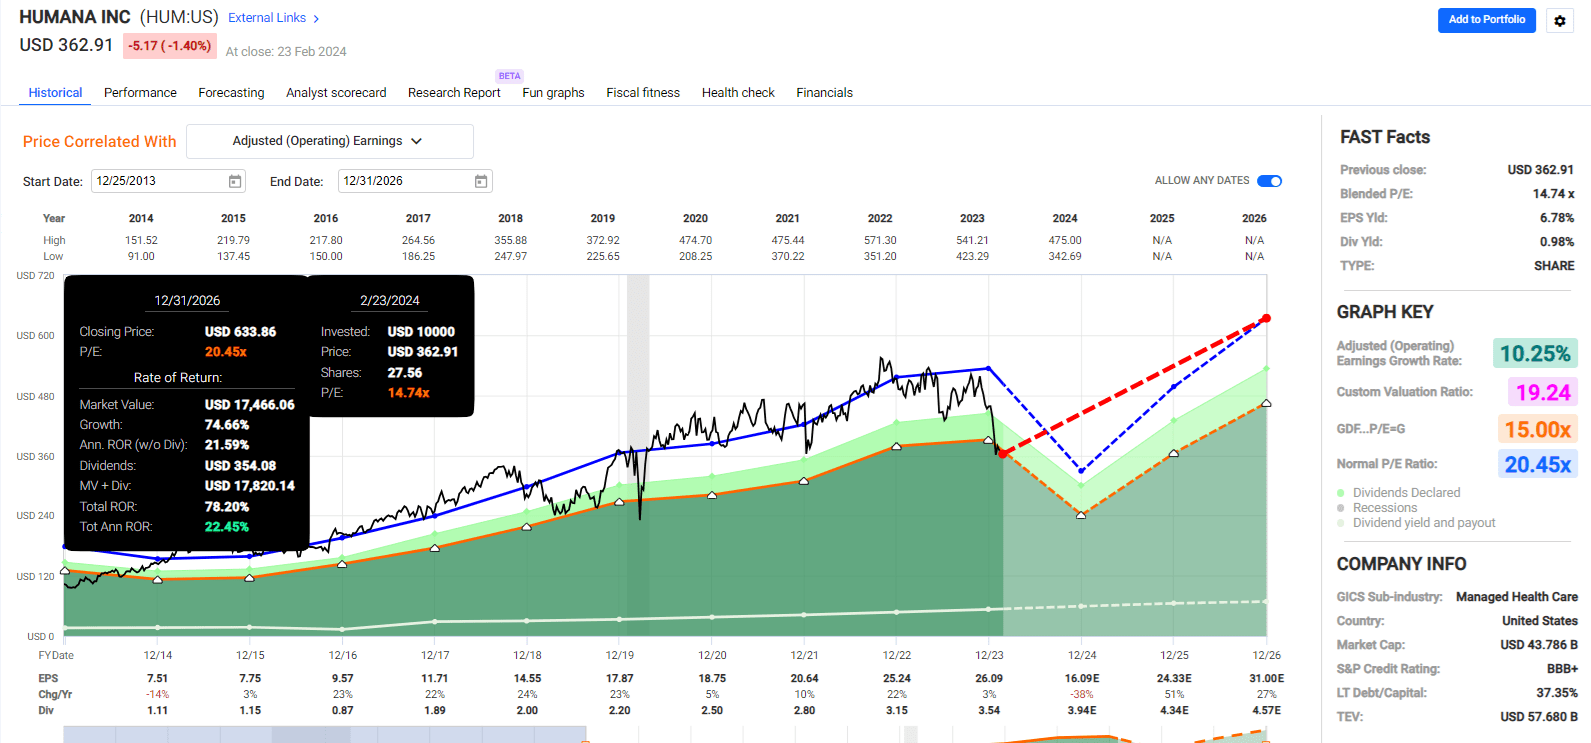
FAST Graphs, FactSet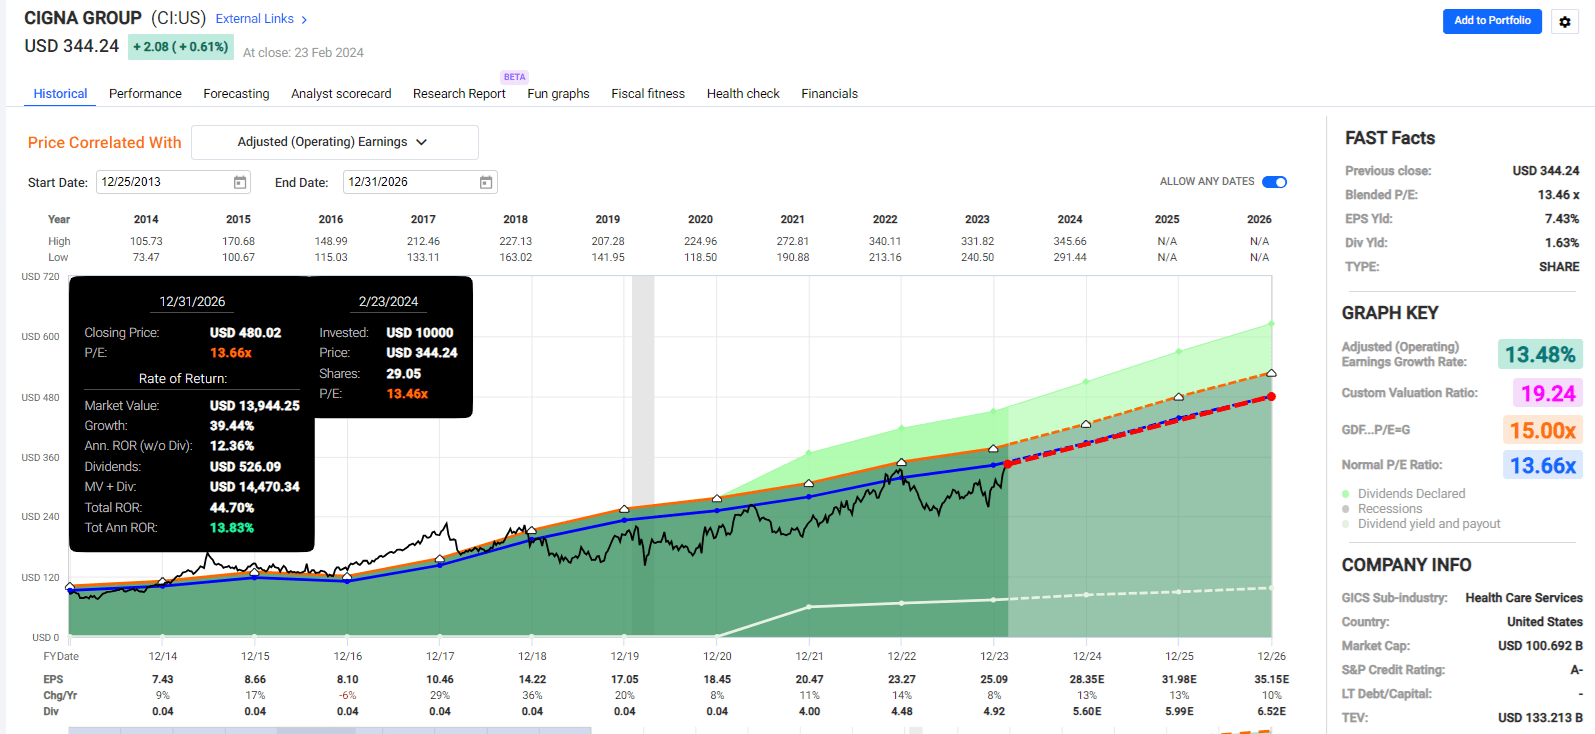
FAST Graphs, FactSet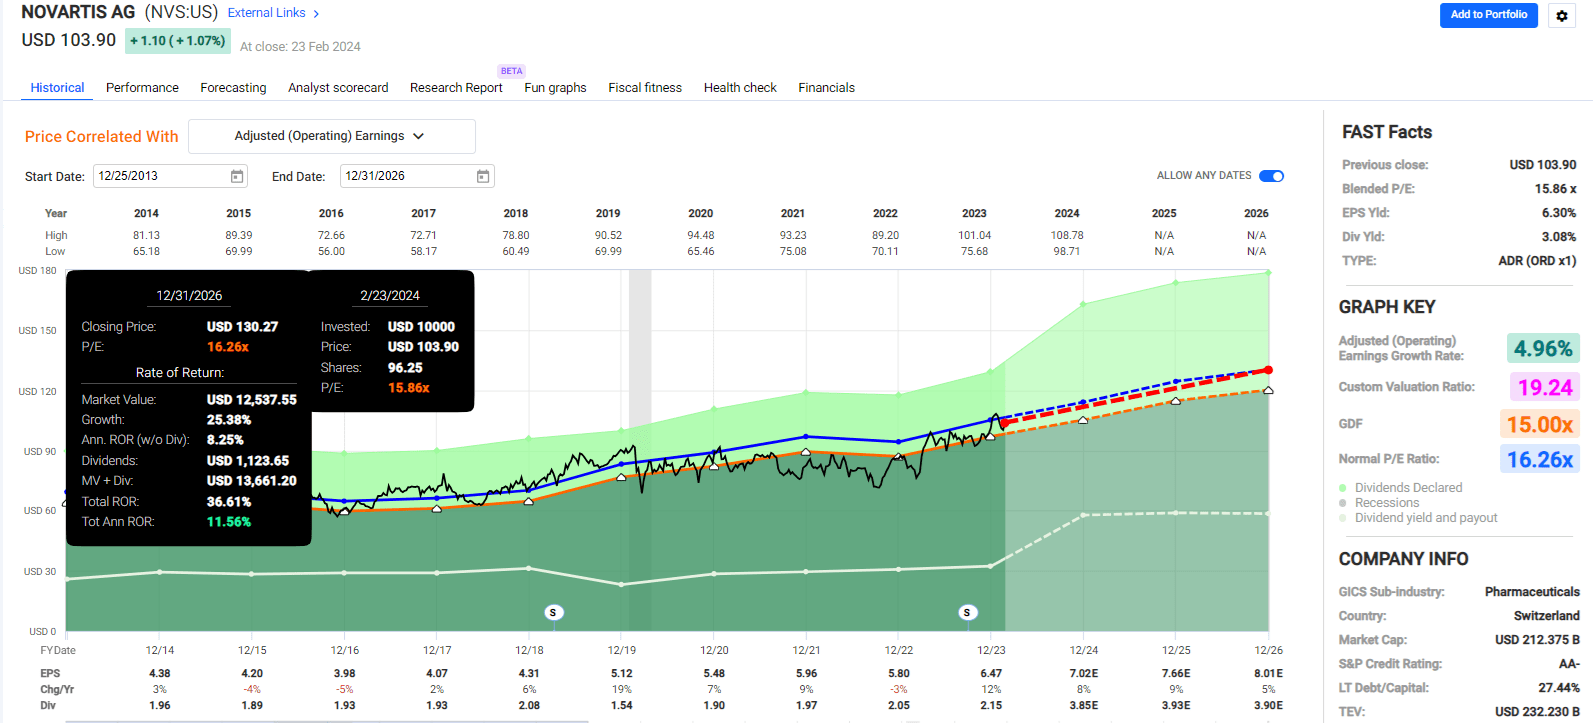
FAST Graphs, FactSet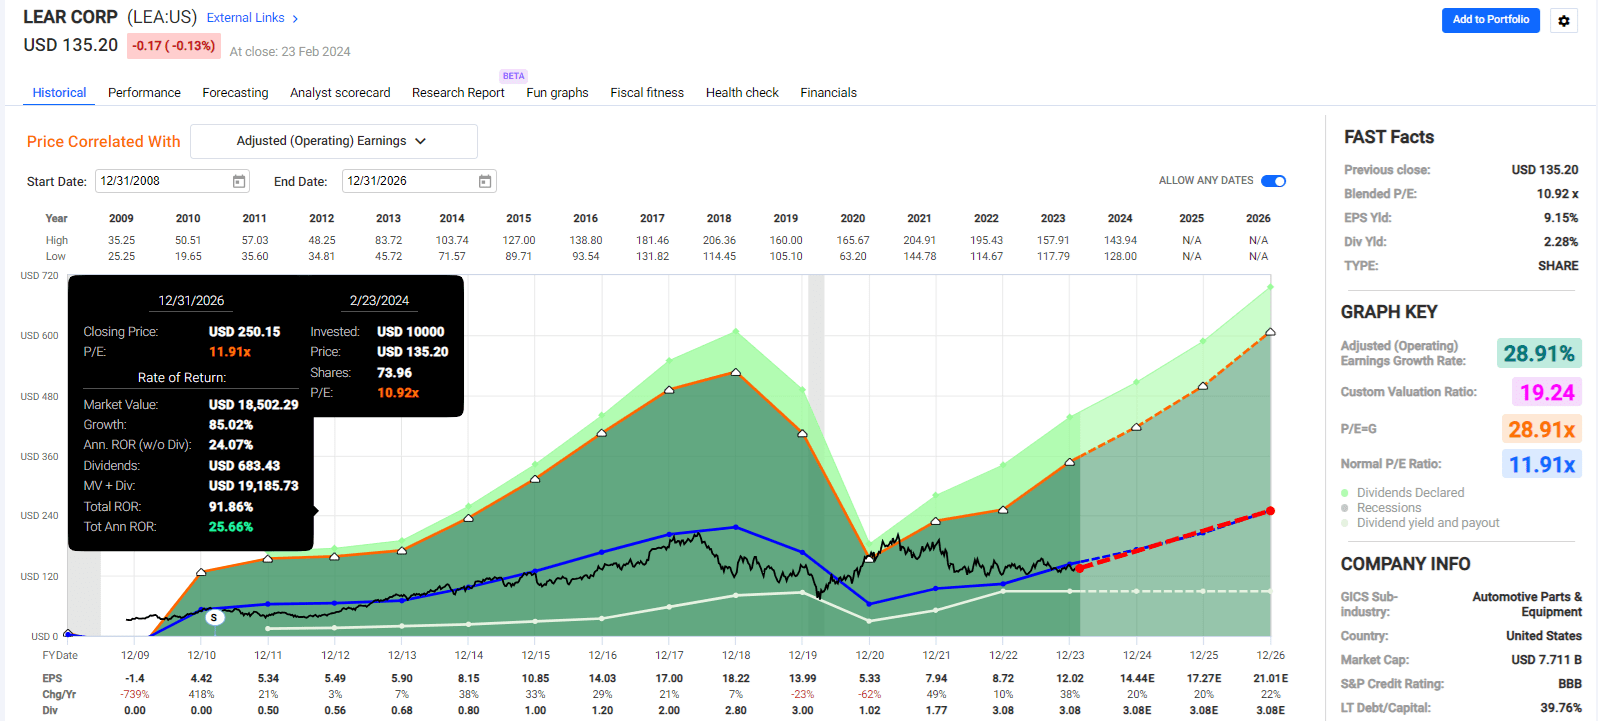
FAST Graphs, FactSet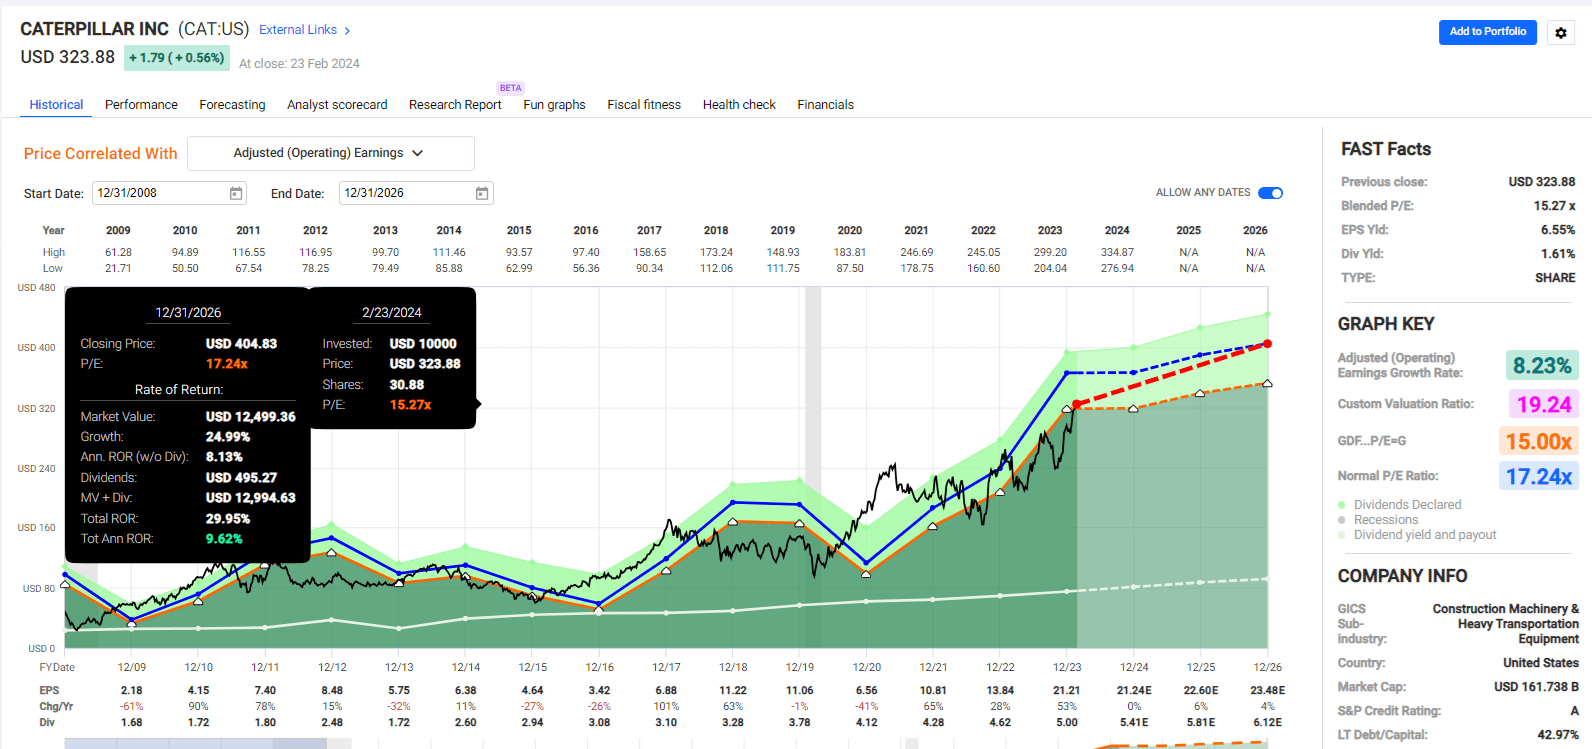
FAST Graphs, FactSet
FAST Graphs, FactSet
FAST Graphs, FactSet
FAST Graphs, FactSet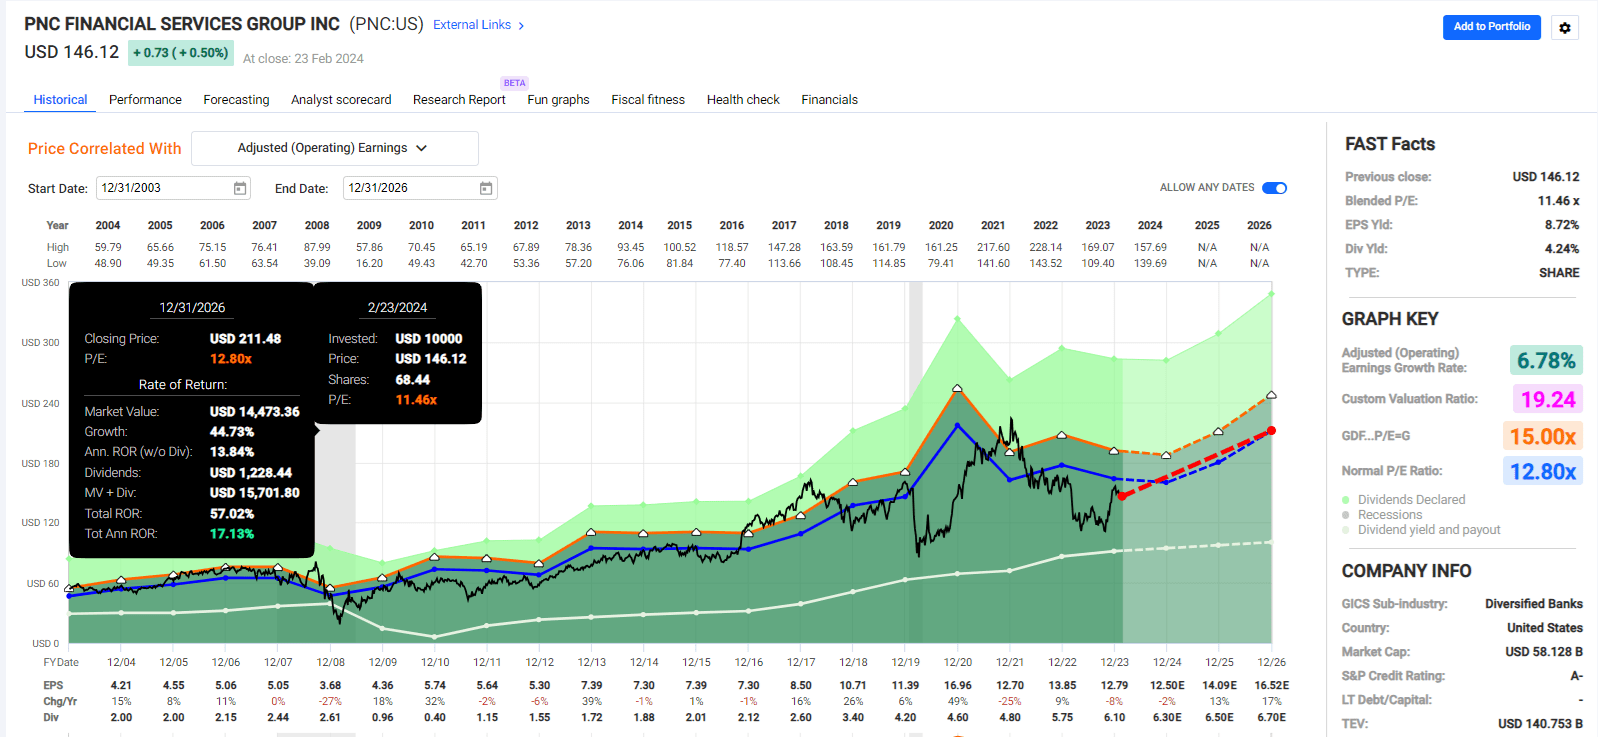
FAST Graphs, FactSet
FAST Graphs, FactSet
FAST Graphs, FactSet
FAST Graphs, FactSet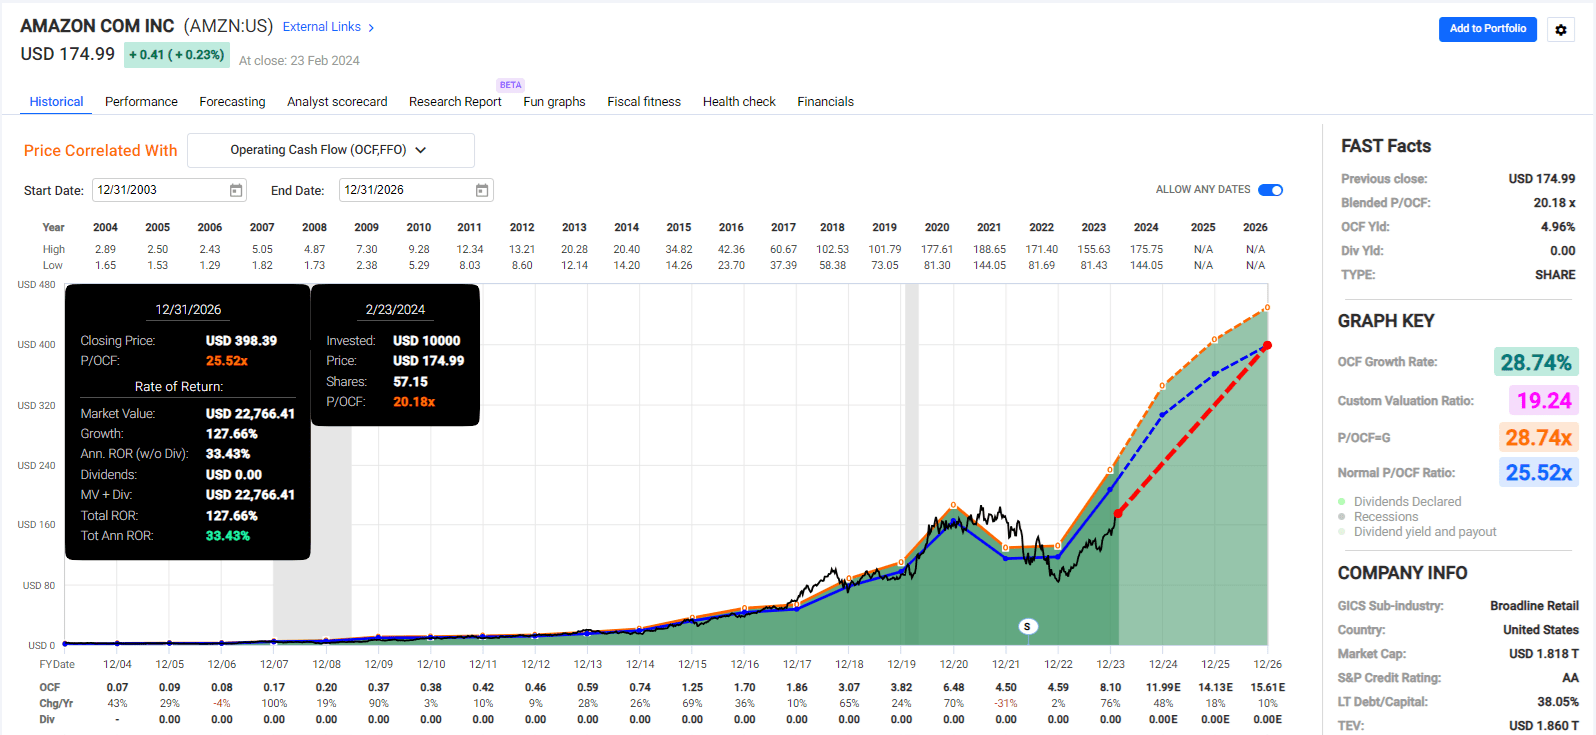
FAST Graphs, FactSet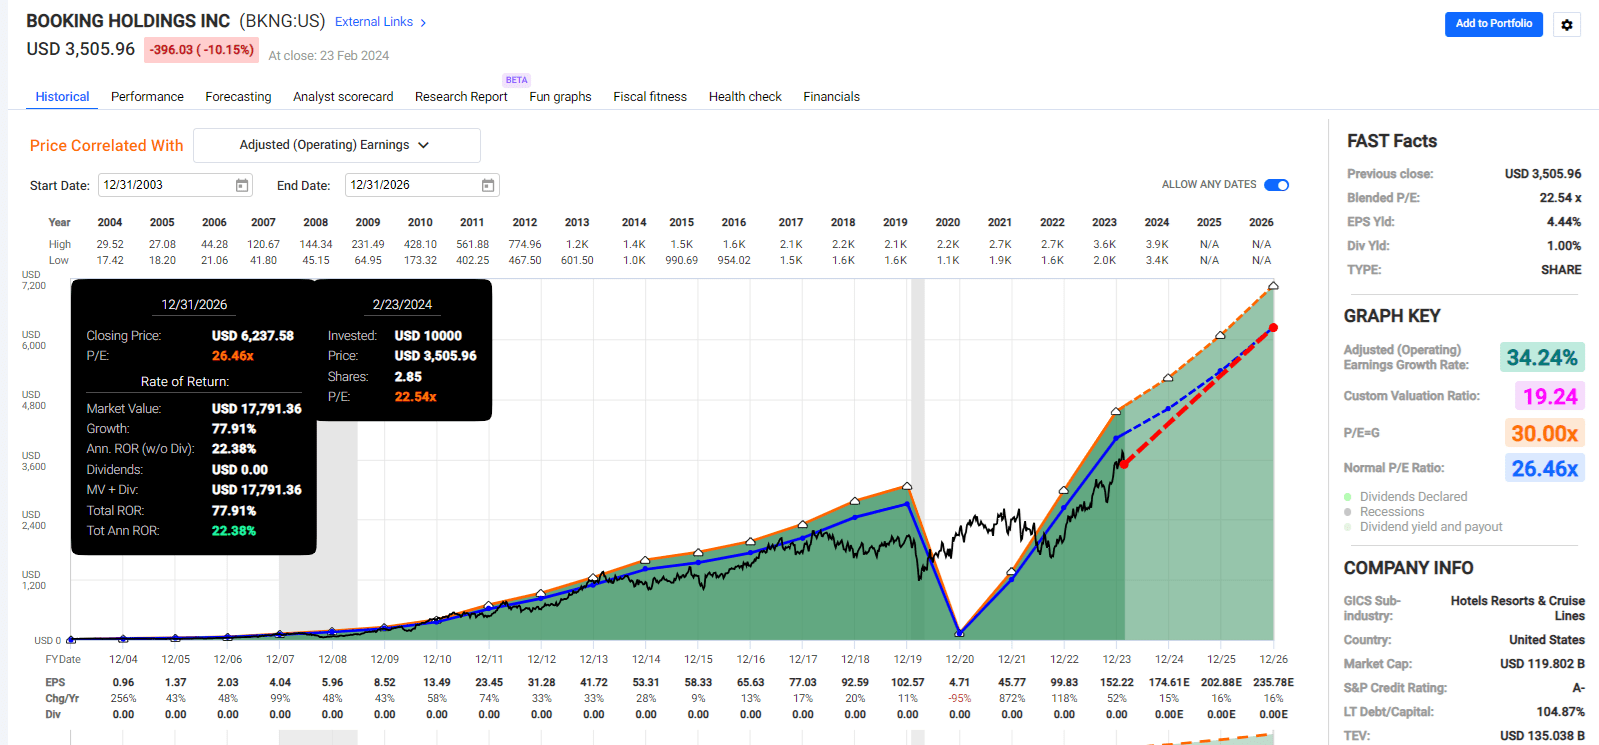
FAST Graphs, FactSet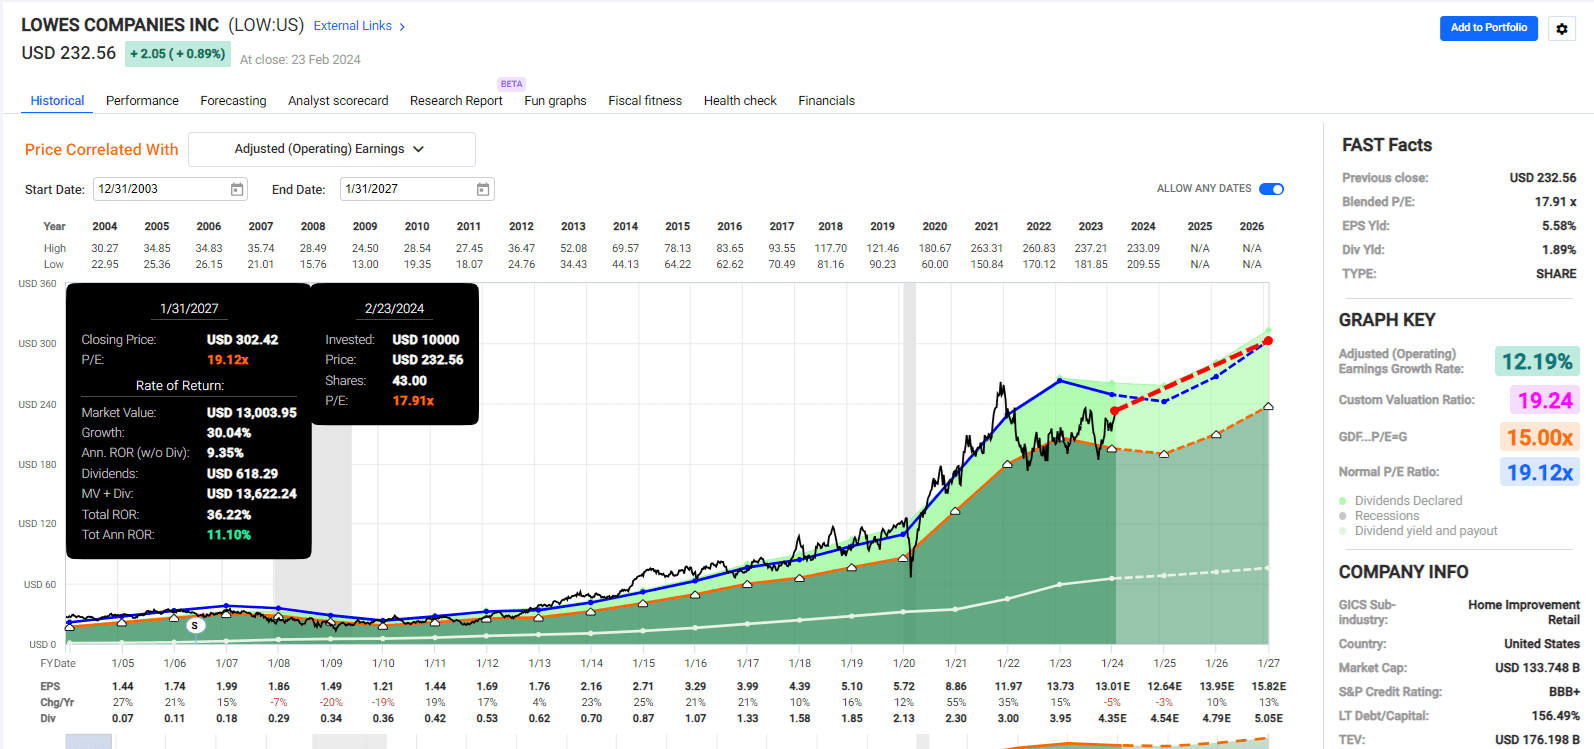
FAST Graphs, FactSet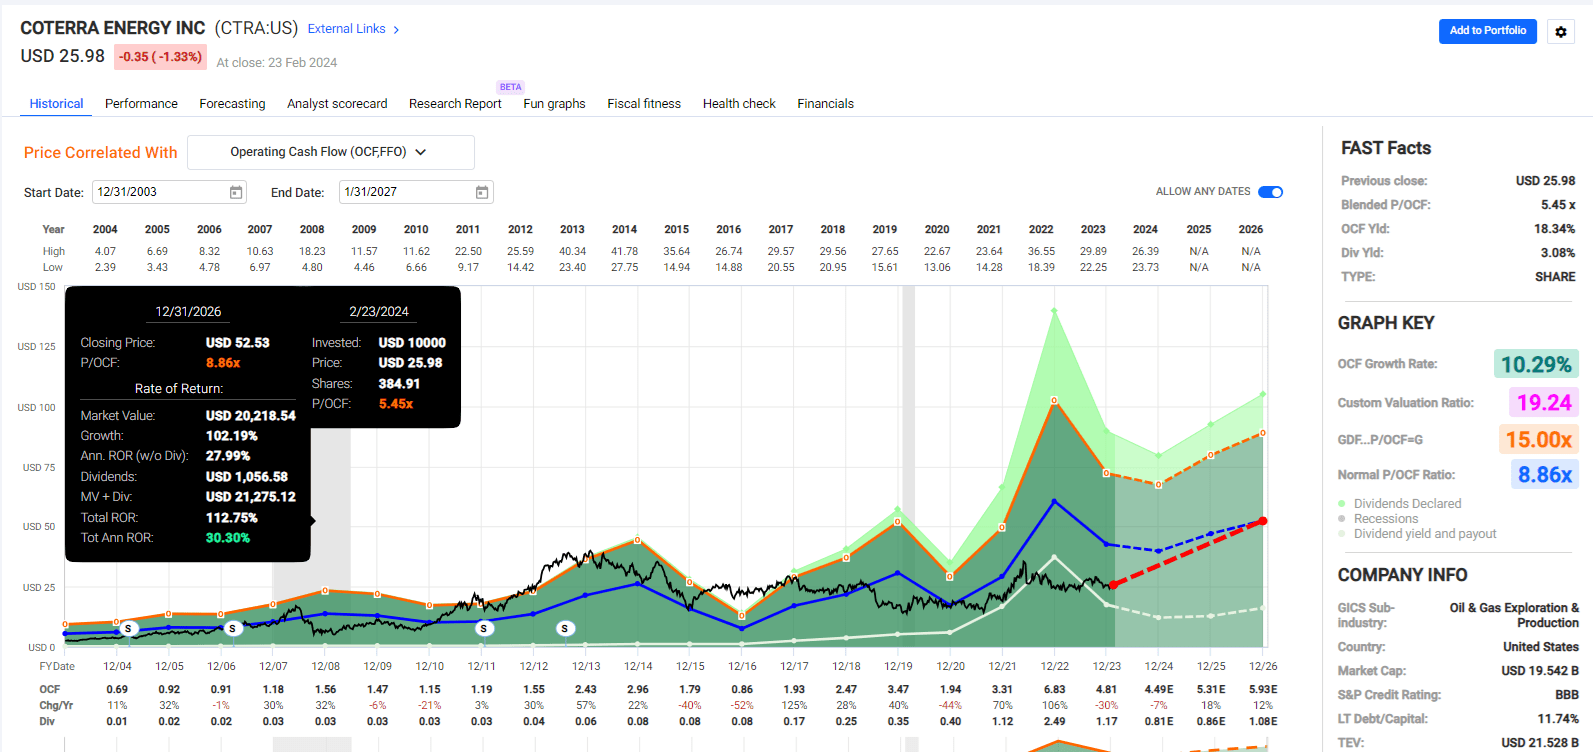
FAST Graphs, FactSet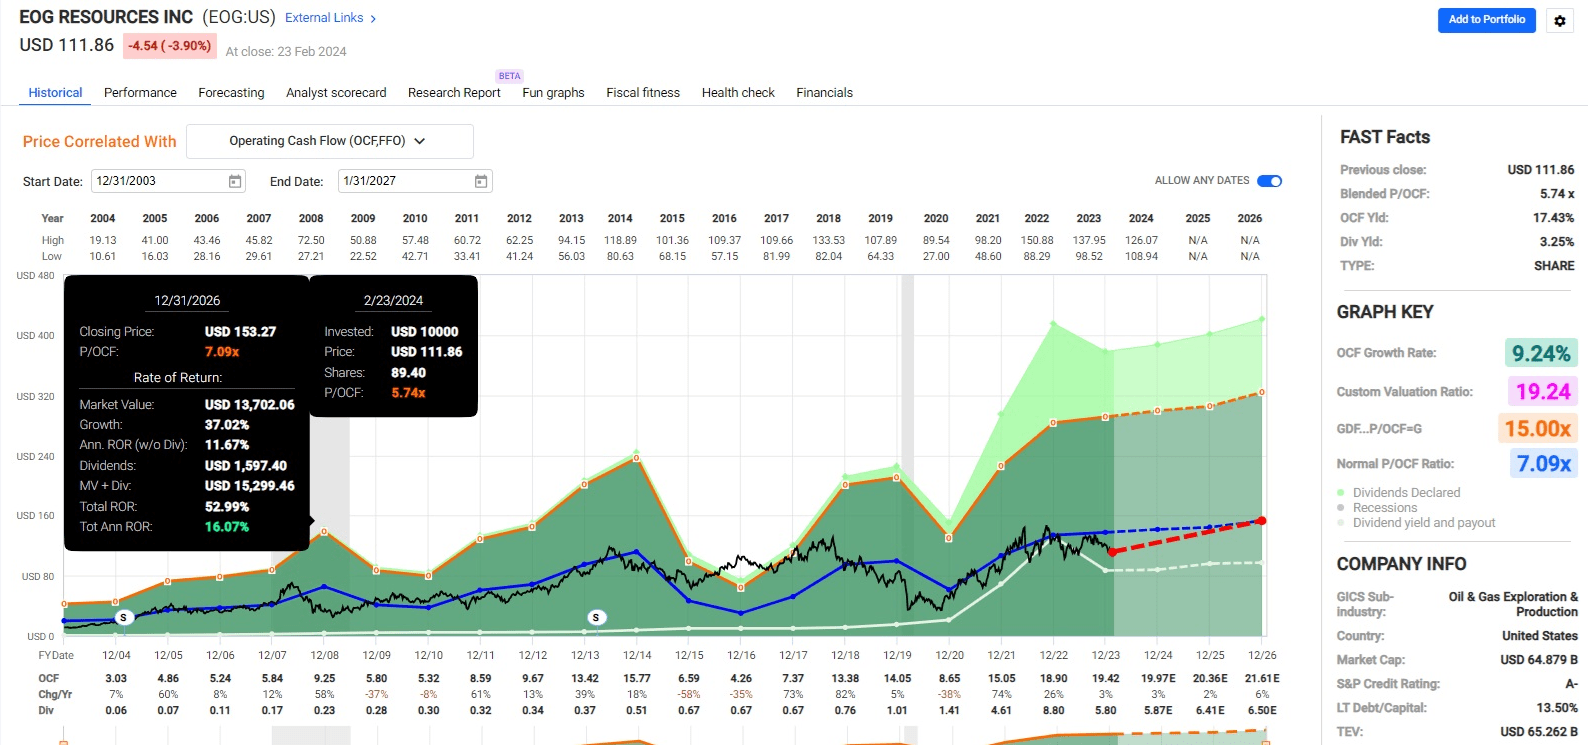
FAST Graphs, FactSet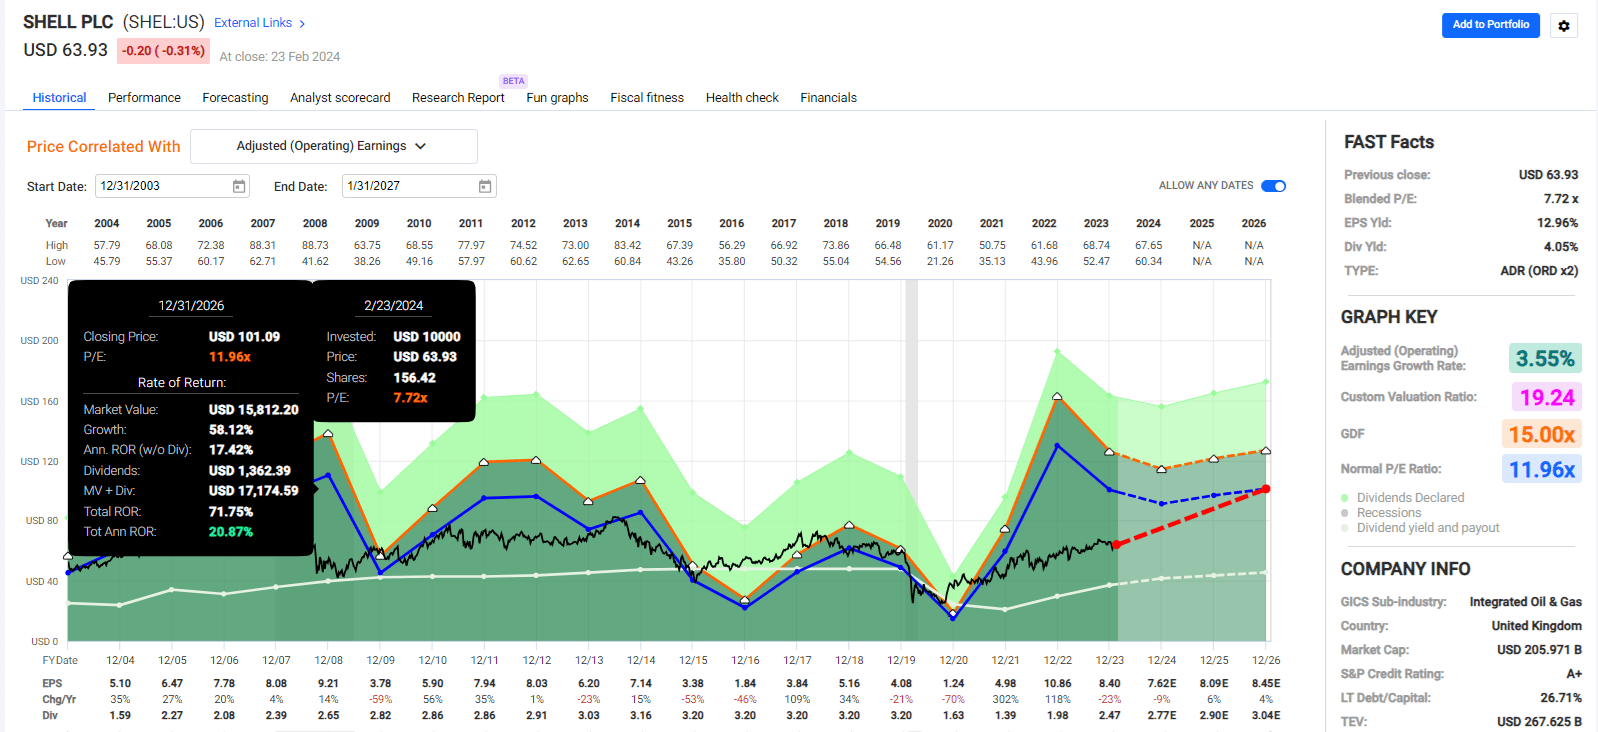
FAST Graphs, FactSet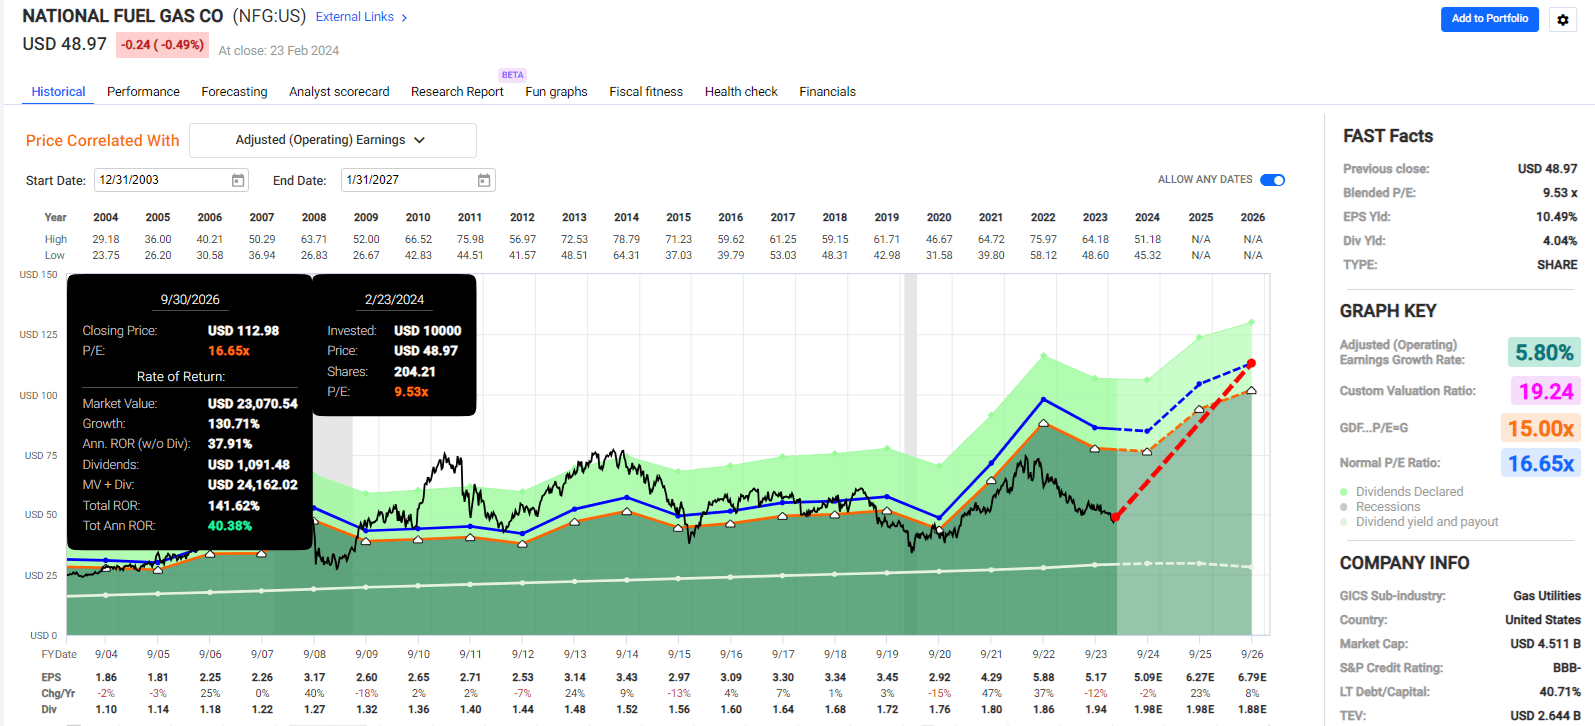
FAST Graphs, FactSet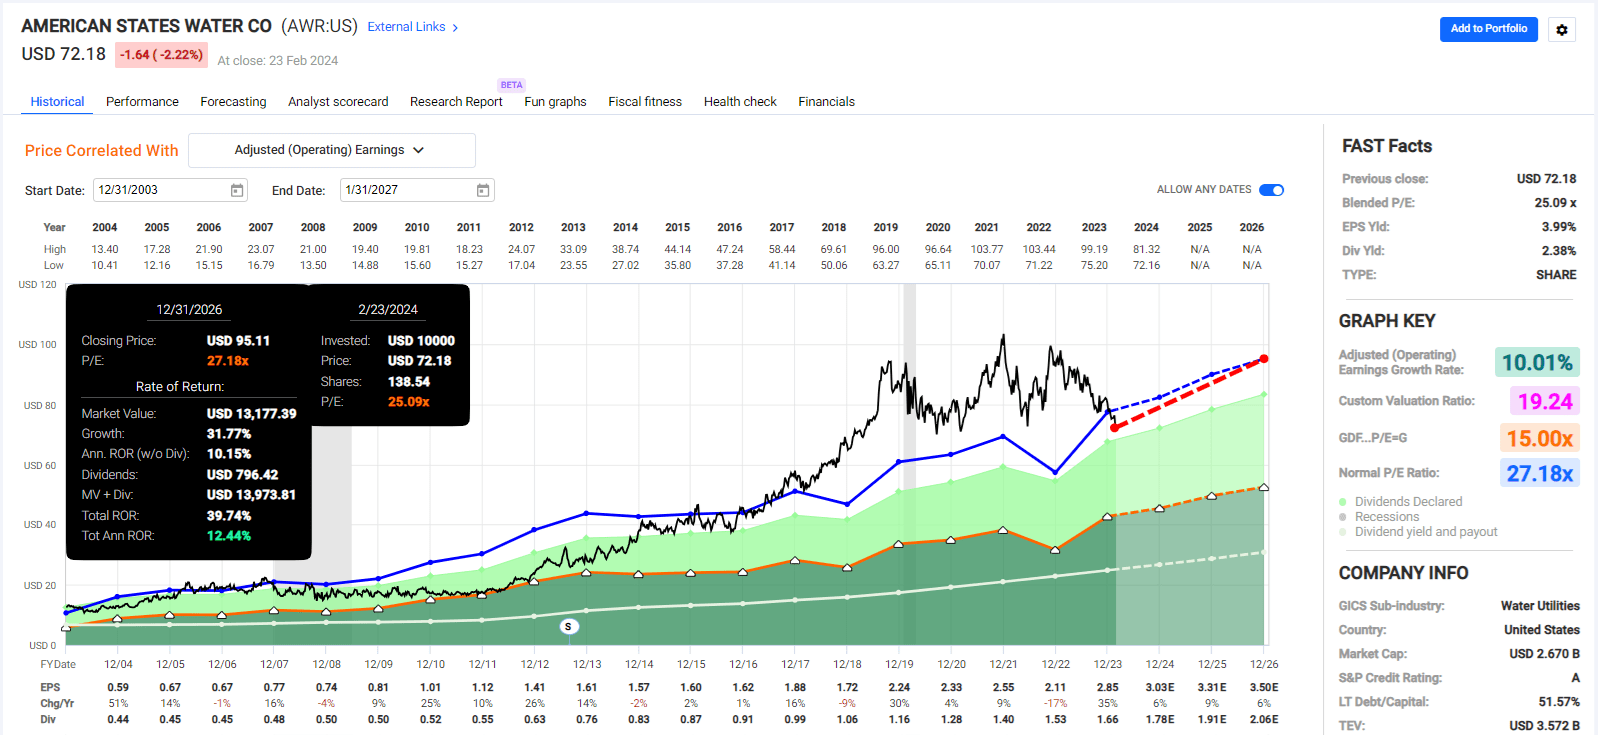
And now compare that to the S&P 500.
According to the FactSet consensus, these 20 GARP blue chips have three times the return potential of the S&P over the next three years.
FAST Graphs, FactSet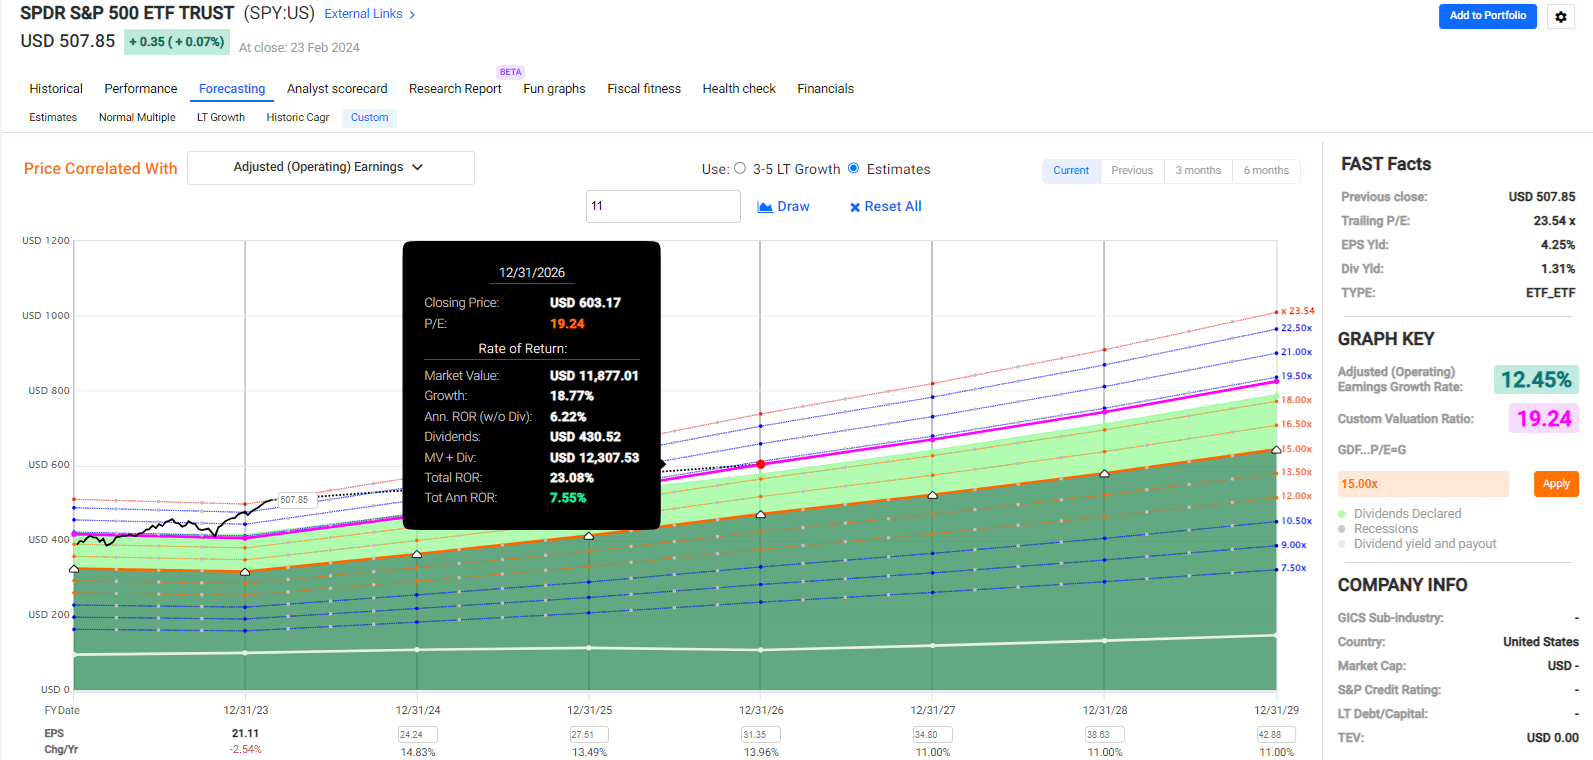
Higher yield, better long-term growth consensus, far better valuation, and 3X better short-term total return potential.
The limitations of EV/FCF are that some sectors don't generate FCF, at least not the traditional formula.
For these companies, we use the next best thing, EBIT, which is pre-tax profits.
But even for the companies for which FCF is easy to determine, we're using 2024 estimates because the alternative is backward-looking trailing results.
And the market is famously 12-month forward-looking, which is why we use the less certain consensus forward forecast.
And even when free cash flow estimates come in as expected, we can't forget that valuation itself is not and has never been a market timing tool.
Daily Shot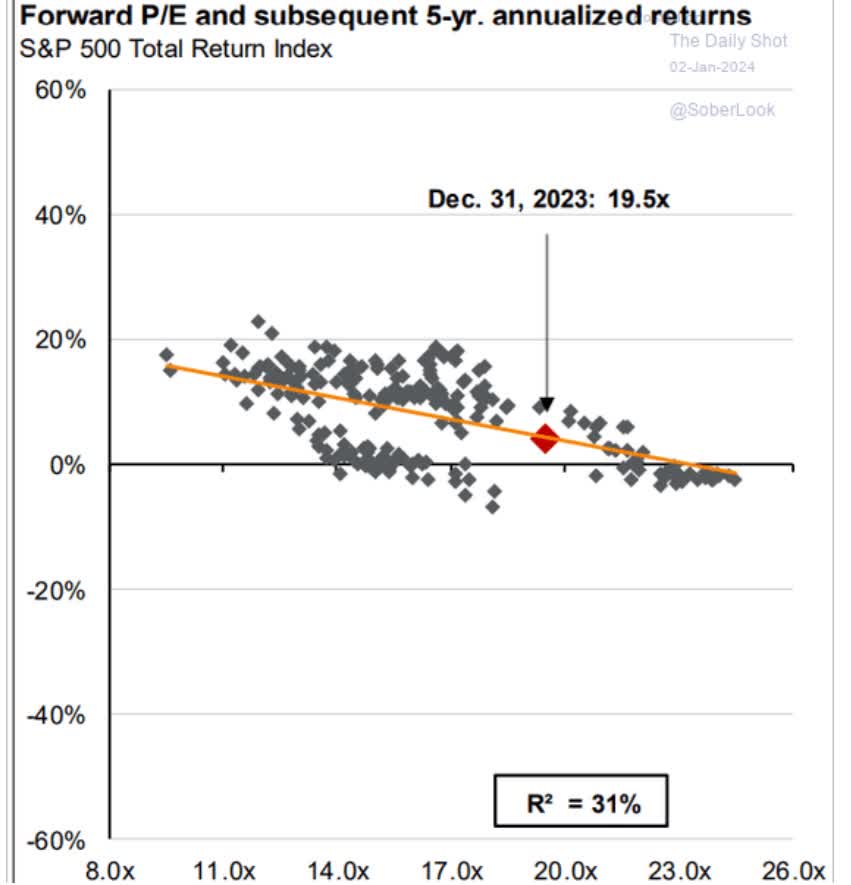
Valuations can tell you statistically, an approximation of what returns will be like, based on historical norms, five or 10 years from now.
But they won't tell you when a bubble is going to burst, or when a stock is going to bottom.
Remember how Realty Income bottomed at a 7 FFO and 11% yield back in March 2000? Or EPD bottomed at 4X FFO and 13% yield?
No one rang a bell at 11% yield on Realty or 13% on EPD, just as no one did at 7X cash flow on EPD, or 6X, or 5X.
Only with the benefit of hindsight was 4X the bottom on EPD as far as multiples go.
Income investors had to endure many months, and in some cases, years, of falling prices in the face of great fundamentals.
Portfolio Visualizer Premium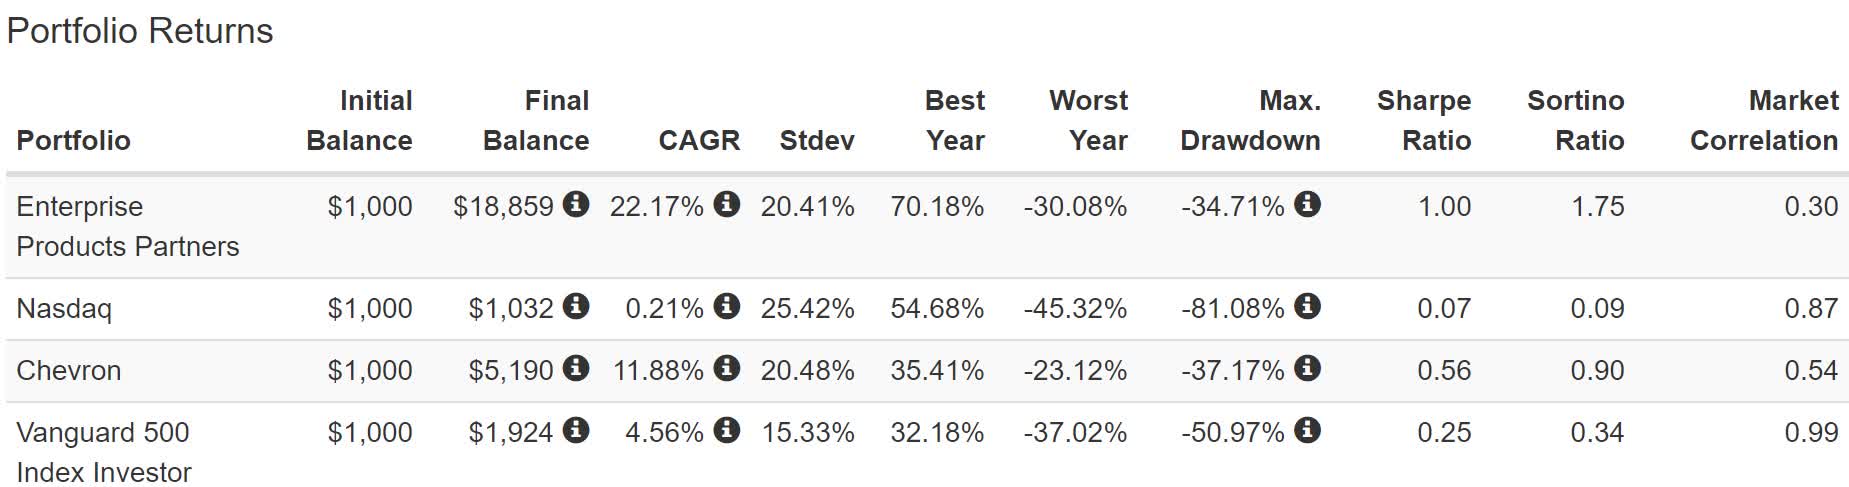
Value investors got the last laugh but only after brutal years in which valuations and fundamentals were meaningless and the market focused purely on hype and momentum.
And that's just the risks associated with valuation. Don't forget the other half of the GARP formula, PEG, growth estimates.
Just as valuation is dependent on forecasts of free cash flow, growth estimates change all the time.
They usually cycle around a long-term average. However, during periods of extreme pessimism, a growth stock might appear to not be a growth stock, and during periods of intense optimism, an undervalued GARP blue chip might appear cheaper than it really is.
Finally, I always point this out because some new readers don't know this, but in the short term, fundamentals count for nothing.
JPMorgan, Bank of America, Fidelity, Princeton, RIA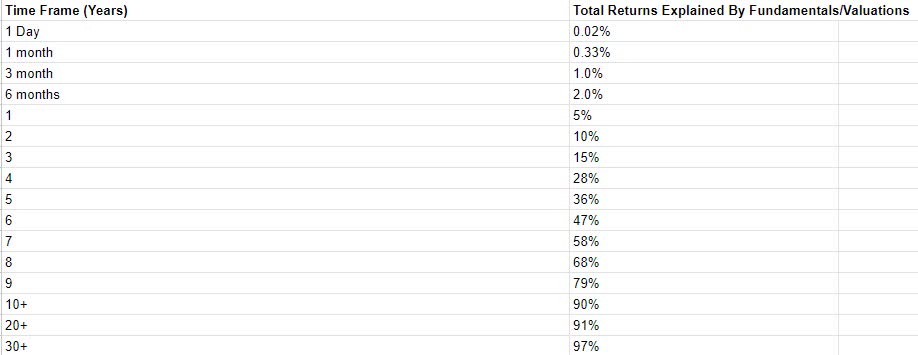
Some readers might think that an article like this one, that points out 20 strong long-term blue-chip opportunities with 45% average 12-month fundamentally justified total return potential and almost 600% 10-year consensus total return potential, means we think that these 20 stocks could go up 50% in the next year.
As I explained before, a fundamentally justified total return potential is not a forecast it means that if and only if a company grows as expected (today's forecast) and if and only if it returns to historical fair value in 12 months (when just 5% of returns are explained by fundamentals) then and only then will you make 45%.
It's like FAST Graphs charts.
Consensus total return potential forecasts based on the best available data we have today.
This is why you buy diversified portfolios and use sound risk management.
There are no guarantees on Wall Street. Even doing everything right for 30 years only grants a 97% statistical probability of success.
The longer the time frame the higher the probability can go but it never reaches 100%.
In fact, based on historical data and 75-year Monte Carlo simulations, I can tell you that if you were to practice perfectly disciplined investing like what Buffett or the greatest investors in history did for decades, the probability of success is about 99%.
Portfolio Visualizer Premium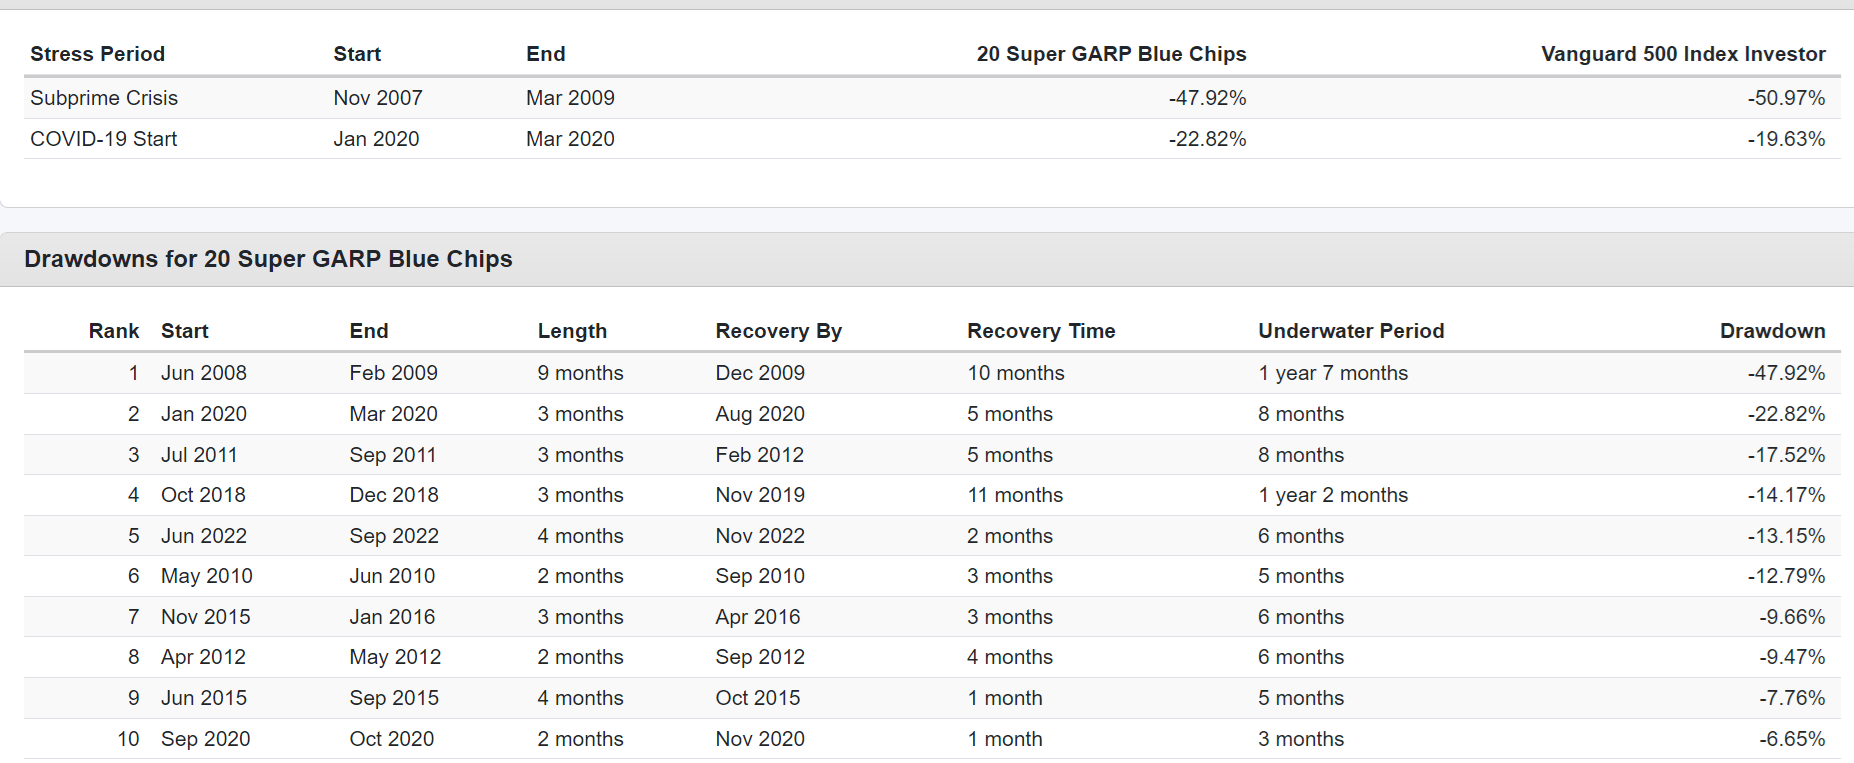
And let's not forget that along the way to those incredible 18% annual returns, these 20 GARP blue chips delivered plenty of volatility.
Portfolio Visualizer Premium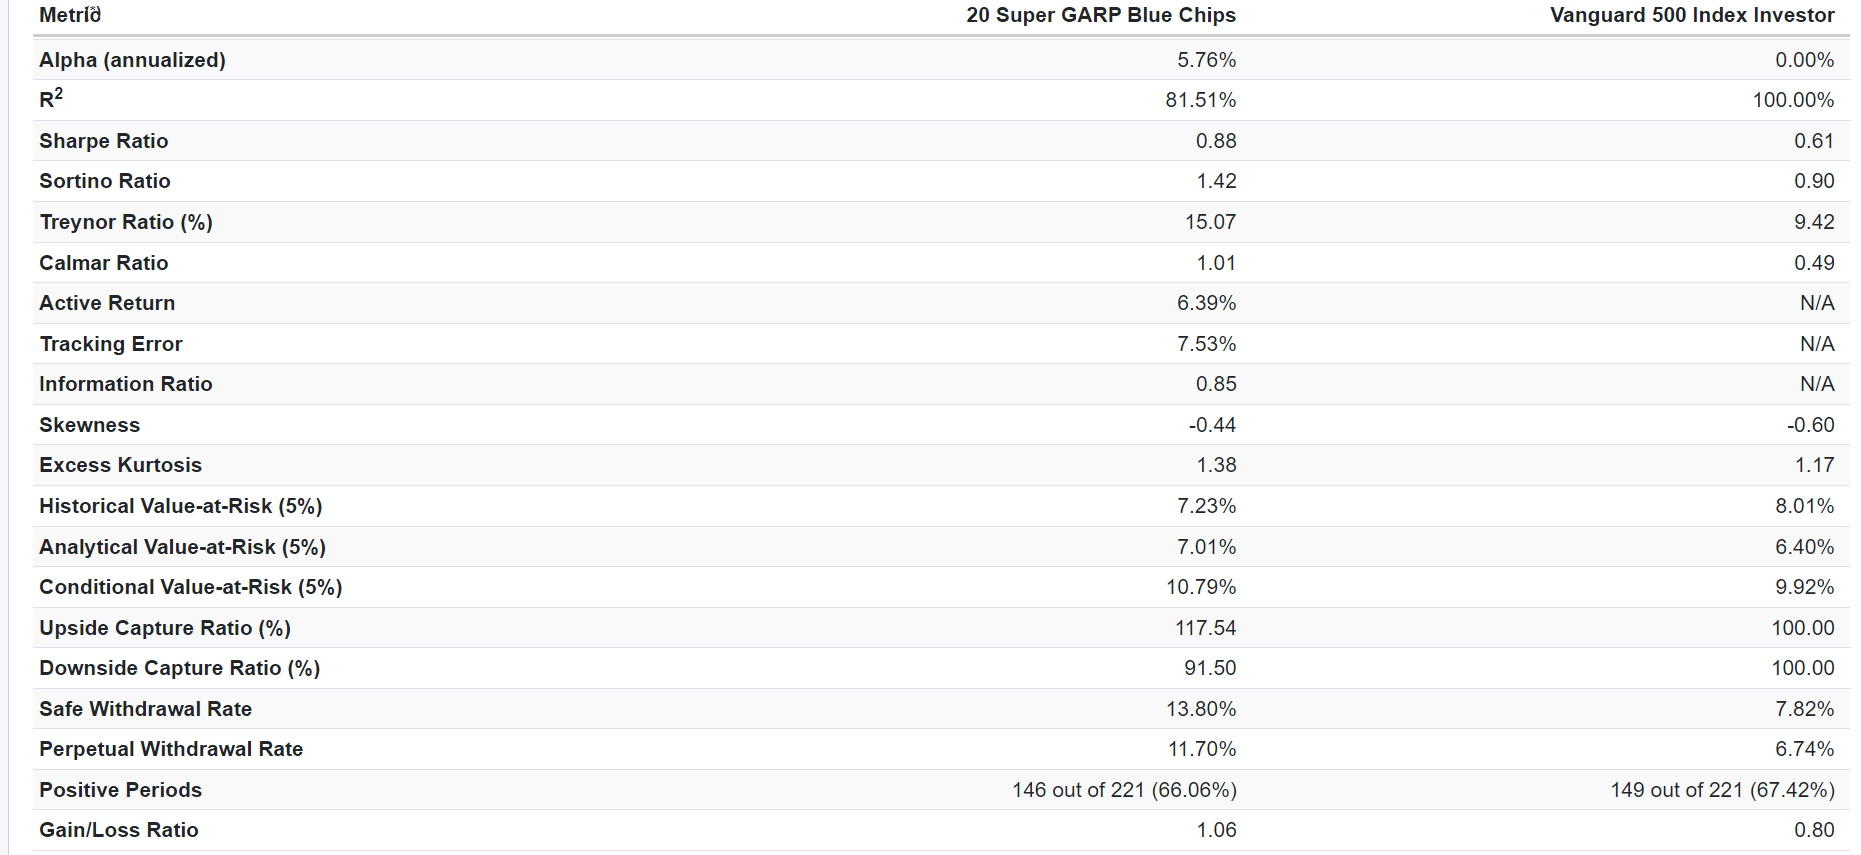
The fundamental statistics on these companies is sensational.
Over 20 years they delivered 6% annual alpha, so not just riding the market's coat tails.
They're Treynor ratio (excess returns/beta) of 15 vs. the market's 9 means that for every unit of volatility they delivered 15% excess total returns.
They captured 92% of the average market downside during declines and 118% of the average gain during rallies.
But their conditional value-at-risk 5% is 11%.
That's a fancy statistical way of saying that "in the future, you can expect around 11% single-day declines during panics like the Great Recession or Pandemic."
Yes, that's right. Any stock portfolio you build is likely to experience a double-digit decline... in a single day. Just like the S&P which fell 13% on March 16, 2016.
Ycharts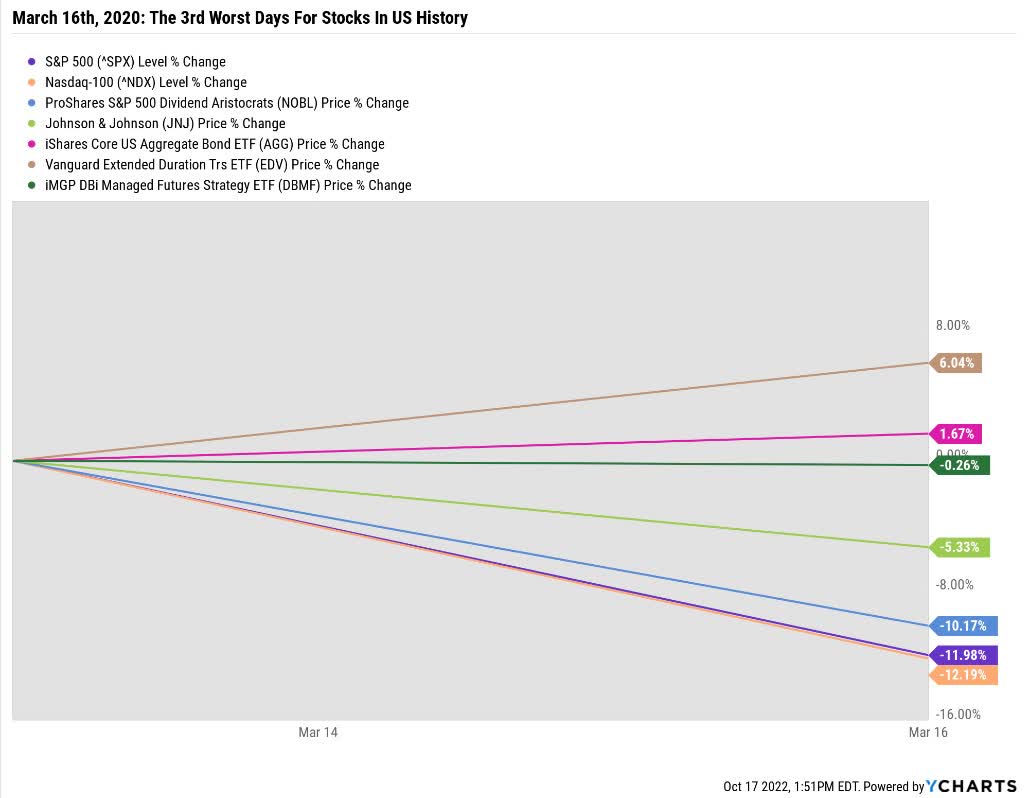
If you can't emotionally handle a double-digit decline in a single day? Then you simply should not be 100% stocks. It's not a matter of "if" a stock portfolio is going to fall 10% or more in a single day; it's a matter of "when."
That's why I keep reminding readers that no stock has ever been or will ever be a true bond alternative.
No matter what you might read online, a high-yield blue chip will never be like a risk-free Treasury bond in the sense that during a panic, like March 16th, 2020, it is expected to go up while stocks crash.
Long bonds went up 6% while the market fell 13%. That's because long bonds and stocks are very different asset classes, with different roles in a portfolio.
JPMorgan Asset Management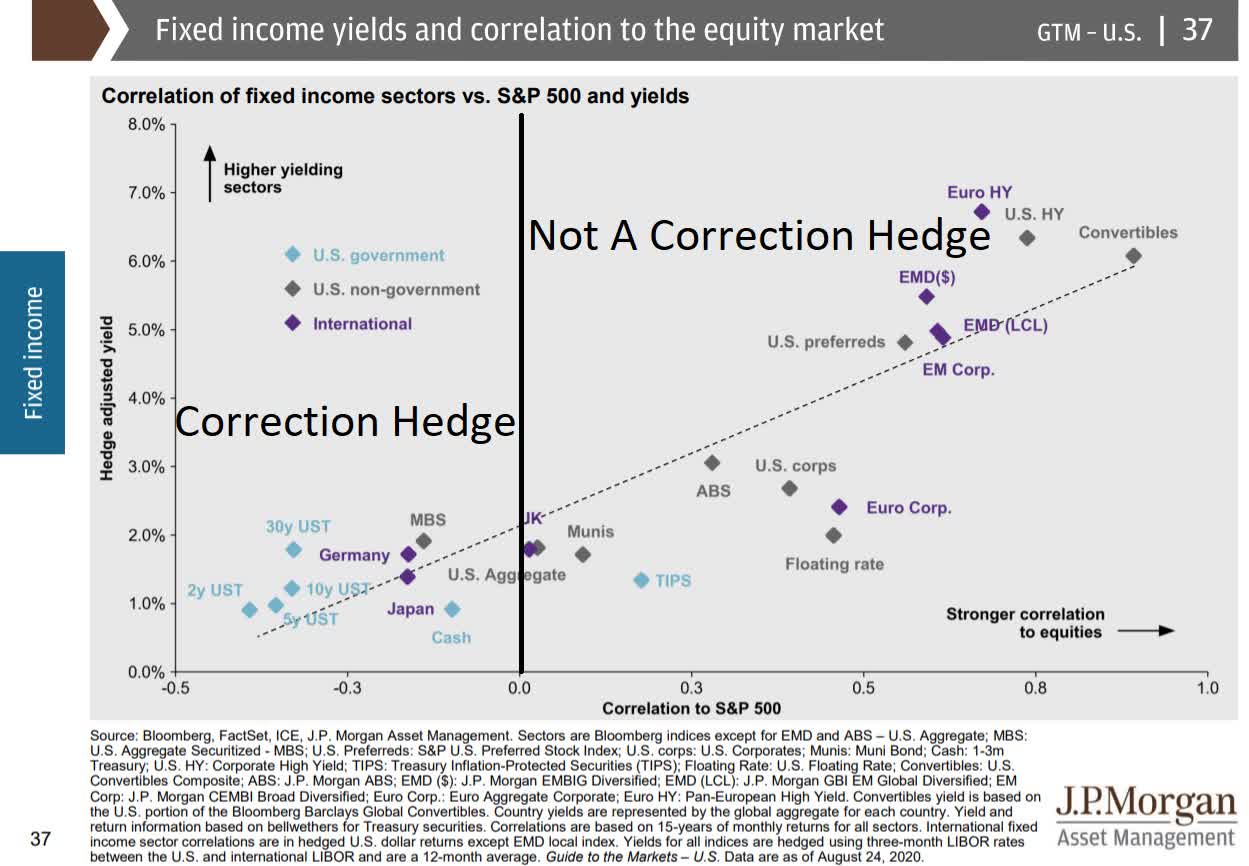
Risk-free sovereign bonds are only sexy and popular when interest rates collapse during a panic.
But if you want something likely (but not guaranteed) to go up when stocks fall, sovereign bonds are your best bet.
GARP investing is something almost everyone does.
No one buys a value stock trading at 8X earnings thinking, "The growth rate is zero or negative, but that's OK because the multiple is so low."
And no one buys a growth stock thinking, "The valuation is outrageous, but that's OK because eventually, the company will grow into this multiple."
But suppose you want to do GARP investing, combining GARP with quality and safety screens, to create a portfolio of truly superb blue-chip opportunities. In that case, this article is a great example of how to do it quickly, easily, and with a high probability of long-term success.
That's because we use the best valuation metric of the last 33 years to determine low valuation (and FCF yield is also a quality screen).
We use the best available data from the expert consensus of all analysts who cover a company for a living. While growth estimates are never guaranteed, the median long-term consensus from every expert who models a company based on the latest data is the best option there is, in my opinion.
When you put it all together, GARP Investing works long term if you are disciplined and remember that in the short term, anything can happen (like a casino).
But in the long term, like a casino, the power of fundamentals and statistics works in your favor.
Portfolio Visualizer Premium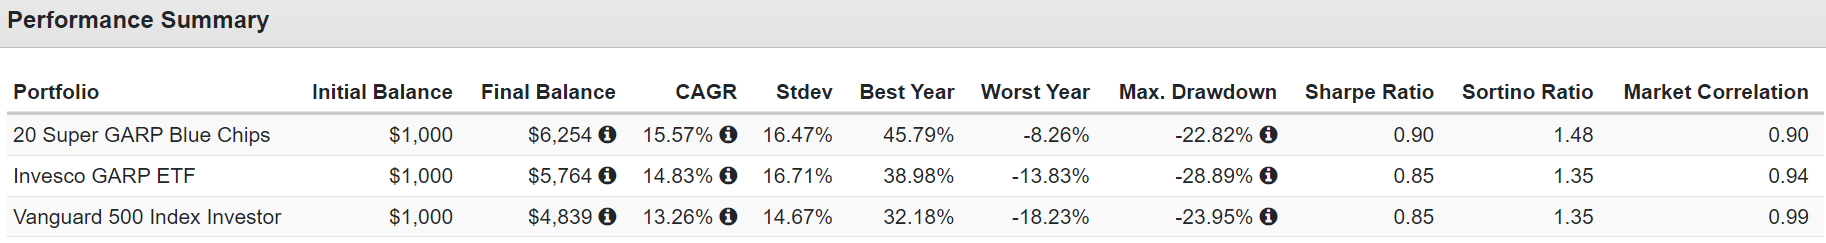
Over the last 13 years, GARP investing, as seen via SPGP, has beaten the red-hot S&P, which was powered higher by big tech.
Portfolio Visualizer Premium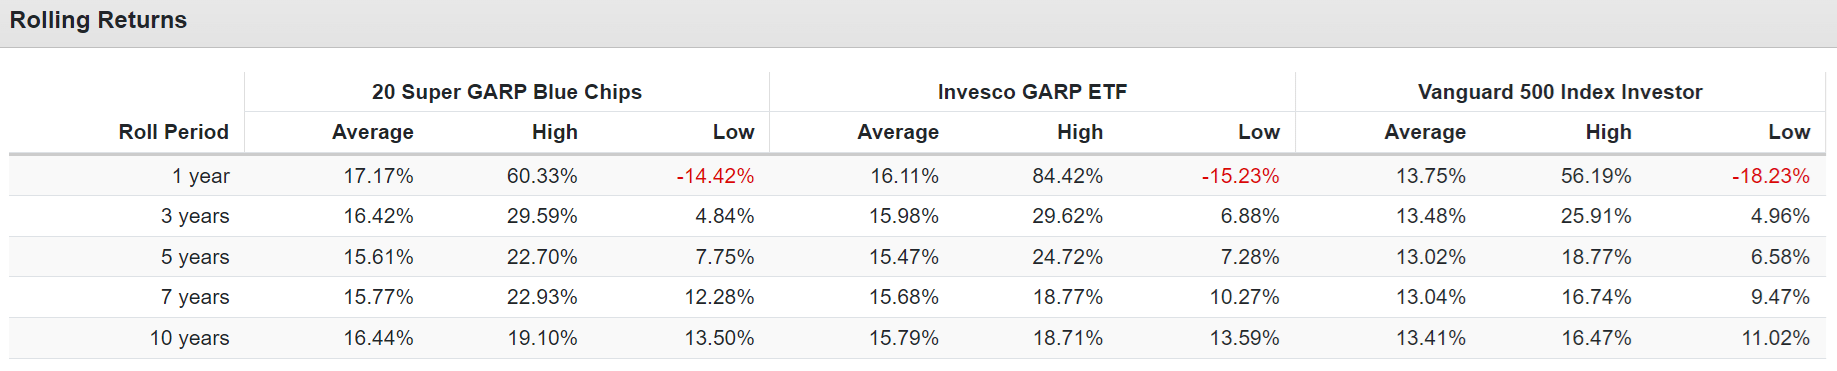
Value stocks didn't keep up with the S&P, and value ETFs that did (like COWZ) used EV/FCF as the basis for their portfolio construction.
But GARP investors beat the market when it was almost unbeatable.
The key is always to remember that the stock market is like a casino... in the long term, the house always wins.
When you put the odds in your favor by focusing on safety and quality first, and prudent valuation and sound risk management always, given enough time, the probability of success approaches 100%.