
Moussa81
Moussa81
This week features a whopping twenty-one new dividend increases, including two dividend kings. Dividend Kings S&P Global extends its 51-year streak with a meager 1.1% increase. Genuine Parts Company extends its 68-year streak with a 5.26% hike. This week, the average increase is 8.28%, and the median is 7%. Read on for the complete lists!
As an investor utilizing a dividend-growth strategy, I always look forward to receiving dividends, especially increases. I have observed that companies that regularly raise their dividend payouts perform significantly better than those that do not. I constantly monitor these companies and am happy to share my insights on upcoming dividend increases. I have compiled a list of top stocks expected to raise dividends in the upcoming week. You can confidently use this analysis to construct your portfolio and for timely purchases.
The information presented here is a result of merging two sources of data - the "U.S. Dividend Champions" spreadsheet from this website and upcoming dividend data from NASDAQ. The process combines data on companies with a consistent dividend growth history with future dividend payments. It's important to understand that all companies included in this list have consistently grown in dividends for at least five years.
Companies must have higher total yearly dividends to be included in this list. Hence, a company may not increase its dividend every calendar year, but the total annual dividend can still grow.
The ex-dividend date is when you must purchase shares to be eligible for the upcoming dividend or distribution. To qualify, you must have bought the shares by the end of the preceding business day. For instance, if the ex-dividend date is Tuesday, you must have acquired the shares by the market close on Monday. If the ex-dividend date is a Monday (or a Tuesday following a holiday on Monday), you must have bought the shares by the previous Friday.
Here are the definitions of the streak categories, as I'll use them throughout the piece.
| Category | Count |
| King | 2 |
| Champion | 2 |
| Contender | 9 |
| Challenger | 8 |
Data was sorted by the ex-dividend day (ascending) and then by the streak (descending):
| Name | Ticker | Streak | Forward Yield | Ex-Div Date | Increase Percent | Streak Category |
| S&P Global Inc. | (SPGI) | 51 | 0.86 | 26-Feb-24 | 1.11% | King |
| NextEra Energy, Inc. | (NEE) | 29 | 3.61 | 26-Feb-24 | 10.04% | Champion |
| Kinsale Capital Group, Inc. | (KNSL) | 8 | 0.12 | 26-Feb-24 | 7.14% | Challenger |
| Manulife Financial Corporation | (MFC) | 10 | 6.67 | 27-Feb-24 | 13.31% | Contender |
| CSX Corporation | (CSX) | 20 | 1.29 | 28-Feb-24 | 9.09% | Contender |
| Brookfield Infrastructure Partners LP Limited | (BIP) | 17 | 5.09 | 28-Feb-24 | 6.02% | Contender |
| Shutterstock, Inc. | (SSTK) | 5 | 2.73 | 28-Feb-24 | 11.11% | Challenger |
| Genuine Parts Company | (GPC) | 68 | 2.77 | 29-Feb-24 | 5.26% | King |
| Polaris Inc. | (PII) | 29 | 2.85 | 29-Feb-24 | 1.54% | Champion |
| Arthur J. Gallagher & Co. | (AJG) | 14 | 1 | 29-Feb-24 | 9.09% | Contender |
| GATX Corporation | (GATX) | 14 | 1.82 | 29-Feb-24 | 5.45% | Contender |
| UFP Industries, Inc. | (UFPI) | 12 | 1.2 | 29-Feb-24 | 10.00% | Contender |
| Mercantile Bank Corporation | (MBWM) | 12 | 3.69 | 29-Feb-24 | 2.94% | Contender |
| Interpublic Group of Companies, Inc. | (IPG) | 12 | 4.07 | 29-Feb-24 | 6.45% | Contender |
| Walker & Dunlop, Inc | (WD) | 7 | 2.77 | 29-Feb-24 | 3.17% | Challenger |
| Stifel Financial Corporation | (SF) | 7 | 2.23 | 29-Feb-24 | 16.67% | Challenger |
| Clearway Energy, Inc. Class A | (CWEN.A) | 5 | 6.75 | 29-Feb-24 | 1.77% | Challenger |
| Bank of the James Financial Group, Inc. | (BOTJ) | 5 | 3.42 | 29-Feb-24 | 25.00% | Challenger |
| Clearway Energy, Inc. Class C | (CWEN) | 5 | 6.8 | 29-Feb-24 | 1.77% | Challenger |
| Vulcan Materials Company (Holding Company) | (VMC) | 11 | 0.73 | 1-Mar-24 | 6.98% | Contender |
| Imperial Oil Limited | (IMO) | 8 | 3.94 | 1-Mar-24 | 20.00% | Challenger |
Streak: Years of dividend growth history are sourced from the U.S. Dividend Champions spreadsheet.
Forward Yield: The new payout rate is divided by the current share price.
Ex-Dividend Date: This is the date you need to own the stock.
Increase Percent: The percent increase.
Streak Category: This is the company's overall dividend history classification.
Here's a table mapping the new rates versus the old rates. It also reiterates the percentage increase. This table is sorted similarly to the first (ex-dividend day ascending, dividend streak descending).
| Ticker | Old Rate | New Rate | Increase Percent |
| SPGI | 0.9 | 0.91 | 1.11% |
| NEE | 0.468 | 0.515 | 10.04% |
| KNSL | 0.14 | 0.15 | 7.14% |
| MFC | 0.263 | 0.298 | 13.31% |
| CSX | 0.11 | 0.12 | 9.09% |
| BIP | 0.382 | 0.405 | 6.02% |
| SSTK | 0.27 | 0.3 | 11.11% |
| GPC | 0.95 | 1 | 5.26% |
| PII | 0.65 | 0.66 | 1.54% |
| AJG | 0.55 | 0.6 | 9.09% |
| GATX | 0.55 | 0.58 | 5.45% |
| MBWM | 0.34 | 0.35 | 2.94% |
| UFPI | 0.3 | 0.33 | 10.00% |
| IPG | 0.31 | 0.33 | 6.45% |
| SF | 0.36 | 0.42 | 16.67% |
| WD | 0.63 | 0.65 | 3.17% |
| CWEN.A | 0.396 | 0.403 | 1.77% |
| CWEN | 0.396 | 0.403 | 1.77% |
| BOTJ | 0.08 | 0.1 | 25.00% |
| VMC | 0.43 | 0.46 | 6.98% |
| IMO | 0.50 CAD | 0.60 CAD | 20.00% |
Some different metrics related to these companies include yearly pricing action and the P/E ratio. The table is sorted the same way as the table above.
| Ticker | Current Price | 52 Week Low | 52 Week High | PE Ratio | % Off Low | % Off High |
| SPGI | 424.25 | 318.9 | 461.16 | 33.67 | 33% Off Low | 8% Off High |
| NEE | 57.09 | 46.76 | 78.09 | 36.98 | 22% Off Low | 27% Off High |
| KNSL | 495.64 | 277.57 | 528.04 | 81.3 | 79% Off Low | 6% Off High |
| MFC | 23.99 | 16.65 | 24.89 | 9.1 | 44% Off Low | 4% Off High |
| CSX | 37.1 | 27.02 | 37.39 | 25.59 | 37% Off Low | 1% Off High |
| BIP | 31.83 | 20.73 | 36.35 | 0 | 54% Off Low | 12% Off High |
| SSTK | 43.89 | 33.6 | 76.78 | 51.44 | 31% Off Low | 43% Off High |
| GPC | 144.48 | 125.45 | 176.82 | 780.38 | 15% Off Low | 18% Off High |
| PII | 92.73 | 82 | 136.65 | 294.31 | 13% Off Low | 32% Off High |
| GATX | 127.29 | 96.75 | 131.86 | 16.4 | 32% Off Low | 3% Off High |
| AJG | 240.13 | 173.16 | 253.43 | 29.02 | 39% Off Low | 5% Off High |
| MBWM | 37.96 | 22.39 | 42.82 | 9.65 | 70% Off Low | 11% Off High |
| UFPI | 110.16 | 73.95 | 128.65 | 14.94 | 49% Off Low | 14% Off High |
| IPG | 32.46 | 26.92 | 40.15 | 16.54 | 21% Off Low | 19% Off High |
| WD | 93.94 | 59.6 | 113.67 | 12.54 | 58% Off Low | 17% Off High |
| SF | 75.29 | 52.54 | 77.55 | 13.26 | 43% Off Low | 3% Off High |
| CWEN.A | 21.96 | 17.18 | 29.49 | 72.98 | 28% Off Low | 26% Off High |
| BOTJ | 11.69 | 7.74 | 12.63 | 10.45 | 51% Off Low | 7% Off High |
| CWEN | 23.69 | 18.3 | 30.84 | 78.12 | 29% Off Low | 23% Off High |
| VMC | 253.54 | 158.77 | 260.81 | 31.86 | 60% Off Low | 3% Off High |
| IMO | 60.95 | 43.3 | 62.67 | 0 | 41% Off Low | 3% Off High |
I've arranged the table in descending order for investors to prioritize the current yield. As a bonus, the table also features some historical dividend growth rates. Moreover, I have incorporated the "Chowder Rule," which is the sum of the current yield and the five-year dividend growth rate.
| Ticker | Yield | 1 Yr DG | 3 Yr DG | 5 Yr DG | 10 Yr DG | Chowder Rule |
| CWEN | 6.8 | 8 | 13.7 | 4.2 | 10.9 | |
| CWEN.A | 6.75 | 8 | 13.7 | 4.2 | 21 | 10.9 |
| MFC | 6.67 | 6 | 8.8 | 8.8 | 7.8 | 15.3 |
| BIP | 5.09 | 6.3 | 5.8 | 6.3 | 8.3 | 11.4 |
| IPG | 4.07 | 6.9 | 6.7 | 8.1 | 15.3 | 12.2 |
| IMO | 3.94 | 27.6 | 29.2 | 20.7 | 11.8 | 24.7 |
| MBWM | 3.69 | 6.4 | 6.2 | 7.6 | 11.5 | 11.3 |
| NEE | 3.61 | 10 | 10.1 | 11 | 11 | 14.6 |
| BOTJ | 3.42 | 10.4 | 7.9 | 8 | 11.5 | |
| PII | 2.85 | 1.6 | 1.6 | 1.6 | 4.5 | 4.5 |
| WD | 2.77 | 5 | 20.5 | 20.3 | 23 | |
| GPC | 2.77 | 6.2 | 6.4 | 5.7 | 5.9 | 8.5 |
| SSTK | 2.73 | 12.5 | 16.7 | |||
| SF | 2.23 | 20 | 47 | 35.1 | 37.3 | |
| GATX | 1.82 | 5.8 | 4.7 | 4.6 | 5.9 | 6.4 |
| CSX | 1.29 | 10 | 8.3 | 8.5 | 8.4 | 9.8 |
| UFPI | 1.2 | 15.8 | 30.1 | 25 | 23.2 | 26.1 |
| AJG | 1 | 7.9 | 6.9 | 6.1 | 4.6 | 7.1 |
| SPGI | 0.86 | 8.4 | 10.3 | 12.5 | 12.4 | 13.4 |
| VMC | 0.73 | 7.5 | 8.2 | 9 | 45.7 | 9.7 |
| KNSL | 0.12 | 7.7 | 15.9 | 14.9 | 15 |
My investment strategy involves finding stocks combining increasing dividends and consistently outperforming the market. I use the Schwab U.S. Dividend Equity ETF (SCHD) as my dividend growth benchmark. This ETF has a remarkable track record of exceptional performance, a higher yield than the S&P 500, and a proven record of growing dividends. I prefer to invest in the ETF if a stock cannot beat the benchmark. I've added companies to my personal investment portfolio based on this analysis. I also routinely use this analysis to choose timely additional purchases.
I'm comparing SCHD to the companies with the highest 10-year dividend growth rates. The 10-year dividend growth rate is one factor in the methodology behind SCHD. It's also a proxy for success, as it is easier to continually grow a dividend over long periods, with the share price following. Here are the results.
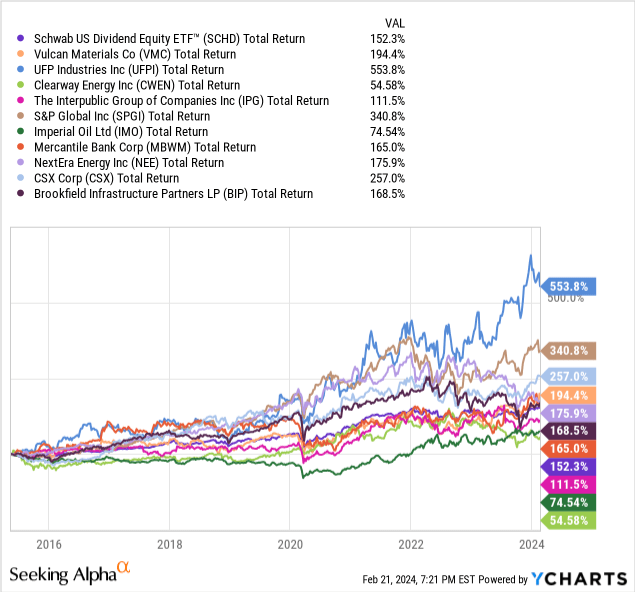
SCHD returned 152% over the period. UFPI was the outstanding performer, with a 554% total return! Also, SPGI, CSX, VMC, NEE, BIP, and MBWM outperformed SCHD.
However, there's a significant separation between SPGI (341%) and CSX (257%) versus the others.
Bringing up the bottom of this pack were IPG, IMO, and finally CWEN. I own SPGI, but it looks like I need to revisit UFPI.
Please do your due diligence before making any investment decision.
Editor's Note: This article discusses one or more securities that do not trade on a major U.S. exchange. Please be aware of the risks associated with these stocks.