
courtneyk
courtneyk
Whenever a red-hot stock, sector, or investing strategy is working well, it's very easy to lose sight of the time-tested principles of disciplined investing.
These are the actual questions that will determine whether almost all of us retire in comfort, dignity, splendor, or not at all.
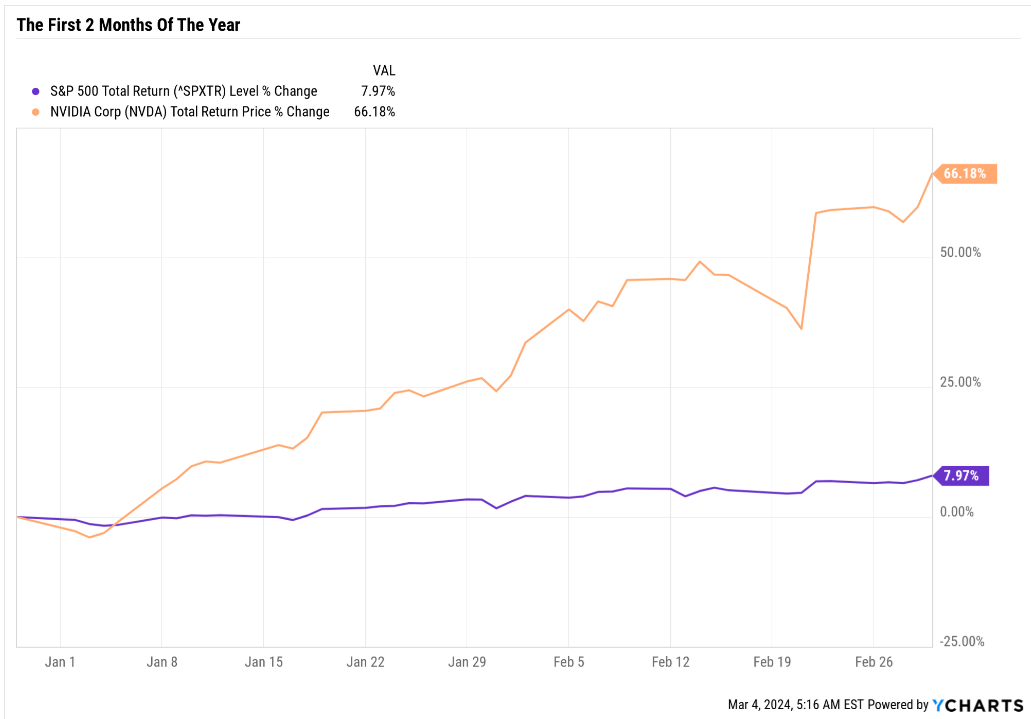
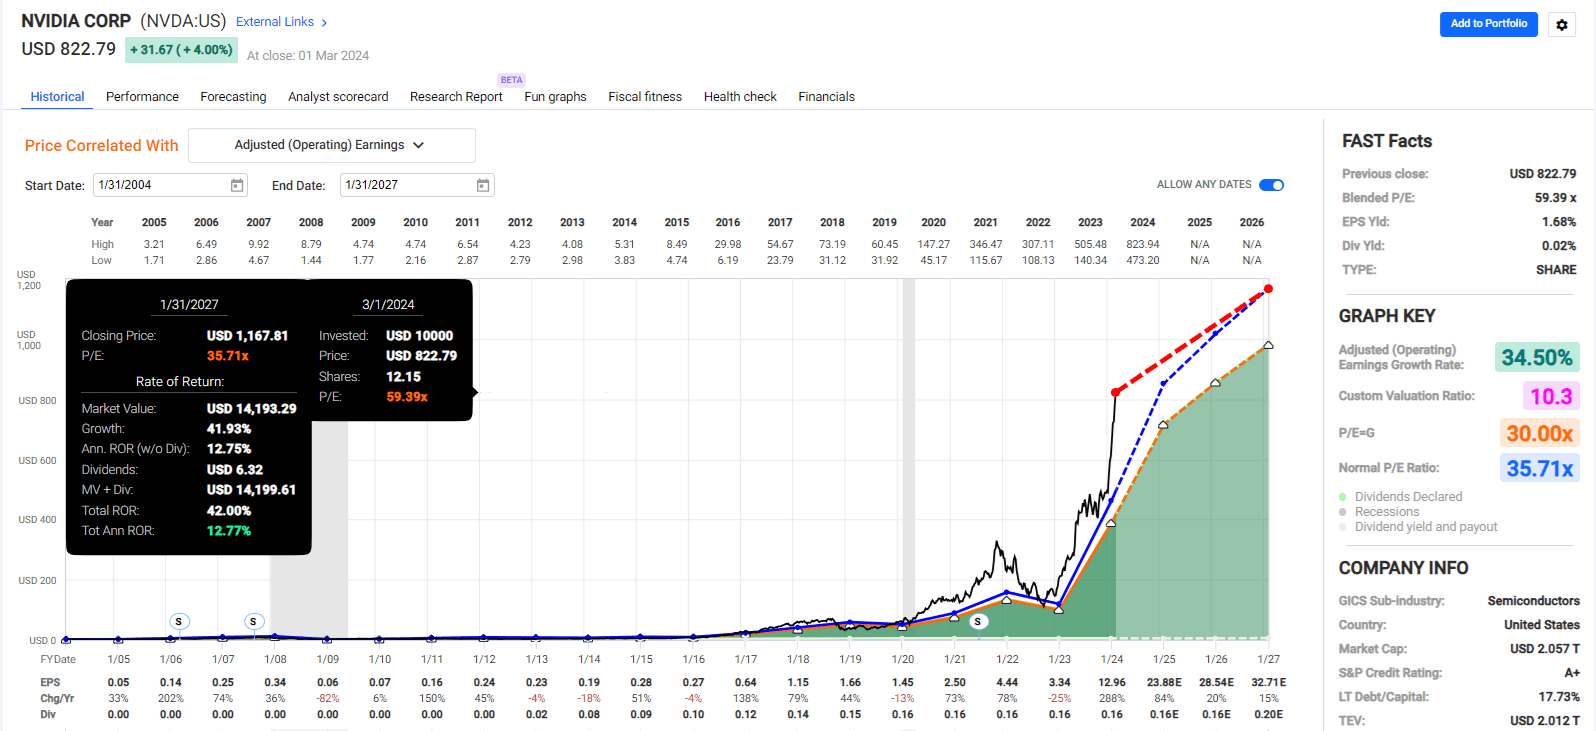
But since the S&P is now up 16 of the last 18 weeks, something that hasn't happened since 1971, and NVIDIA has become the "magnificent one," the first question many investors have is "what is the next great stock I should buy."
YCharts
It's easy to become giddy, and even greedy, and experience FOMO, the "fear of missing out" when stocks are rising at annualized rate of 50% and NVDA is smashing records.
Bloomberg
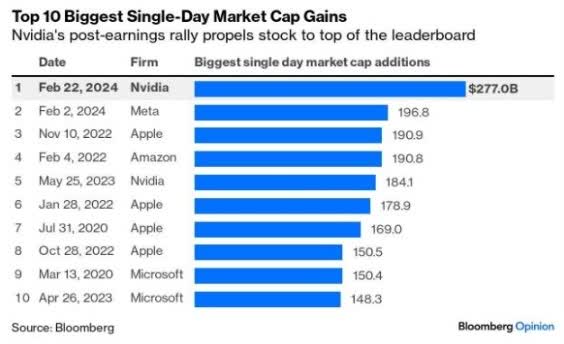
NVDA has added $1 trillion in market cap in two months, more than the value of Berkshire Hathaway (BRK.A) (BRK.B).
But this article is for those worried about bubbles and want to put their savings to work safely and responsibly.
Those who are striving for a comfortable or even rich retirement.
Remember that the best plan in the world will fail if you can't stick with it during bumpy times.
The downside of a 100% stock portfolio is that even if diversified, you're making a relatively concentrated bet on a handful of companies.
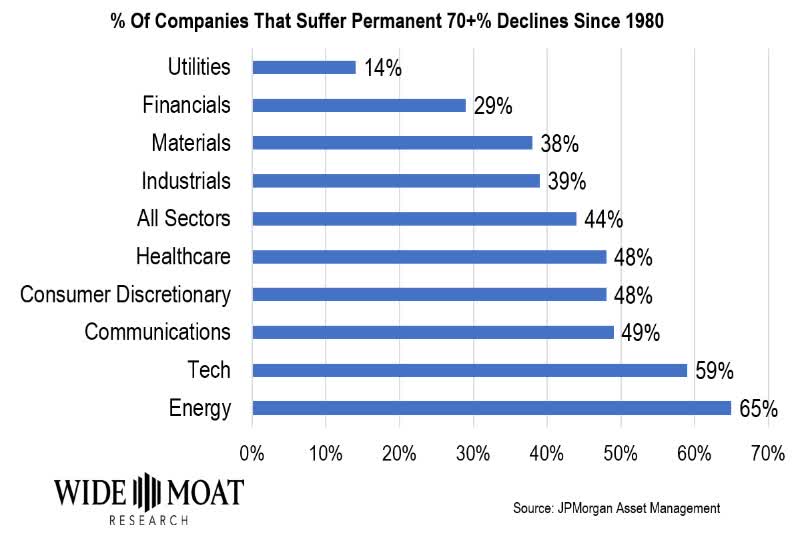
Stock picking is hard, at least in the long term, and here's why.
Wide Moat Research
Almost half of all US stocks from 1980 to 2021 suffered 70%-plus crashes and never recovered. Their fundamentals broke and stayed broken.
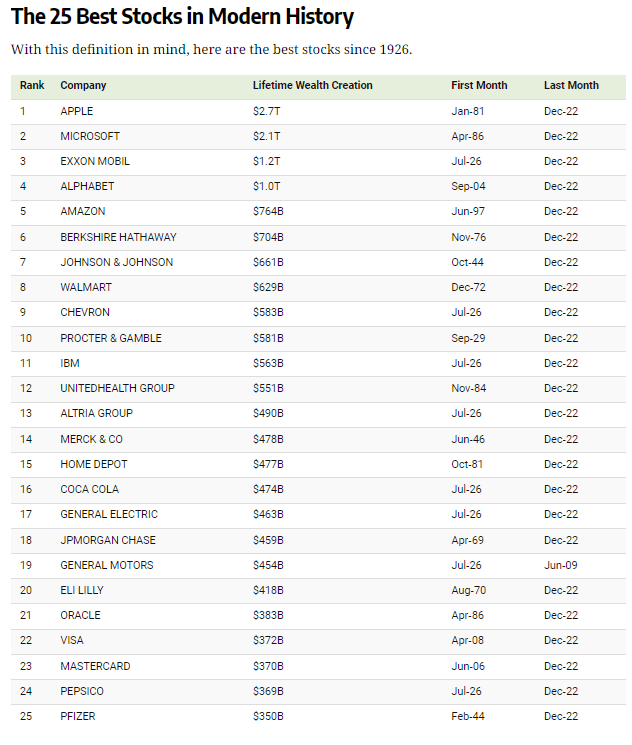
Even more shocking, a study by Hendrik Bessembinder of Arizona State University shows the best stocks of the last century generated almost all of the stock market's gains.
Investments in publicly-listed U.S. stocks enhanced shareholder wealth by more than $55.1 trillion in aggregate during the 1926 to 2022 period, even while investments in the majority (58.6%) of the 28,114 individual stocks led to reduced rather than increased shareholder wealth.
Visual Capitalist
Out of 28,141 companies, the top 25 accounted for 33% of all stock market profits of the last century.
Apple (AAPL) accounts for 5% of all US stock market profits since 1926.
You can see the challenge. A single big winner can supercharge your portfolio, but most companies won't do very well. Half of them is likely to crash and never recover.
This is where the Zen portfolio strategy comes in.
The idea behind the Zen strategy is Ritholtz Wealth Management's core ETF strategy augmented with high-conviction stock ideas.
ETFs provide instant diversification and can't go to zero (outside of an apocalypse in which money has no meaning).
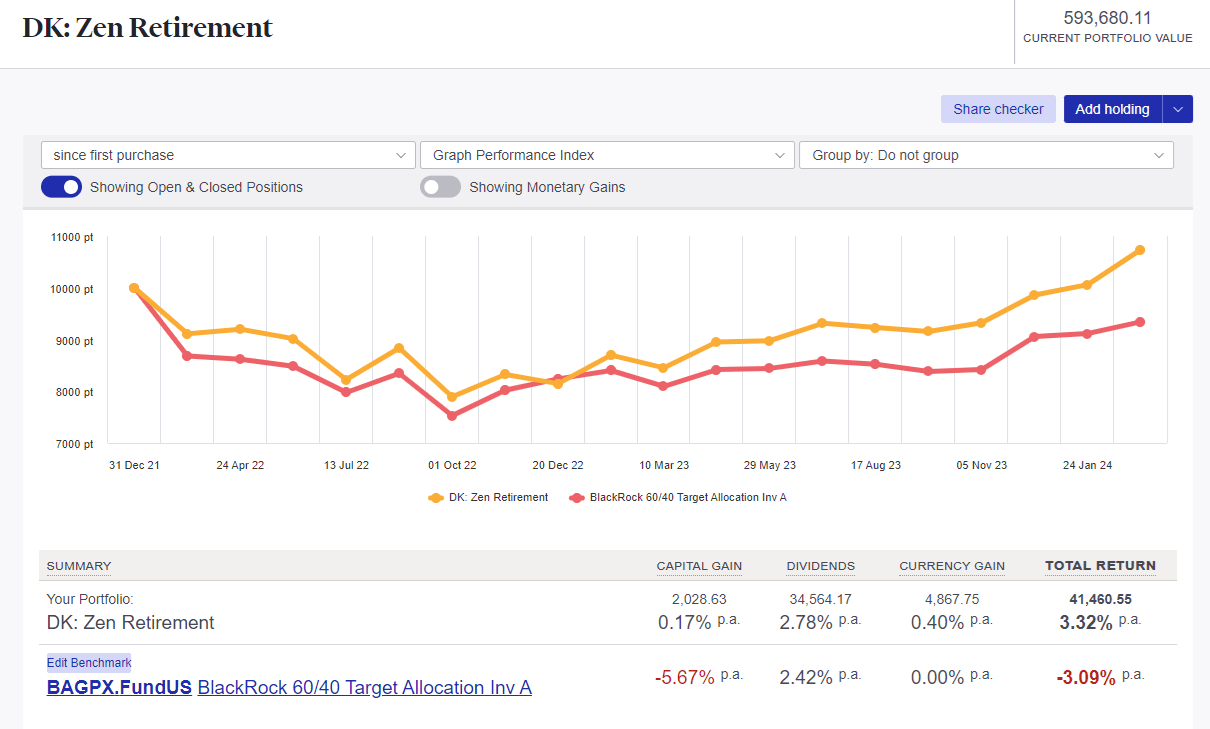
Sharesight
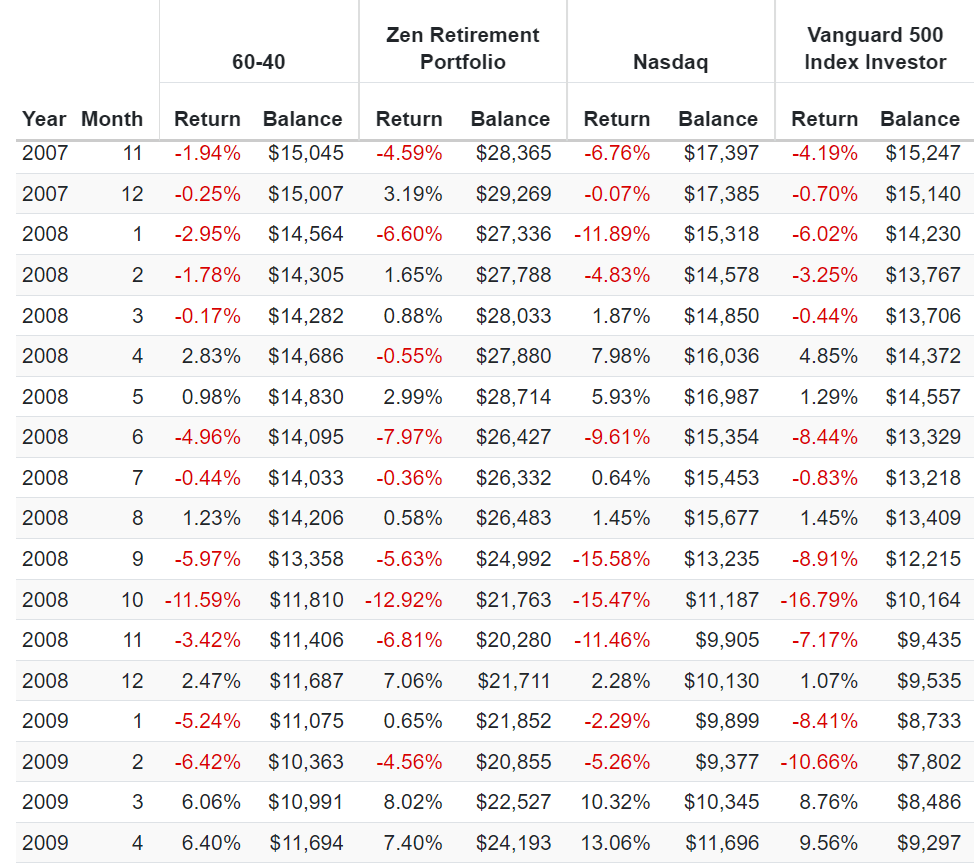
You can see how the last two years have been challenging for the 60-40 retirement portfolio, which is down 6%, not counting inflation. Our Zen Retirement portfolio was less volatile than the 60-40 during the 2022 inflation crash and has delivered far better returns.
By using a 50% index fund as your core and then investing the other 50% into ten high conviction ideas, 5% each, you can take the solid long-term returns of the stock market and boost them by a significant amount.
| Core ETF | Strategy | Yield | Growth (Morningstar) Consensus | LT Total Return Potential |
| BAGPX | 60-40 | 2.0% | 6.40% | 8.4% |
| 10 Retirement Blue-Chips | 4.70% | 16.40% | 21.10% | |
ZEN Retirement Portfolio | 3.4% | 11.40% | 14.8% |
(Source: Morningstar, FactSet)
A 50% 60-40 retirement portfolio augmented by these 10 retirement blue chips significantly boosts the dividend yield. And according to the FactSet consensus of all analysts, it also could double the long-term income growth and total returns.
How did I find 10 companies that could potentially transform an 80% stock, 20% bond retirement portfolio into an income growth portfolio that analysts think could beat the Nasdaq in the future?
Here's the simple screen I did to find five ultra-yield blue chips and five hyper-growth blue chips, which combine into a 10-stock approach that can help a 60-40 retirement portfolio.
| Screening Criteria | Companies Remaining | % Of Master List | |
| 1 | BHS Rating "reasonable buy, good buy, strong buy, very strong buy, ultra value buy" | 261 | 51.68% |
| 2 | Non-Speculative | 224 | 44.36% |
| 3 | Blue-Chip Quality Or Better(10+ Quality) | 220 | 43.56% |
| 4 | Credit Rating Investment Grade (BBB- or better) | 186 | 36.83% |
| 5 | LT Total Return potential 10+% | 107 | 21.19% |
| 6 | Sort By Yield | 0.00% | |
| 7 | Top 5 Yielders | 5 | 0.99% |
| 8 | Sort By LT Return Potential | 0.00% | |
| 9 | Top 5 Total Return Stocks | 0.00% | |
| 10 | Under "tickers" select these 10 stocks | 10 | 1.98% |
| Total Time | 3 minutes |
I always start out every screen targeting my core.
Everyone's core is different, the fundamentals they care most about.
But for me, I always seek to provide actionable ideas, which are:
Speculative stocks are usually three kinds of companies.
So what are these 10 blue-chip bargains that could potentially transform a retirement portfolio into a high-yield dividend growth powerhouse?
Let's break them down by style.
Portfolio Visualizer Premium
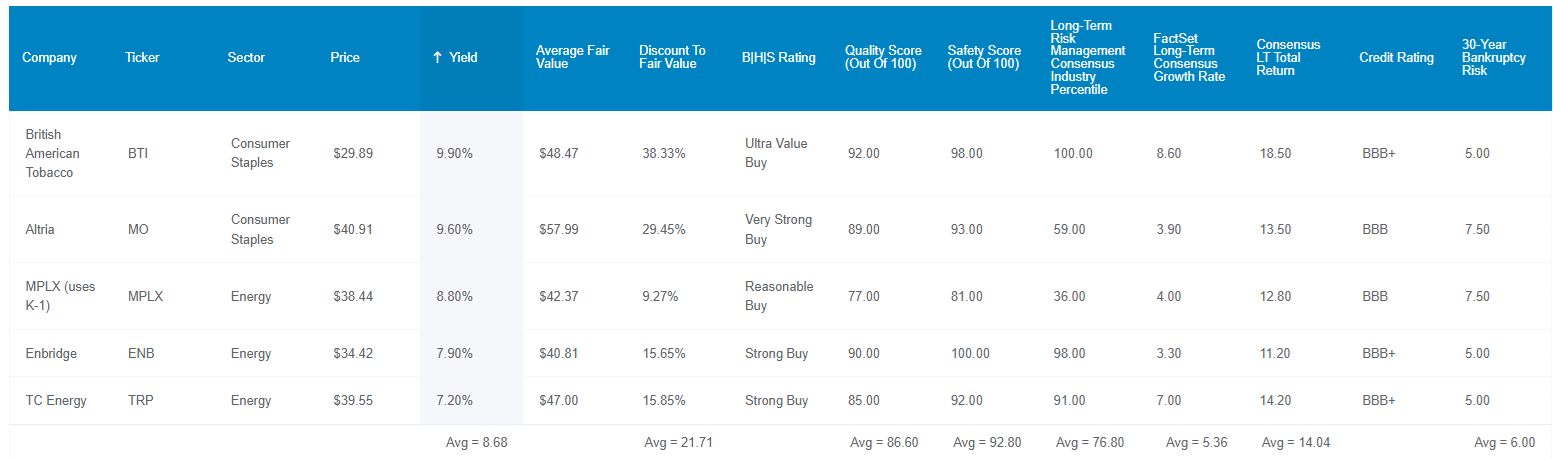
Let's review the fundamentals of these ultra yielders.
They yield 8.7% on average, are 22% historically undervalued, and have a 93% average safety score.
S&P rates them BBB+ stable with an average 30-year bankruptcy risk of 6% and long-term risk management in the top 24% of all global companies.
And the FactSet consensus from all analysts covering these companies is for 5% to 6% long-term growth, driving 14% to 15% long-term total return potential and 14% to 15% long-term income growth if you reinvest the dividends.
Portfolio Visualizer Premium
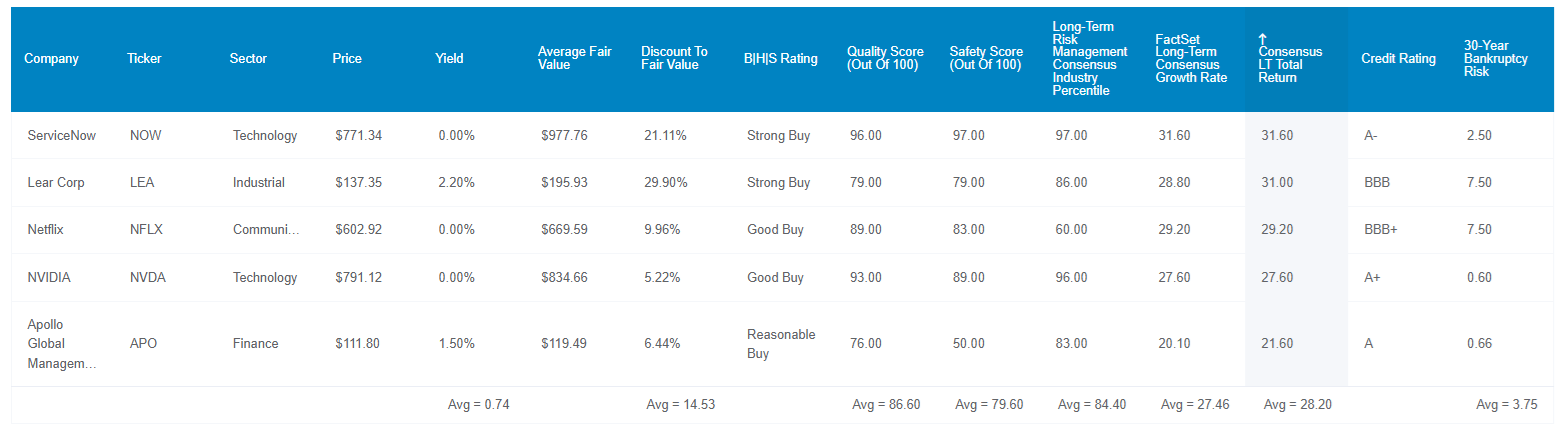
These hyper-growth blue chips have a 0.7% yield but growth consensus of 27% to 28% and 28% to 29% long-term return potential.
They have an A- stable average credit rating, and according to S&P, long-term risk management in the top 15% of global companies.
Here are the fundamentals for all ten retirement blue-chips designed to boost a 60-40 retirement portfolio.
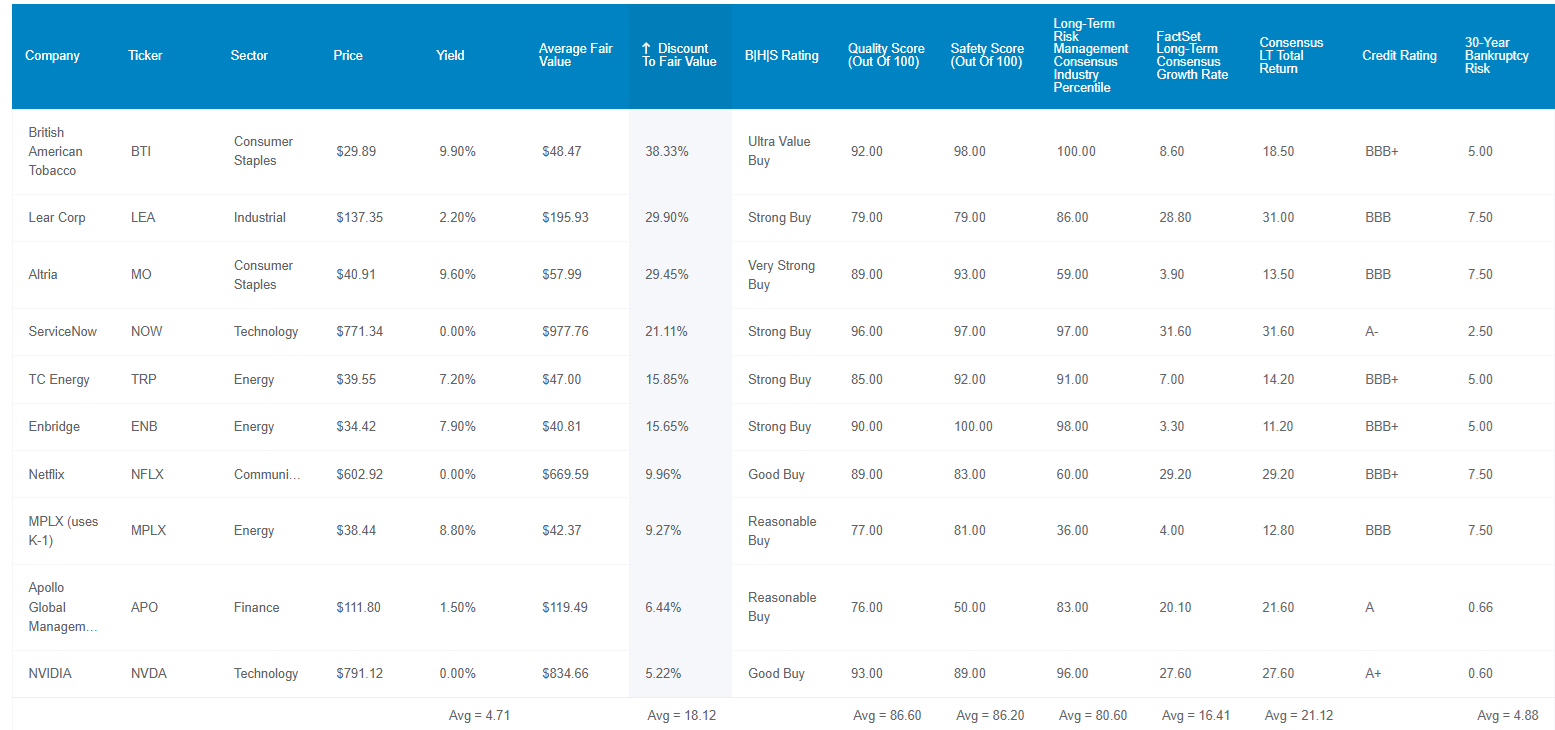
Portfolio Visualizer Premium
A 4.7% yielding stock portfolio that's 18% historically undervalued with an average BBB+ credit rating and long-term risk management in the top 19% of global companies.
The current FactSet median long-term growth consensus is 16% to 17% with 21% to 22% long-term return potential and income growth for dividend re-investors.
A 5% position in each of these blue chips provides good risk management across six sectors, and you also have the full diversification benefits of owning 30% in the S&P and 20% in bonds.
This Zen Retirement portfolio is simple and historically highly effective at beating the 60-40. You can even potentially outperform the S&P and Nasdaq.
While historical returns are no guarantee of future results, they can give us an idea of whether current analyst forecasts for future returns and income growth are reasonable or historically consistent.
Portfolio Visualizer Premium
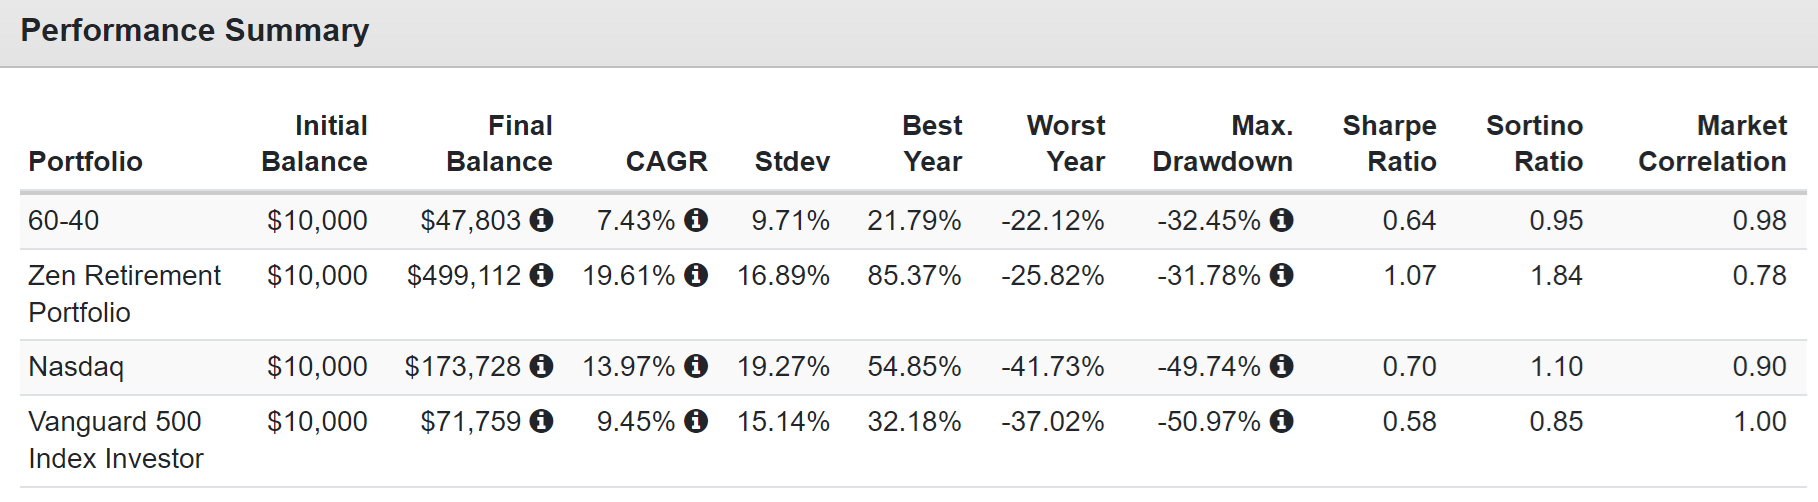
The Zen Retirement portfolio delivered far better returns than the 60-40, the S&P, and even the Nasdaq, with lower volatility during the most severe bear markets.
It only fell 32% during the Great Recession and had twice the negative volatility-adjusted total returns (Sortino Ratio) of the 60-40.
Portfolio Visualizer Premium
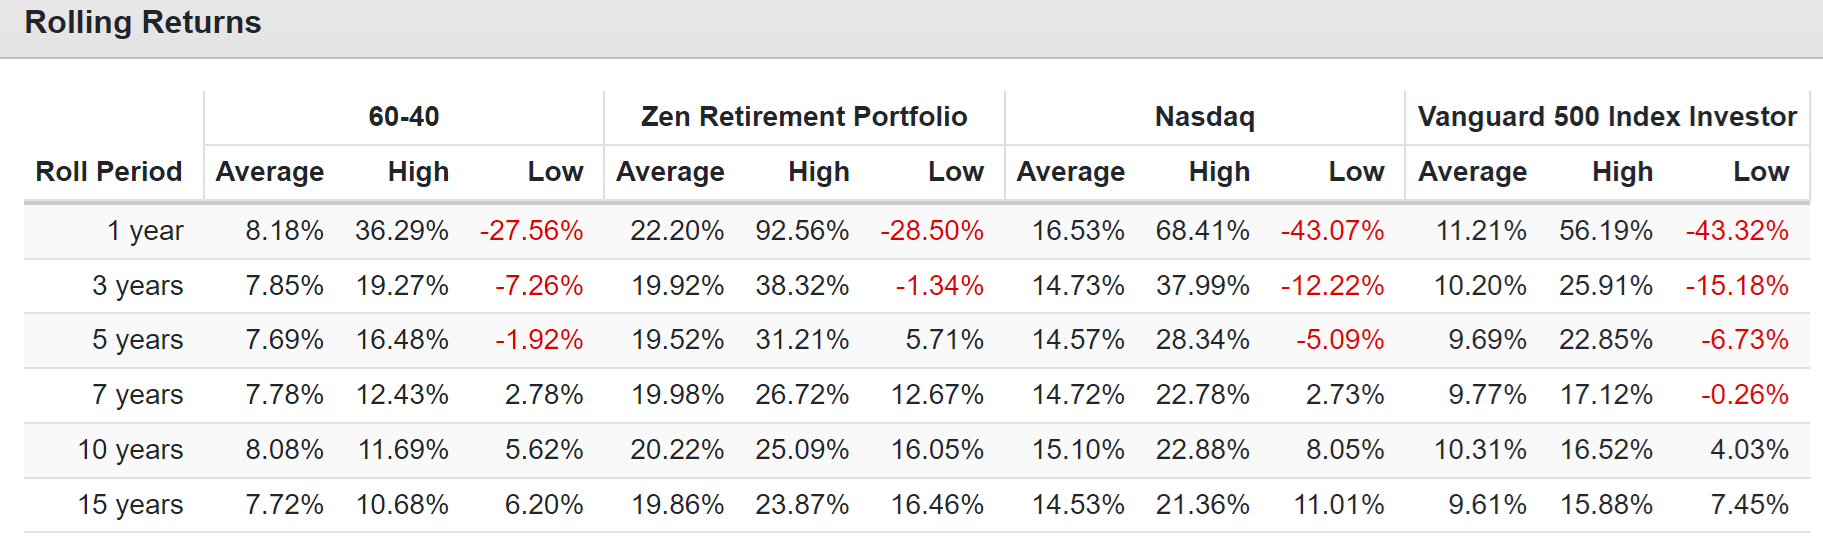
Consistent outperformance of not just the 60-40 for the last 23 years but even the S&P and Nasdaq.
And what about income growth?
Portfolio Visualizer Premium
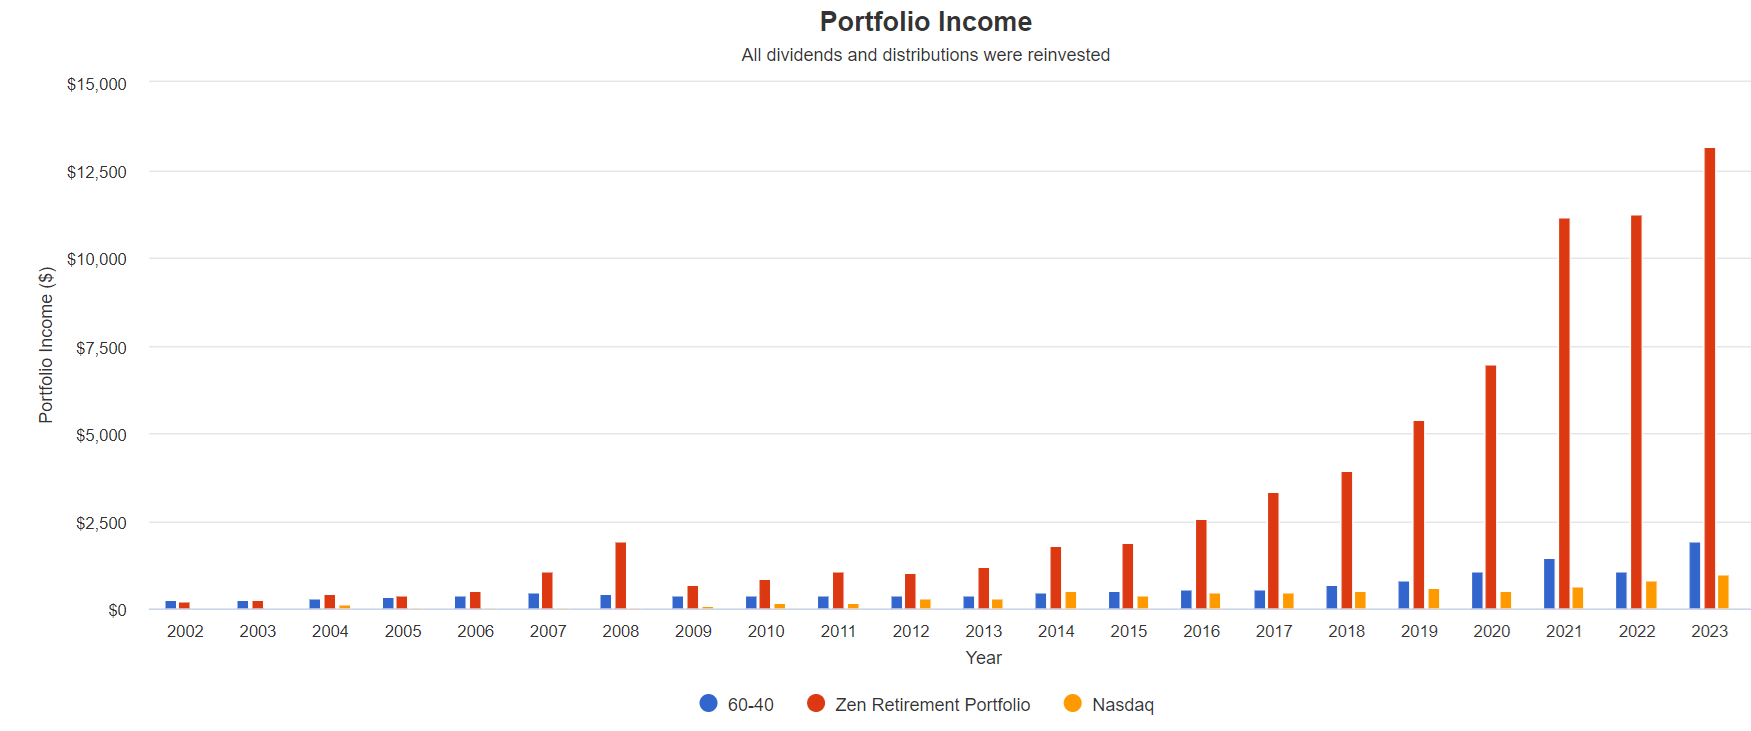
Here are the historical income growth rates of the 60-40, the Zen Retirement portfolio, and the Nasdaq.
Twice the long-term income growth and a yield on cost of 132% after 23 years of income compounding.
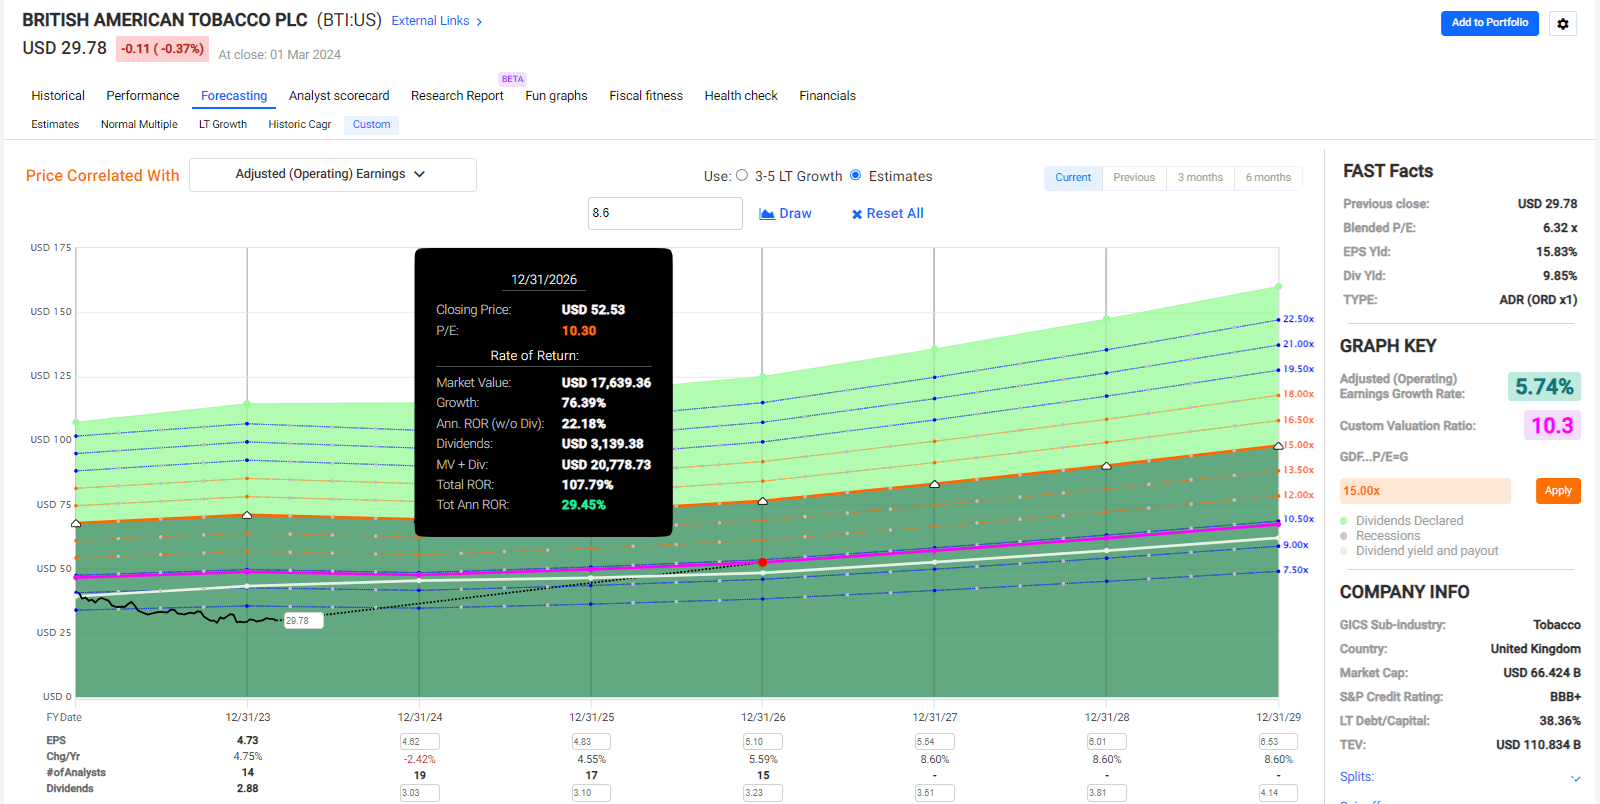
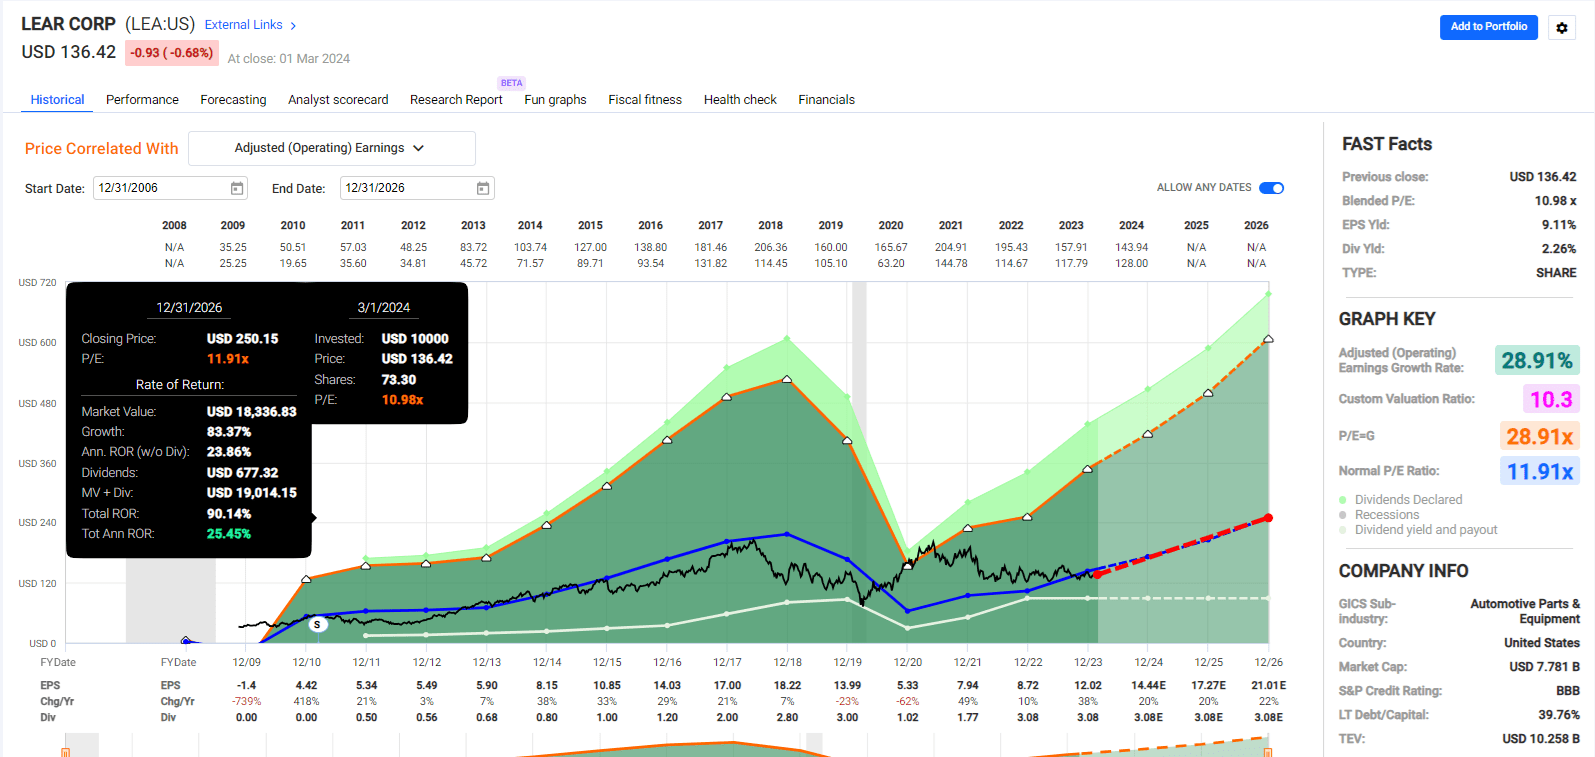
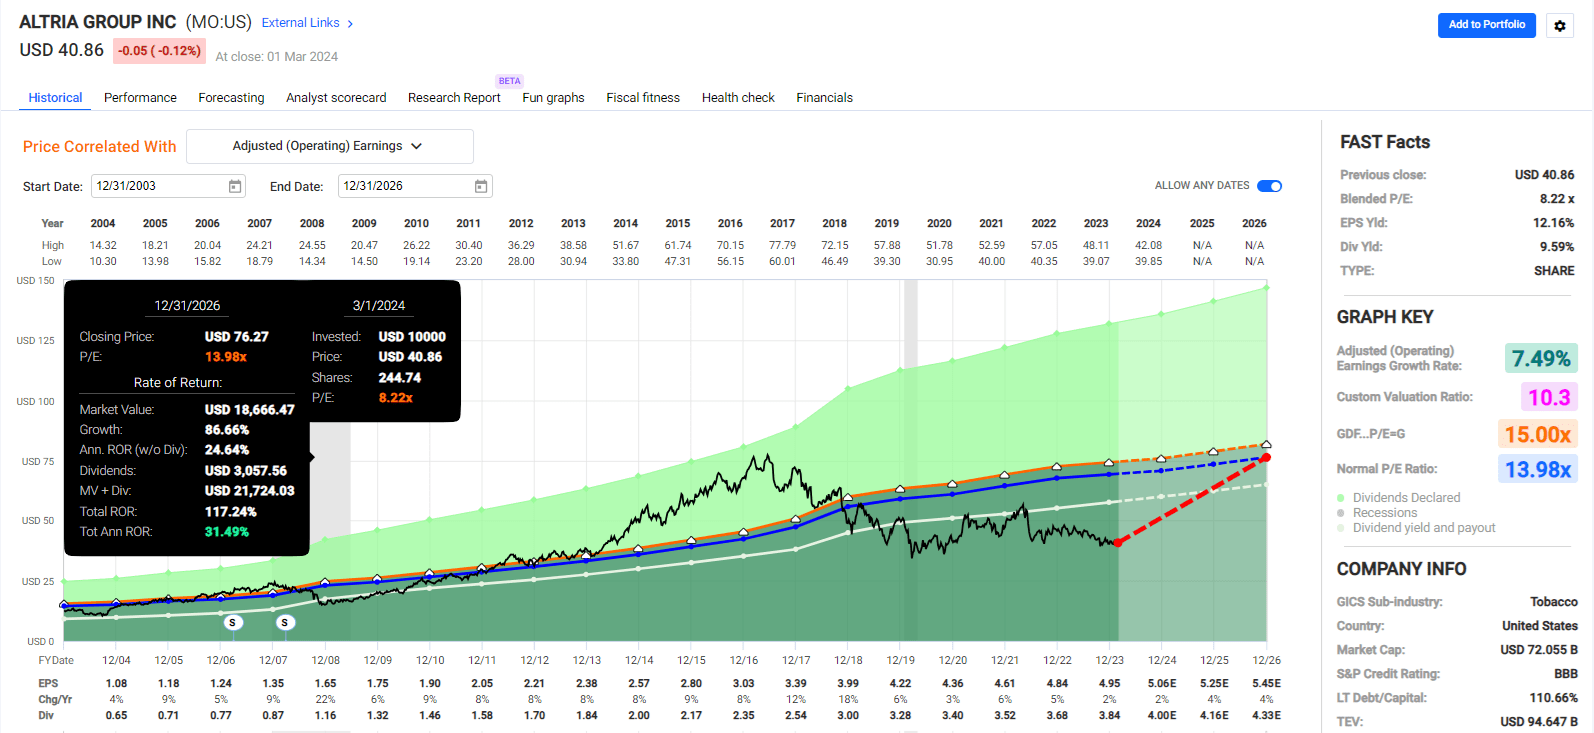
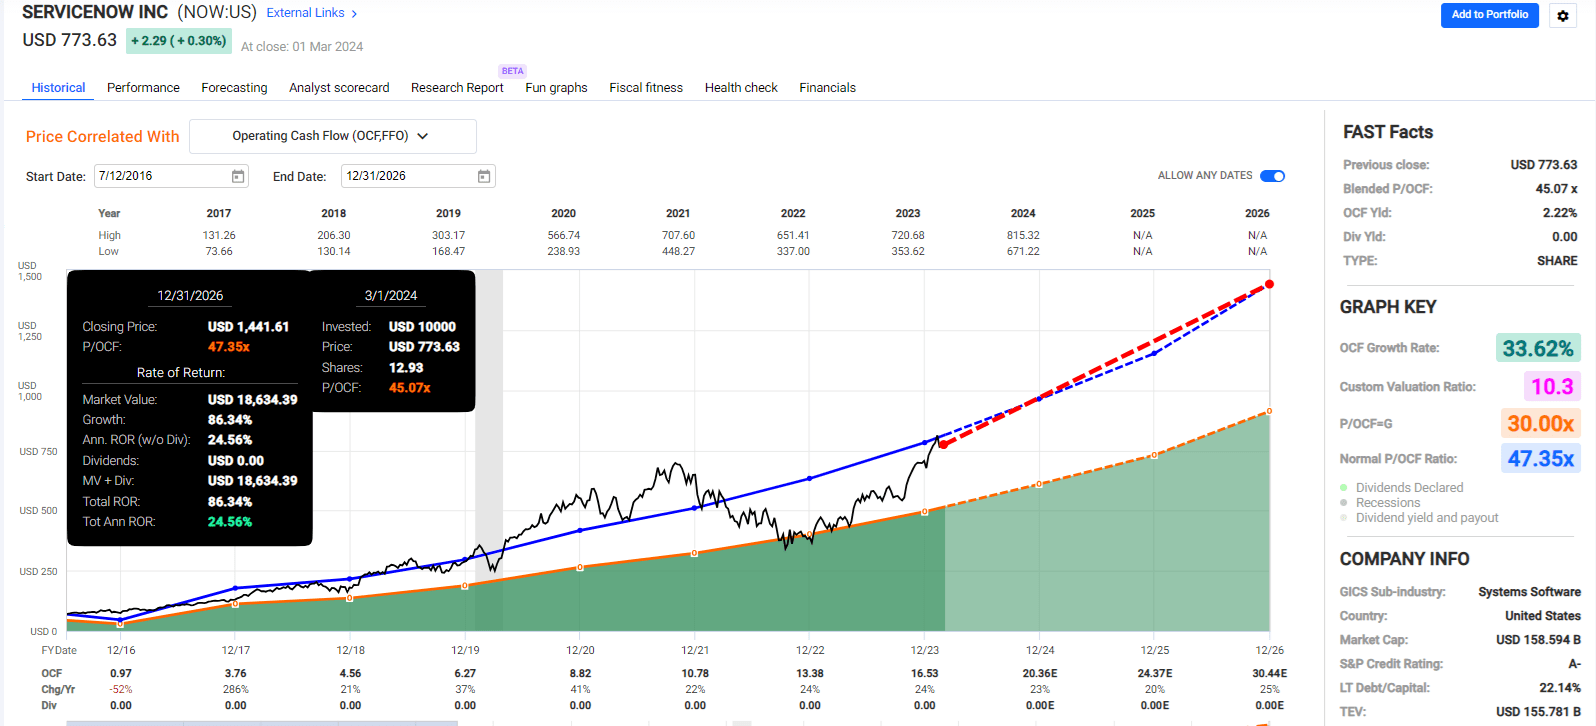
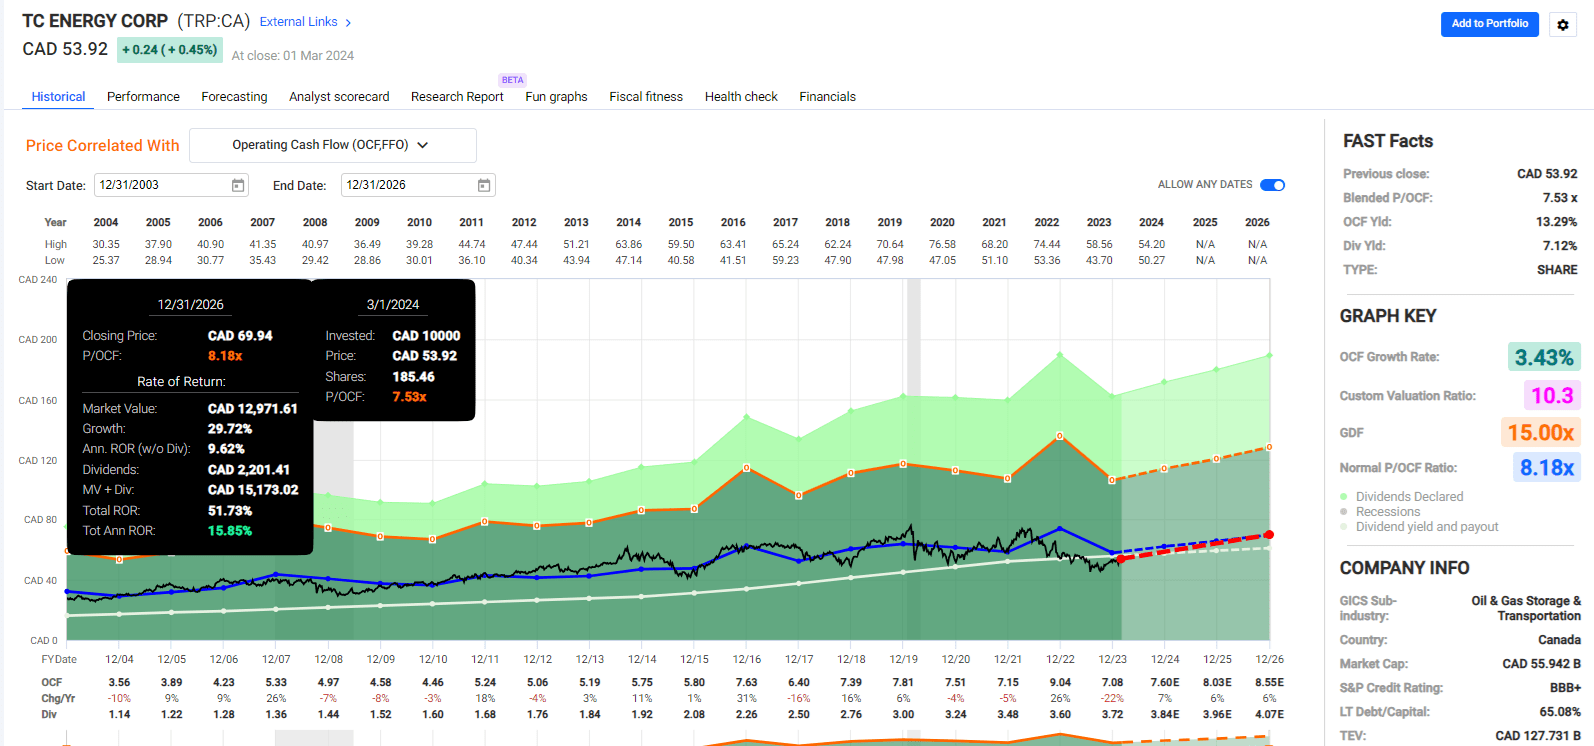
The average 12-month fundamentally justified total return potential for these ten companies is 29%.
FAST Graphs, FactSet
FAST Graphs, FactSet
FAST Graphs, FactSet
FAST Graphs, FactSet
FAST Graphs, FactSet
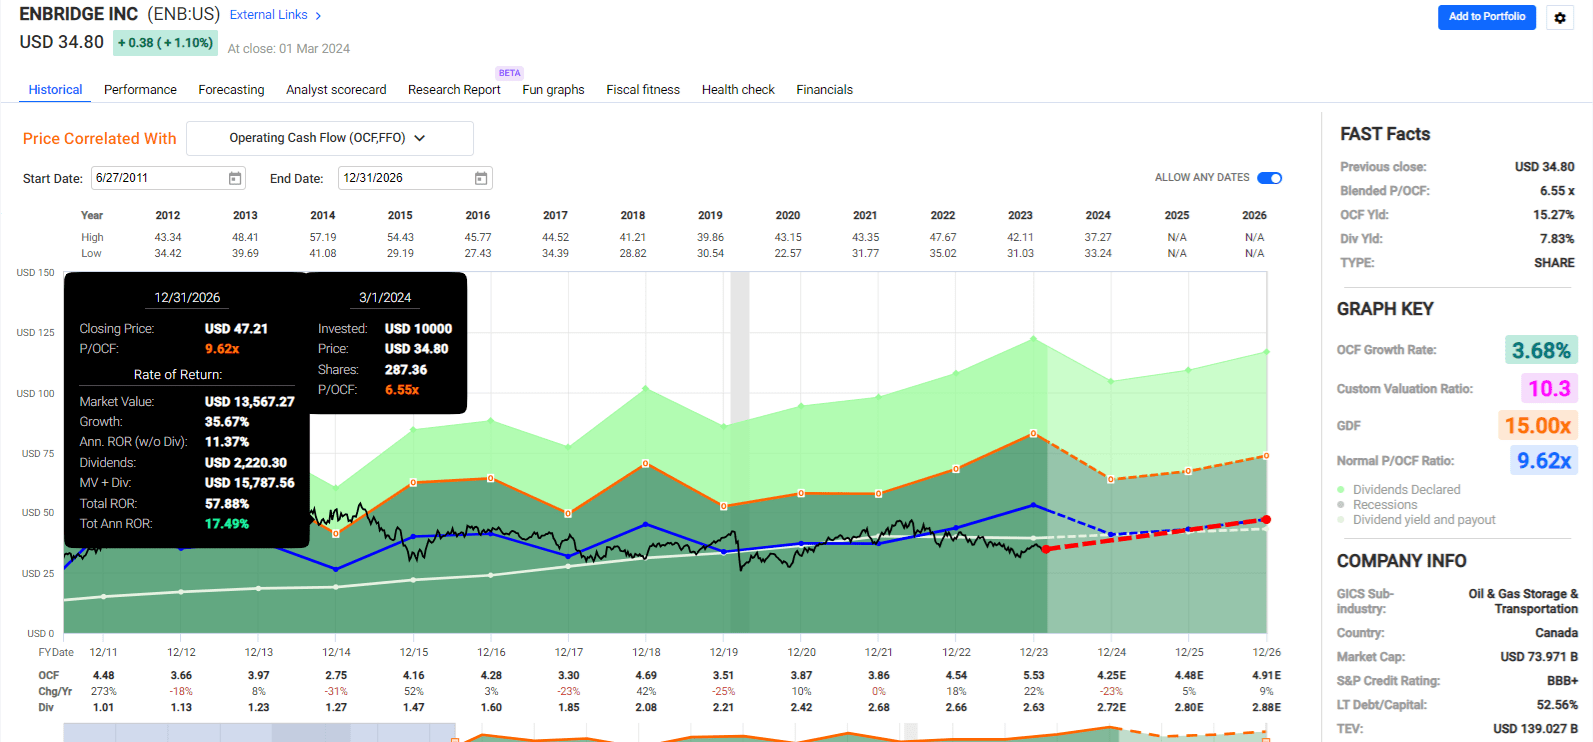
FAST Graphs, FactSet
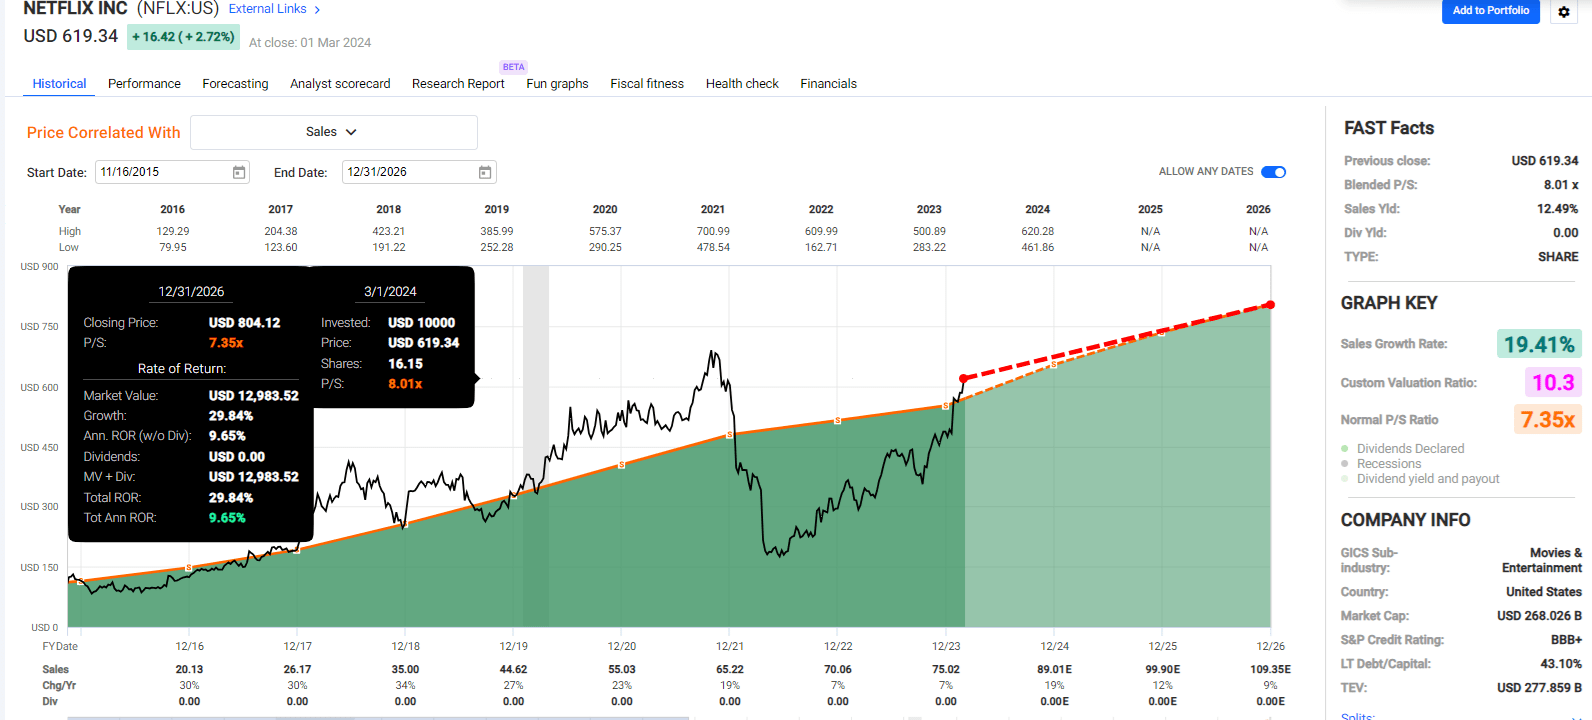
FAST Graphs, FactSet
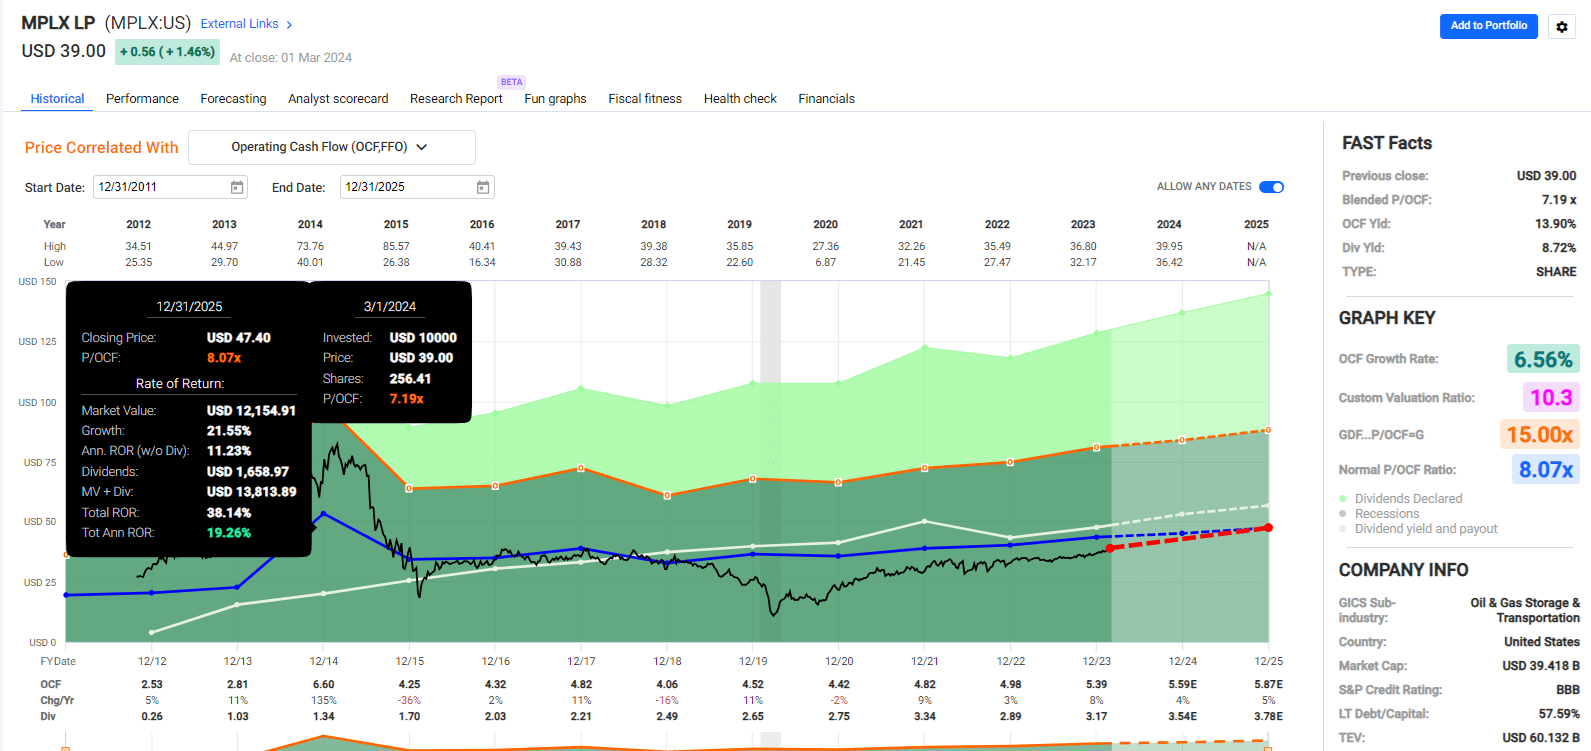
FAST Graphs, FactSet
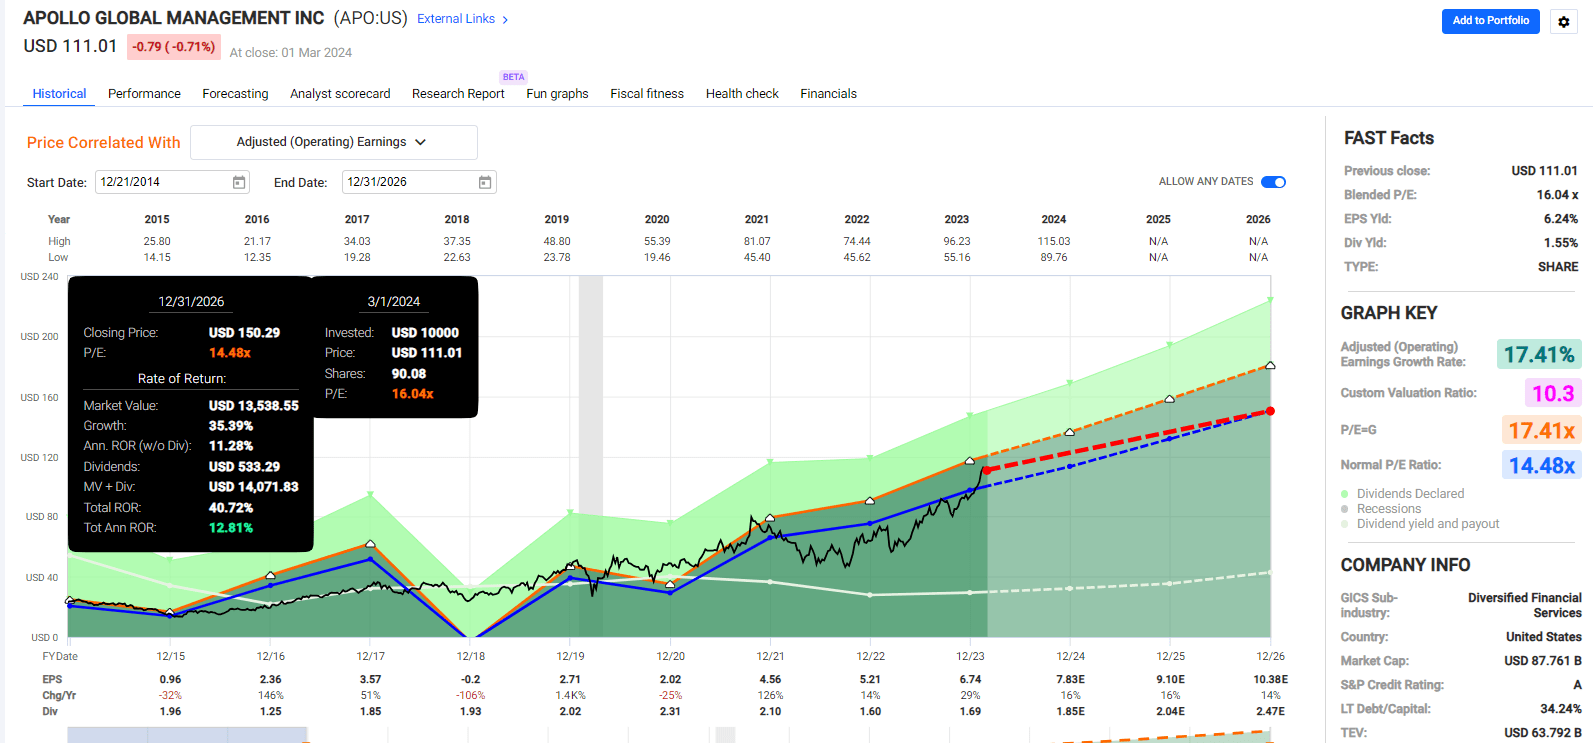
FAST Graphs, FactSet
FAST Graphs, FactSet
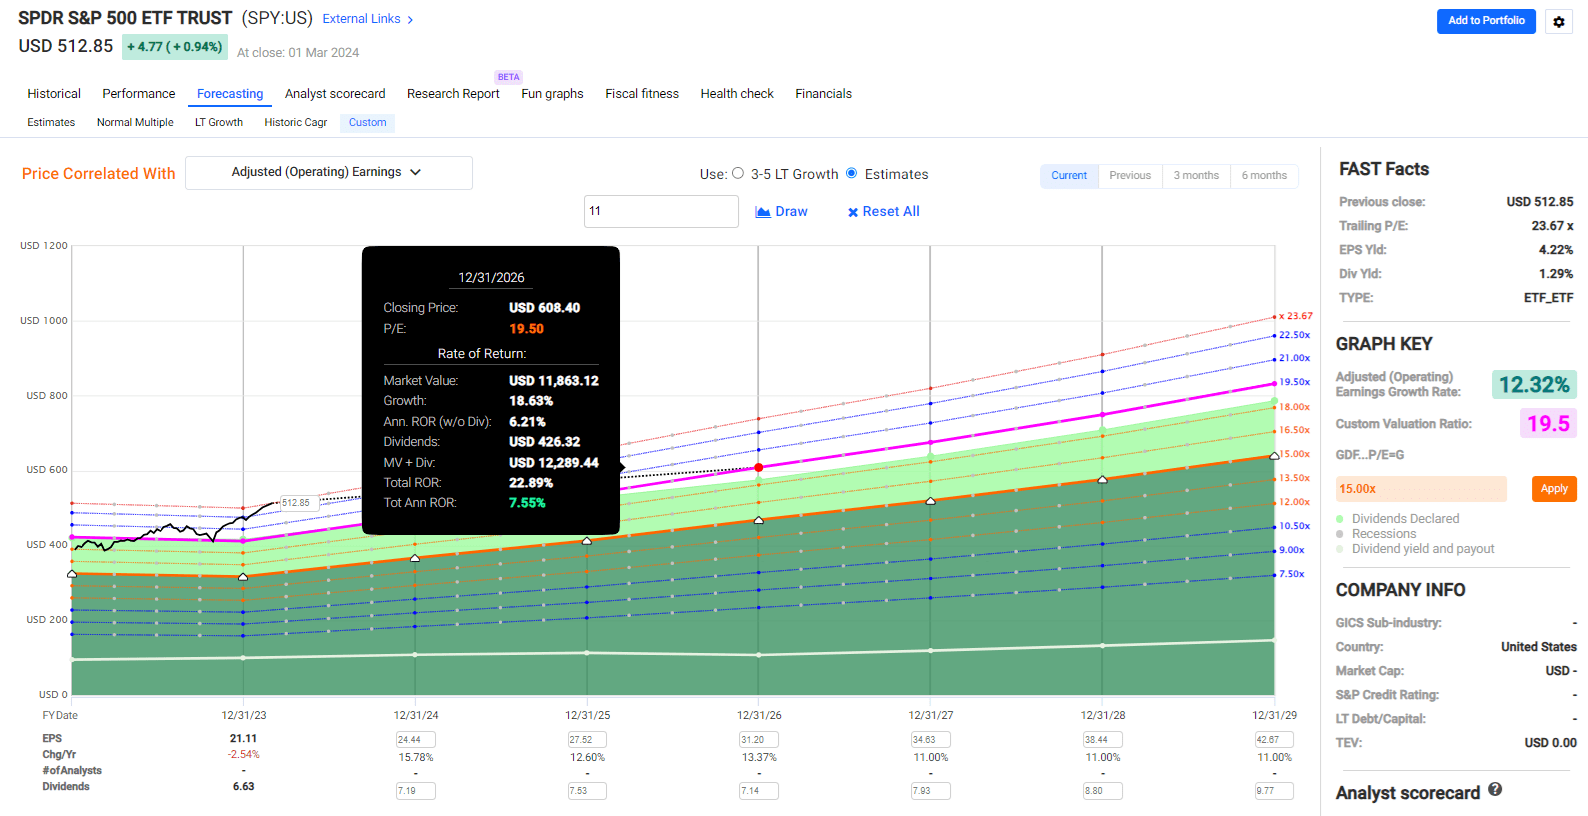
And now compare that to the S&P 500.
FAST Graphs, FactSet
Analysts expect the S&P to deliver about 22% returns in the next three years, or 7% annually.
Twice the return potential of the S&P over the next three years, all part of a complete, diversified, and risk-managed portfolio.
First, it's important to remember that all portfolios will sometimes experience volatility, even those designed to minimize the downside.
Portfolio Visualizer Premium
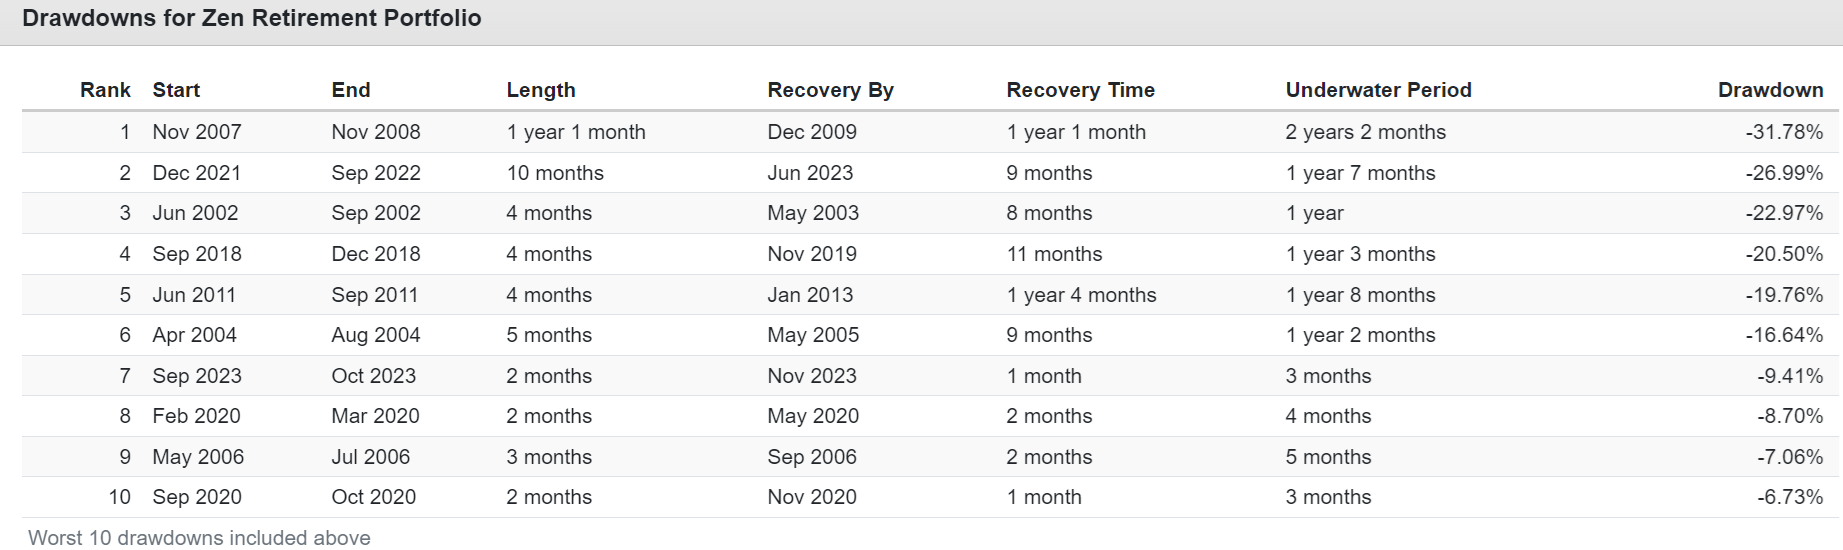
Historically speaking, this is a low volatility portfolio, but it has experienced four bear markets since 2002, and in 2011's debt ceiling crisis, it fell almost 20%.
And these are just the summary of declines. The true declines are much more dramatic when living through them.
Portfolio Visualizer Premium
This portfolio has fallen as much as 13% in a month, and the future monthly decline potential is 10% (conditional value at risk 5%).
In other words, at some point in the future, you should expect this portfolio to fall 10% in a single month.
If you can't emotionally handle this? Then it would be best if you had a more conservative portfolio.
And remember the importance of annual rebalancing.
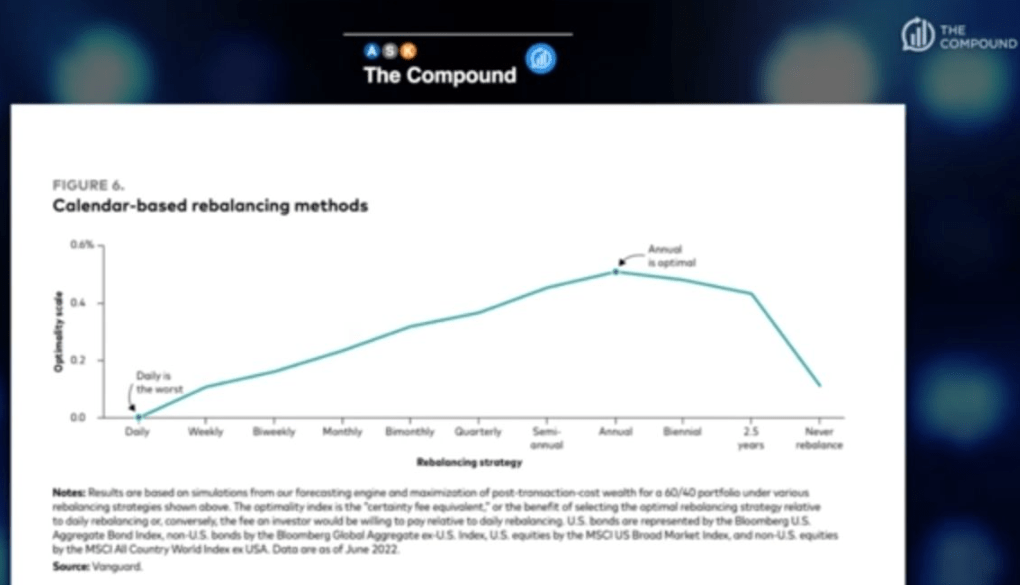
Ritholtz Wealth Management
Vanguard's data confirms what Morningstar also found: Annual rebalancing provides the best volatility-adjusted returns plus is more tax efficient.
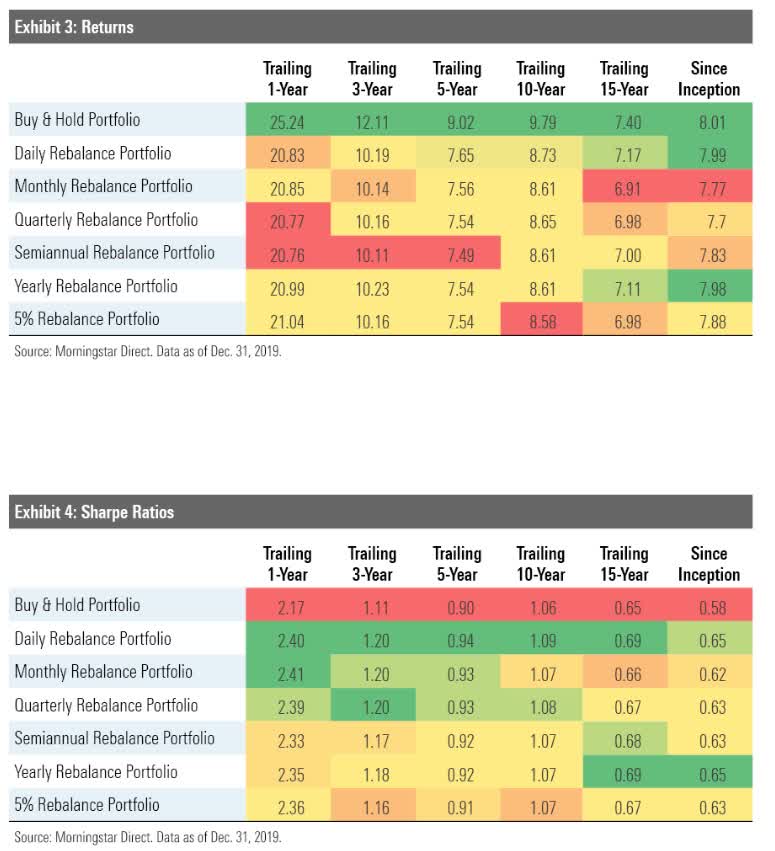
Morningstar
Rebalancing is very important because this is how hyper-growth stocks can help boost income over time.
The strong returns they generate allow you to buy more high-yield blue chips with profits that eventually become much higher than any savings you could invest yourself.
If your time horizon is under 10 years, then you don't necessarily need to worry about income growth and can adjust your stock bucket to be 100% high yield.
Also remember that all of this data I'm presenting, from the safety and quality scores to the valuations and growth forecasts, are constantly changing.
This is why optimal portfolio risk management isn't just buying one stock, the highest yielding or fastest growing, for example.
Today, BTI has excellent fundamentals and a very low-risk dividend. However, in a few years, that might change.
History is littered with former dividend aristocrats such as GE, AT&T, WBA, CTL, and bankrupt Winn-Dixie and Kmart.
Annual rebalancing allows you to confirm that the thesis of a company and its fundamentals remain intact.
My family fund is 67% ETFs and 33% high-conviction stocks.
The optimal asset allocation will depend on everyone's individual needs.
Our Zen portfolio series uses 50% core ETFs and 50% stocks to enhance the fundamentals beyond what the ETFs can deliver.
Our Zen Retirement portfolio has the diversification benefits of a 60-40, including all 500 S&P companies, while nearly doubling the dividend yield and growth potential through 10 high-yield and hyper-growth blue chips.
The key to long-term success with investing is finding a reasonable and prudent strategy that will likely meet your needs.
A strategy you understand, have confidence in and can avoid panic selling out of at the worst possible time.
Ultimately don't focus on trying to achieve some perfect strategy, there's no such thing.
Try to create the optimal strategy for your needs to harness the power of wealth and income compounding from the world's best companies.
Companies run by skilled and trustworthy management, and millions of employees working hard for you, so that one day you won't have to.