
Wipada Wipawin
Wipada Wipawin
Through January 2024, the Invesco KBW Property & Casualty Insurance ETF (NASDAQ:KBWP) has delivered a 237% total return over the last ten years, outperforming peers like the iShares Insurance ETF (IAK) and the SPDR S&P Insurance ETF (KIE) by 41% and 47%, respectively. While impressive, KBWP stands out because it's the only insurance ETF not to decline by double-digits in any year since its inception in December 2020. It's also one of 50 U.S. Equity ETFs with that track record, and its 414% total return through January 2024 was the seventh-best in that exclusive group. In short, the historical evidence strongly suggests KBWP is a safe investment with excellent upside potential, and that is why I've chosen to rate KBWP a "buy" today.
KBWP tracks the KBW Nasdaq Property & Casualty Index, selecting U.S. property and casualty insurance stocks and weighting them on a modified market-cap basis. The Index rebalances and reconstitutes quarterly and is maintained by Keefe, Bruyette & Woods, Inc., an investment banking firm founded in 1962 that also manages other ETFs, including:
According to the Index methodology, KBW Nasdaq Indexes are maintained by a 5-member committee that meets, at minimum, quarterly and decides which companies are eligible based on quantitative and qualitative measures. The committee can alter the methodology at any time, but selections generally meet the following criteria:
Eligible securities have a maximum weighting of 8% at each quarterly rebalancing, and those outside the top five by weight are capped at 4%. The reference dates for the rebalancing are the last trading days in February, May, August, and November, with changes effective after trading on the third Friday in March, June, September, and December.
KBWP comprises 24 stocks, though no specific number is listed in the methodology document. The Index excludes several stocks classified in the Property & Casualty Insurance sub-industry, according to GICS, demonstrating the Index Committee's discretion. Five of the largest are:
Furthermore, KBWP's GICS sub-industry breakdown also reveals about 30% allocated to Multi-Line Insurance and Reinsurance stocks, as follows:
Similarly, IAK tracks a diversified group of insurance stocks based on a proprietary classification system, while KIE holds securities from the five GICS insurance-related sub-industries (Insurance Brokers, Life & Health Insurance, Multi-Line Insurance, Property & Casualty Insurance, Reinsurance). In a prior article, I stated my preference for IAK, but this is my first close look at KBWP.
KBWP launched in December 2020, and in the 13 years between 2011-2023, it's one of only 50 U.S. Equity ETFs never to post a double-digit annual decline. This track record puts KBWP in rare company alongside other ETFs like:
These are defensive funds, and it's encouraging to see an insurance-focused ETF behave precisely how we want, which is to avoid catastrophic losses. To be sure, IAK and KIE have strong track records, too, but even they lost about 12% in their worst years. Consider the performance summary below, which is accurate as of January 31, 2024.
The Sunday Investor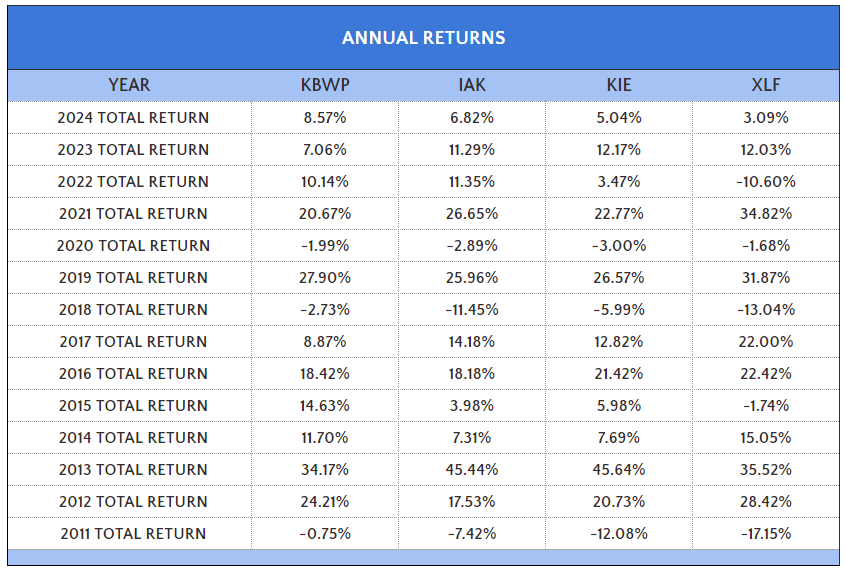
KBWP's annual returns ranged between -2.73% to 34.17% and averaged 13.25% between 2011-2023, better than what IAK and KIE delivered. The Financials Select Sector SPDR ETF (XLF) also declined by double-digits three times (2011, 2018, 2022), severely impacting its long-term returns despite posting 35% gains twice in 2013 and 2021. Instead, KBWP has won by not losing, and it's an excellent choice for defensive investors. Over the last ten years, it's up 237% compared to 195%, 190%, and 175% for IAK, KIE, and XLF, respectively.
The Sunday Investor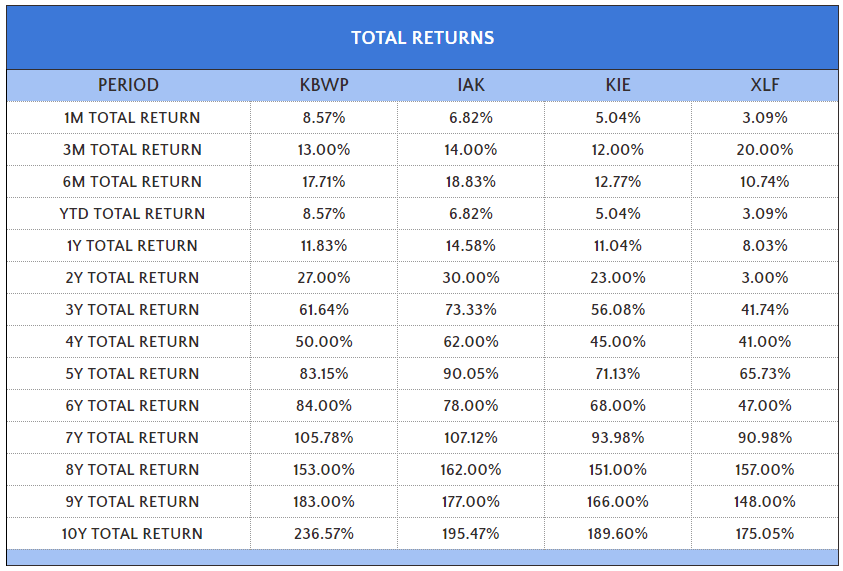
That said, the table above reveals how KBWP's recent performance relative to these ETFs is mixed. For example, it has only a 6% edge over IAK on nine-year returns and has trailed IAK by 7% over the last five years. While it's better than XLF over nearly every other period measured, less conservative investors might still prefer IAK. I believe both are good, but let's explore that topic further by comparing KBWP's fundamentals with the three peers above.
The loss ratio is one of the most important statistics for insurance companies, measuring the ratio of losses (e.g., insurance claims) to premiums earned. When added to the expense ratio, which measures the costs associated with acquiring, underwriting, and servicing insurance premiums, analysts can use this "combined ratio" to assess profitability.
According to research provided by Swiss Re Institute, U.S. P&C insurance companies should continue to see improvements in their combined ratios for 2024 and 2025, estimated at 98.5% compared to 102.7% for 2022.
Swiss Re Institute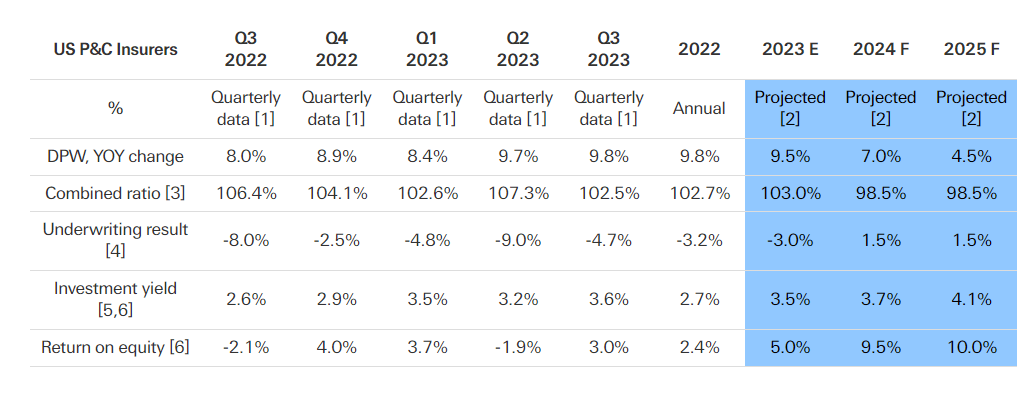
The table also highlights DPW, or direct premiums written, growth slowing to 7.0% and 4.5% from 9.8% in 2022, but claims costs are also expected to decelerate with disinflation. Specifically, the researchers expect commercial property claims to decelerate as construction prices ease to 1.5% in 2024 and 3.0% in 2025 compared to 17.5% and 7.0% in 2022 and 2023.
Meanwhile, researchers at Fitch Ratings recently provided a still positive but more cautious outlook, writing:
The sector outlook for US P/C Insurance for 2024 is neutral for both commercial and personal lines. We expect results to be stable to improving, with a gradually emerging recovery in personal auto, continued stability in commercial lines underwriting and investment income growth."
Specifically, the researchers highlighted auto writers' "slow recognition" of the higher parts and labor costs for vehicles, and the inherent challenges present in predicting large catastrophic losses. According to Aon (AON), insured property losses reached $79.6 billion in inflation-adjusted dollars last year but were as low as $29.9 billion 8 years prior.
The U.S. insurance sector is not immune to risk, with IAK and KIE's 51% and 47% declines in 2008 providing further evidence. However, the outlook is at least somewhat positive, so let's look at KBWP's fundamentals next for clues on critical factors like volatility, growth, valuation, and quality.
The following table highlights selected fundamental metrics for KBWP's 24 companies. Progressive (PGR) and Chubb (CB) account for only 16% due to KBWP's tiered weighting scheme. In contrast, they total 27% in IAK, the plain-vanilla market-cap-weighted alternative.
The Sunday Investor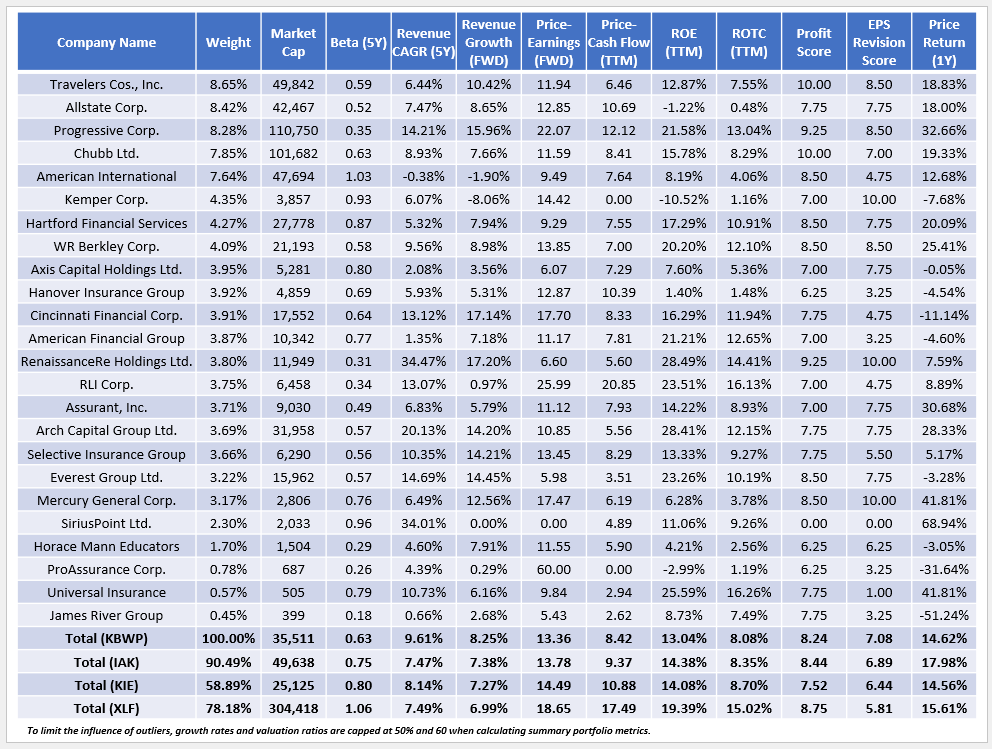
1. All three insurance ETFs hold stocks of all sizes, but their weighted average market caps are reasonably close between $25 and $50 billion. This contrasts with XLF, where Diversified Banks are the largest sub-industry at 20.43%.
2. KBWP's standout metric is its 0.63 five-year beta, indicating it's a less-volatile option compared to IAK and KIE and far less than XLF, where banks like JPMorgan Chase (JPM) and Bank of America (BAC) tend to be more volatile than the market. Furthermore, its 15.25% annualized standard deviation is the lowest of the four since its inception, leading to substantially better risk-adjusted returns (Sharpe and Sortino Ratios).
Portfolio Visualizer
3. KBWP trades at 13.36x forward earnings and 8.42x trailing cash flow, or about 1-2 points lower than IAK and KIE. Sales and earnings per share growth is estimated at 9.61% and 8.25%, respectively, and there are only a few stocks with negative growth rates. These results indicate support for the insurance sector, so there isn't much company-specific risk with KBWP.
4. KBWP might be slightly advantageous over IAK due to its 9.31% exposure to reinsurance stocks like RenaissanceRe Holdings (RNR). RNR has a "Strong Buy" rating and 4.70/5 Quant Score and helps mitigate risk by acting as an insurer for insurance companies. As researchers at Fitch Ratings wrote in November 2023:
Insured natural catastrophe claims are likely to exceed USD100 billion again in 2023 but global reinsurers have been far less affected than in 2022. Negotiated attachment points for reinsurance cover are higher, and aggregate covers less available, meaning that reinsurers bear a lower share of medium-sized natural catastrophe claims, and cedents a higher share. We do not expect this to change much in 2024 as reinsurers' appetite for lower layers of property catastrophe risk remains limited.
IAK has no exposure to this sub-industry, so it's one way that KBWP better diversifies risk despite holding only 24 stocks. KIE has 7.18% exposure, but due to its equal-weighting scheme, its quality suffers. We see that with its 7.52/10 profit score, which I derived from individual Seeking Alpha Factor Grades. Meanwhile, KBWP and IAK are much more solid at 8.24/10 and 8.44/10, respectively.
5. All three insurance ETFs have strong EPS Revision Scores, indicating Wall Street has generally increased earnings expectations for insurance stocks. For added context, consider the scores for other industry-specific ETFs within the Financials sector:
These scores further indicate that, while the outlook for the Financials sector isn't necessarily great, insurance stocks are the exception. You will find little exposure in popular sector ETFs like XLF, so while the expense ratios of insurance funds are relatively high, it's the only way to boost your exposure without buying individual stocks.
KBWP's lengthy track record of protecting during downturns is impressive, and its Index Committee does a good job selecting stocks that represent the P&C industry well while minimizing risk. It's one of only 50 U.S. Equity ETFs to not have a double-digit-decline in any year between 2011 and 2023, and unlike similarly-defensive ETFs in the Consumer Staples and Utilities sector, KBWP also offers nice upside potential. When evaluating KBWP against alternatives like IAK and KIE, I found no red flags on growth, valuation, or quality. Instead, I found Wall Street analysts and industry experts were generally optimistic, and it seems like an excellent way to control risk in the often volatile Financial sector. Therefore, I've decided to rate KBWP a "buy," and I look forward to continuing the discussion in the comments section below.