
Hispanolistic/E+ via Getty Images
Hispanolistic/E+ via Getty Images
The financial sector is the grease of the modern economy as well as a growth multiplier. Banks safeguard wages, and business cashflow and then lend this surplus to consumers and companies that buy more products or services and so on. Payment companies have dramatically reduced the need for cash and facilitated cross-border transactions. Brokerages, Investment banks, and asset managers further distribute and multiply cash flow and finally, financial institutions increasingly rely on specialized services such as data providers, credit, software, custodians, etc. It is a large ecosystem that should grow consistently, barring major catastrophes, of which there have been several. To this end, I examined the Financial Select Sector SPDR Fund ETF (NYSEARCA:XLF) the largest in the peer groups with US$36bn in AUM.
The XLF dates back to mid-2000 and to my surprise, it has underperformed peers such as the iShares U.S. Financials ETF (IYF), iShares U.S. Financial Services ETF (IYG), and the market benchmark the S&P 500 (SPX). While I do not have the portfolio makeup from then to now all three currently have most of the top names. Performance in the last 10 years has been similar with a reasonable gap vs the IYF, IYG, and the Vanguard Financials Index Fund ETF Shares (VFH).
XLF Performance vs Peers (Created by author with data from Capital IQ)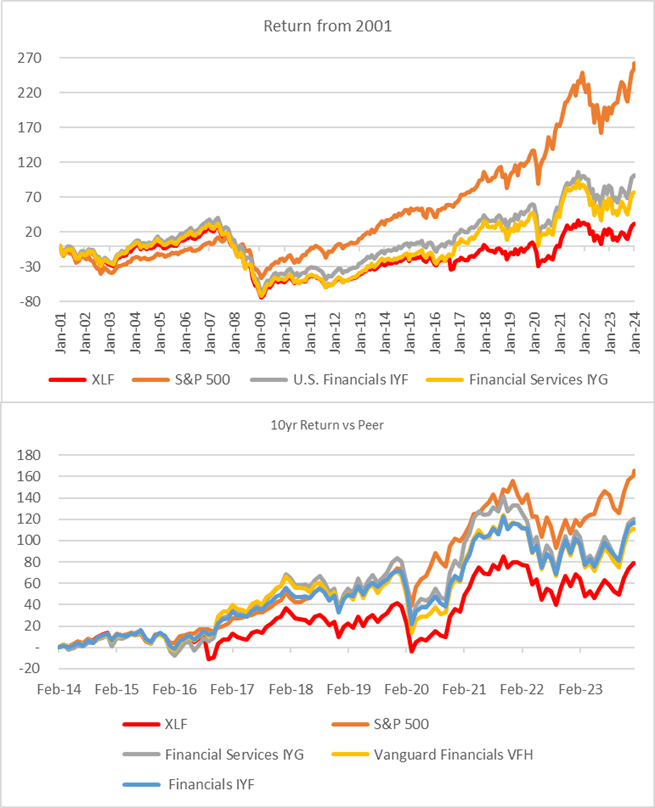
A bit perplexed I looked at some of the ETF components to see how they had faired in these 23 years. It seems that the larger banks and American International Group (AIG) suffered far worse in the GFC and have yet to recover. Goldman Sachs (GS), American Express (AXP) and Chubb (CB) beat the SPX. I also ran the same performance for payment and data providers that also beat the SPX. It seems most pure-play banks have not been great long-term investments. This was also borne out in a recent analysis of regional banks.
XLF vs Components (Created by author with data from Capital IQ)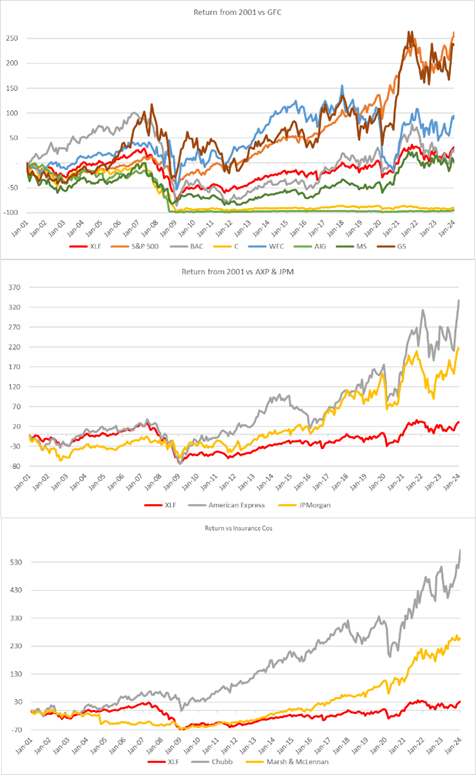
The XLF is a relatively concentrated portfolio with 70 holdings, of which the top 10 are 50% of AUM dominated by Berkshire Hathaway (BRK.B), JPM, Visa (V) and Mastercard (MA). I used consensus price target for 90% of AUM or 40 stocks and calculated a weighted upside potential of 7% plus a 2% dividend yield for a total return of 9%. This asset class seems to be rather homogeneous in terms of analyst valuation with the average upside at 8%. Only PayPal (PYPL) broke the 20% upside mark.
Berkshire is in a class by itself. Its insurance business provides cash flow that Mr. Buffett has then used to acquire large and profitable stakes in Apple (AAPL) for example. It's a cross between, private equity, insurance companies, and Apple. Only 3 brokers covered it on my database, which means its earnings are not as important as the sum of the parts.
XLF Consensus Price Target (Created by author with data from Capital IQ)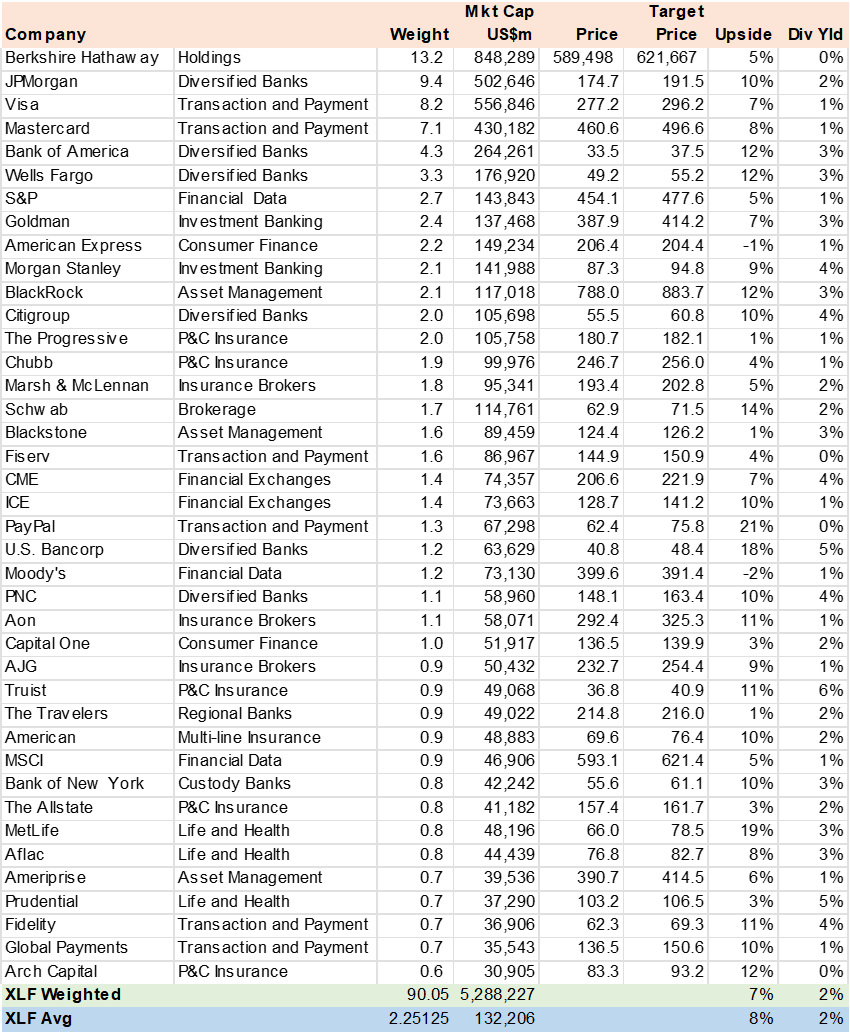
The portfolio has a steady and unexiting revenue growth forecast of 6% with net margins expected to inch up to 25% by YE25. The payment stocks have double the portfolio and on both measures. Since this ETF has broad-based financial exposure, it appears it should grow faster than a pure bank ETF which faces regulatory, funding, and credit risk headwinds.
XLF Consensus Revenue & Margins (Created by author with data from Capital IQ)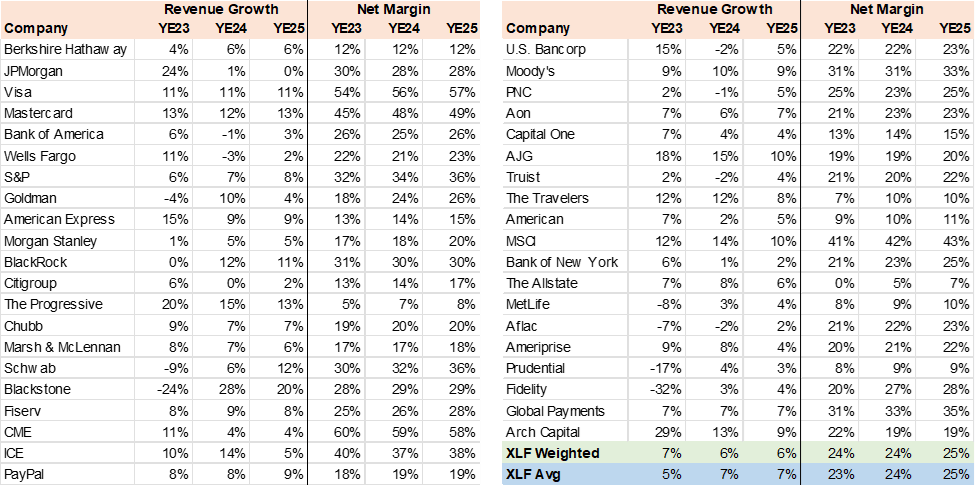
The consensus has a 10% EPS growth forecast for the YE24-25 period, higher than revenue growth, and most likely impacted by margin gains and share buybacks. Banks are again in a weak spot with declining EPS in 2024. The outlier is Progressive Corporation (PGR) with over 30% EPS growth. Overall, this seems to be an unchallenging earnings growth forecast.
XLF Consensus EPS Growth (Created by author with data from Capital IQ)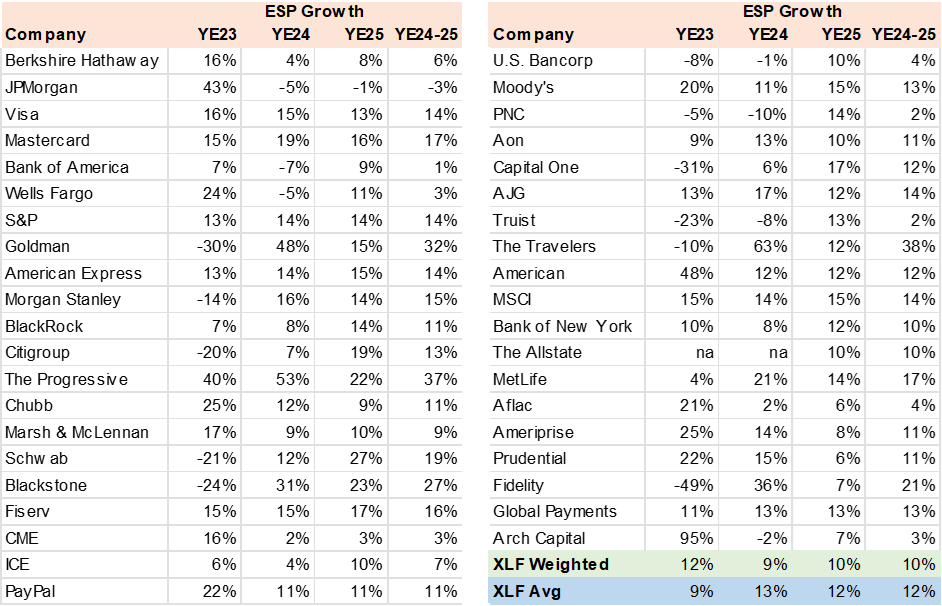
Banks and financial companies are normally valued on two-three metrics, PE to Growth (PEG), ROE (return on equity), and P/BV. The first is easy to apply and the XLF seems to be neither cheap nor expensive with PE of 17x vs EPS growth of 10% for 1.7x PEG. This should be taken into consideration with an ROE metric, generally higher than the cost of equity (KE) is deemed positive. As can be seen, this portfolio has a 40% ROE which is considerably higher than a 10% KE (risk-free + risk premium * beta) which explains a 6.5x P/BV. These high numbers are influenced by the payment cos and data providers that do not need much capital to generate very high returns.
XLF Consensus Valuation (Created by author with data from Capital IQ)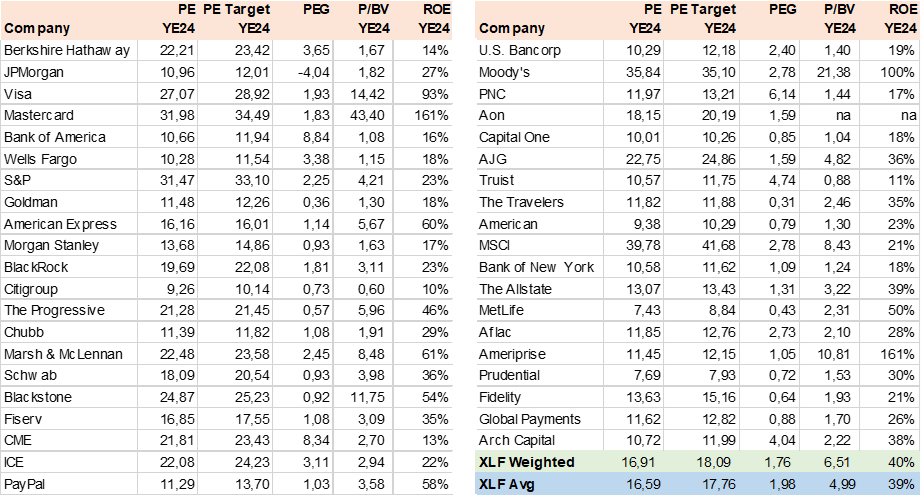
I rate the XLF a hold. While the upside and growth potential are mundane the shift away from banks to payment, services, and insurance is positive. While the low expectations for the bank sector provide upside risk, in my view. Investors seeking interest rate risk may not find it in this portfolio.