
blackdovfx
blackdovfx
Cambria Foreign Shareholder Yield ETF (BATS:FYLD) is an actively managed exchange-traded fund, or ETF, launched on 12/3/2013. It is invested in 100 ex-U.S. companies, has 112 holdings including cash and equivalents in various currencies, a trailing 12-month distribution yield of 5.95%, and a total expense ratio of 0.59%. Dividends are paid quarterly.
As described in the prospectus by Cambria, the fund invests in developed foreign markets excluding the U.S. It focuses on companies that provide high “shareholder yield,” defined as the returns realized by an investor from a company’s cash payments for dividends, buybacks, and debt paydowns. The fund’s portfolio is managed by Meb Faber, well-known author of white papers and books. Among them, Shareholder Yield, A Better Approach to Dividend Investing, details fundamental and historical data on the shareholder yield concept.
The fund follows a systematic, quantitative model, as described below.
Utilizing its own quantitative model, Cambria selects the top 20% of stocks in the initial universe of developed ex-US, publicly listed companies based on their shareholder yield, as measured by dividend payments and net share buybacks. Cambria’s quantitative algorithm then factors in the remaining stocks’ debt paydowns and applies a number of value metrics to create a composite, including metrics such as, but not limited to, price-to-book (P/B) ratio, price-to-sales (P/S) ratio, price-to-earnings (P/E) ratio, price-to-free cash-flow (P/FCF or P/CF) ratio, and enterprise multiple (EV/EBITDA). Cambria then selects the top 100 stocks for inclusion in the Fund’s portfolio that exhibit, in the aggregate, the best combination of shareholder yield characteristics and value metrics.
Therefore, Cambria Foreign Shareholder Yield ETF also belongs to the value fund category. It tends to an equal-weight methodology, but weights may vary with market conditions and opportunities. Country weights are capped at 30% of asset value. The portfolio turnover rate was 34% in the most recent fiscal year.
I ran a simulation on Portfolio123 to evaluate a ranking system based on shareholder yield, defined by the following formula:
(Dividend paid TTM + Equity Purchased TTM - Equity Issued TTM + Total Debt - Total Debt 12 months ago)/Market Capitalization
The simulation is run in a U.S. large cap universe, the S&P 500 index (SP500), by ranking stocks in 10 buckets from lower to higher shareholder yields. The next chart plots the annualized return of the 10 buckets, starting in January 1999 with an annual rebalancing in equal weight. The red bar on the left represents the performance of the equal-weight S&P 500 index.
Shareholder yield ranking system performance since 1999 (Portfolio123)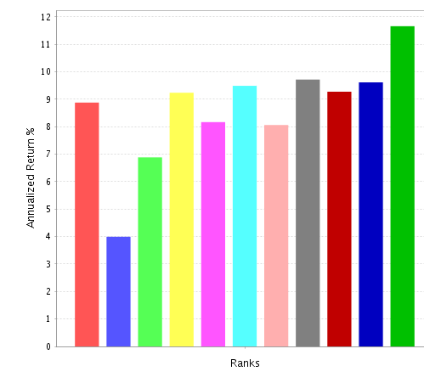
This simulation shows an excess annualized return over 2.5% for the top decile (on the right) relative to the benchmark (on the left). The simulation universe is not international, but it is a serious clue in favor of the shareholder yield factor.
FYLD currently has about 35% of asset value in large caps, 42% in mid-caps and 23% in small caps. I will use iShares MSCI EAFE ETF (EFA) as a benchmark.
The fund is much cheaper than EFA regarding valuation ratios, as reported in the next table.
FYLD | EFA | |
Price/Earnings | 7.56 | 12.68 |
Price/Book | 0.93 | 1.6 |
Price/Sales | 0.61 | 1.22 |
Price/Cash Flow | 3.89 | 9.01 |
The heaviest countries in the portfolio are Japan (21.7%), Canada (18.1%) and the U.K. (11.3%). Other countries are below 8%. The aggregate weight of China and Hong Kong is 7.2%, so direct exposure to geopolitical and regulatory risks related to China is moderate.
FYLD geographical allocation (chart: author; data: Fidelity, iShares)
Energy is the heaviest sector with 23.1% of assets. Then, come financials, materials, and industrials, between 16% and 19%. Other sectors weigh no more than 7% individually and 19% in aggregate. FYLD ignores healthcare and real estate. Compared to the benchmark, it massively overweights energy and materials.
FYLD sector breakdown (chart: author; data: Fidelity, iShares)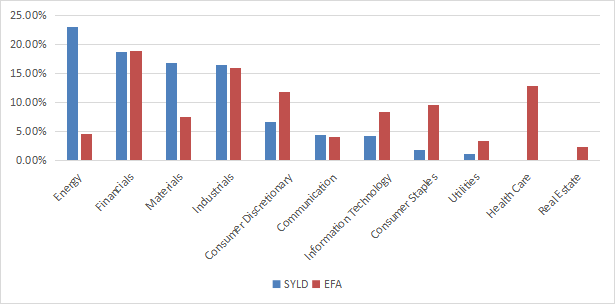
The top 10 issuers, representing 15.8% of asset value, are listed below. The largest one weighs 2.68%, so risks related to individual companies are low.
Name | Ticker | Weight |
SSAB AB | SSABA SS, SSABB SS | 2.68% |
IMPERIAL OIL LTD COM NEW | IMO CN | 1.85% |
Fortescue Ltd | FMG AU | 1.54% |
RIO TINTO | RIO LN | 1.50% |
BP | BP LN | 1.42% |
SCOR SE | SCR FP | 1.42% |
HOEGH AUTOLINERS | HAUTO NO | 1.39% |
MEG ENERGY CORP COM | MEG CN | 1.36% |
CITIZEN WATCH CO | 7762 JP | 1.35% |
TOTAL SE | TTE FP | 1.31% |
Since 1/1/2014, The Cambria fund is shortly ahead of EFA. The difference in annualized return is insignificant (17 bps), but it shows a significantly higher risk in drawdown and volatility.
Total Return | Annual.Return | Drawdown | Sharpe ratio | Volatility | |
FYLD | 47.68% | 4.01% | -44.55% | 0.24 | 17.18% |
EFA | 45.21% | 3.84% | -34.19% | 0.22 | 15.09% |
The annual sum of distributions has increased from $1.15 per share in 2014 to $1.49 in 2022, a growth of 29.6% in 8 years. It has kept pace with inflation, about 26% in the same time period based on CPI. However, distributions have been quite irregular, as reported on the chart below.
FYLD distribution history (Seeking Alpha)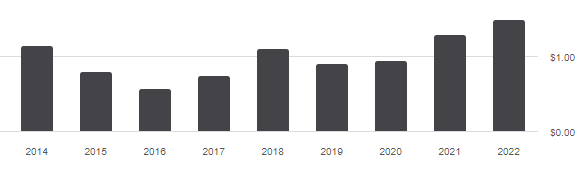
By its yield, quantitative model description and valuation ratios, FYLD is in both dividend and value styles. I will compare its 5-year performance to five value, dividend, and multi-factor global ETFs:
FYLD vs. competitors, 5-year returns (Seeking Alpha)
Cambria’s fund is the best performer, slightly ahead of PID. In 2023 to date, it is second to Alpha Architect’s fund:
FYLD vs. competitors, year-to-date (Seeking Alpha)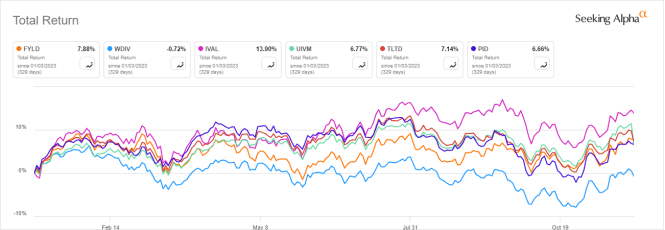
Cambria Foreign Shareholder Yield ETF is an actively managed ETF with a quantitative model combining shareholder yield and value. Its heaviest sectors are energy, financials, materials, and industrials. It is well-diversified across countries and holdings. Direct exposure to Chinese companies is about 7%. Valuation is attractive relative to an international benchmark. It has outperformed a number of competitors in the last 5 years, which, combined with value characteristics and a yield close to 6%, makes Cambria Foreign Shareholder Yield ETF quite attractive. However, keep in mind price may be volatile.