grandriver
grandriver
Occidental Petroleum Corporation (NYSE:OXY) has made significant headlines over the past years, beginning with its transformative $57B acquisition of Anadarko Petroleum in 2019. Beating out Chevron Corporation's (CVX) offer by more than $7B, this deal had in large parts been enabled by Warren Buffett committing ~$10B in financing to OXY through the issuance of new preferred equity. Continuously increasing his stake in the company, in the Summer of 2023, Buffett reportedly crossed the 25% barrier, however consistently denying any claims of seeking full ownership.
While I estimate that such a large and concentrated holding will continue to provide some downside protection for OXY shares (the "Buffett Put"), I view the company as lagging behind peers in several key metrics including Returns on Capital and potential for near-term shareholder distributions. Adding that to a ~10-20% valuation premium to peers and the stock trading slightly below my intrinsic fair value estimate, I see limited upside for OXY in an otherwise promising industry and initiate at relative Underweight at a $58 price target.
Founded in 1920 and based in Houston, TX, Occidental Petroleum is a globally operating oil & gas company with activities ranging from exploration & production ("E&P") to petrochemicals.
Oil & Gas is OXY's upstream division which explores and produces hydrocarbons in the US and internationally. As of FY23, the segment had an average daily production of ~1.2Mboed and total proved reserves of ~4Bboe, ranking as the second-largest US E&P company behind ConocoPhillips (COP). Other notable competitors include Diamondback Energy, Inc. (FANG), Marathon Oil Corporation (MRO), Devon Energy Corporation (DVN), and EOG Resources, Inc. (EOG).
Midstream is comprised of OXY's oil & gas transportation and storage activities. Key peers include MPLX LP (MPLX), Energy Transfer LP (ET), Kinder Morgan, Inc. (KMI), and Plains All American Pipeline, L.P. (PAA).
OxyChem is a leading US producer of basic chemicals and various plastics. Operating 21 domestic plants, it is the US' largest producer of PVC at 3.1MM tons/year and one of the largest producers of Chlorine and Caustic Soda at 3.2MM and 3.3MM tons/Year. Through tight integration of its chemicals and upstream businesses, OXY seeks to operate at more attractive price points than independent peers such as DuPont de Nemours, Inc. (DD), LyondellBasell Industries N.V. (LYB), Dow Inc. (DOW), and Westlake Corporation (WLK). Notably, the segment does not currently hold any refining capacity, making OXY highly dependable on large US and international refiners.
OXY Segment Split by Revenue (Company Filings)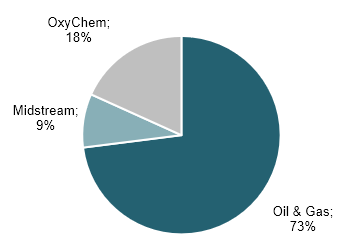
OXY owns ~18.3MM net acres across the world with a roughly equal split between domestic and international assets. It has significant positions in the Permian (~15% of the total) and the Middle East through its ownership shares in the UAE's Al Hosn field and the Dolphin Gas Project in Qatar.
Acreage as of Q4 23 (Company Filings)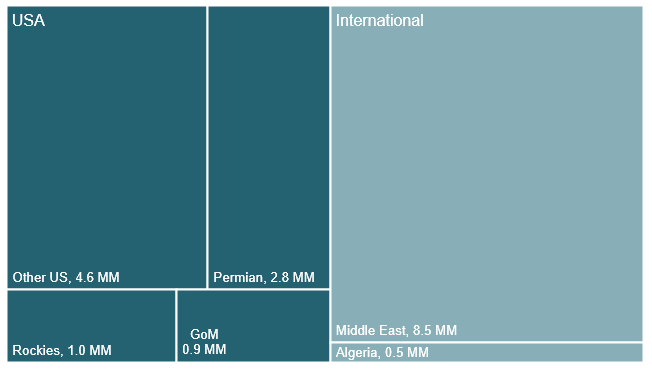
While making up just 15% of acreage, the Permian Basin has emerged to be OXY's most important production region, producing ~48% of total output with total domestic assets making up more than 80% of production.
Q4 23 Daily Production (Company Filings)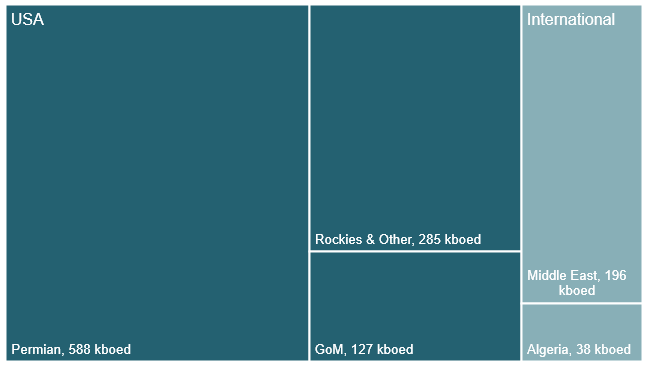
For FY23, OXY reported total production volumes of ~1.2Mboed, up by more than 6% vs. 2022 on the back of a 14% growth in Permian production offsetting flat international and US offshore volumes. Production split was roughly 52% Crude, 23% NGL, and 25% Natural Gas with OXY's Permian assets notably delivering almost 58% Crude. Also accounting for NGL, production in the Permian was more than 80% liquids for a total US liquid share of 78% while OXY's international assets are more gas-heavy at just 63% liquids.
While technically being an integrated player comparable to Exxon Mobil Corporation (XOM) and Chevron Corporation (CVX), given the lack of petroleum refining capacity and its comparison to a more domestic asset base, I will consider OXY as an E&P company, which I note is also in line with its historical connotation. Therefore, I will define OXY's peer universe as US public and oil-focused E&P companies (FANG, MRO, COP, DVN, EOG). However, for capital efficiency and valuation metrics, I will also look at OXY in comparison to North American integrated oil majors, which I define as XOM, CVX, and Canadian firms Imperial Oil Limited (IMO) and Cenovus Energy Inc. (CVE).
Benchmarking OXY against its main E&P peers, I find that margins are significantly lower than peers across the entire income statement. EBITDA margins are roughly 12 percentage points ("pp") below the peer average of 60% while EBIT and net margins are 15pp and 16pp short respectively.
US E&P Margins (Company Filings)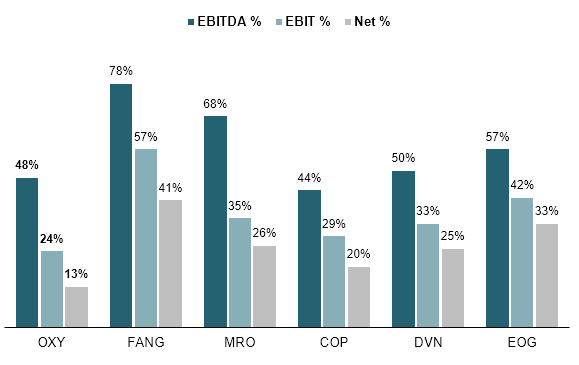
Considering only OXY's upstream ("Oil & Gas") division for a cleaner comparison, OXY still mostly trails peers especially on EBIT and Net margins at 10pp and 8pp respectively.
US E&P Margins (Only OXY Upstream) (Company Filings)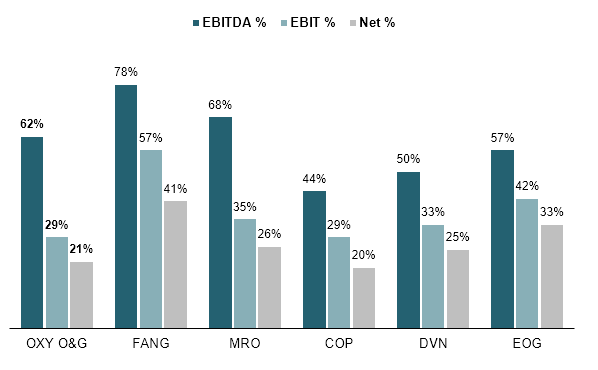
Cash margins also lag significantly behind with LTM CFO margins ~12pp behind peers. FCF margins hold up reasonably well at just 4pp below peer average, however, I estimate this is due to management holding the current Capex artificially low (more on that below).
US E&P Cash Margins (Company Filings)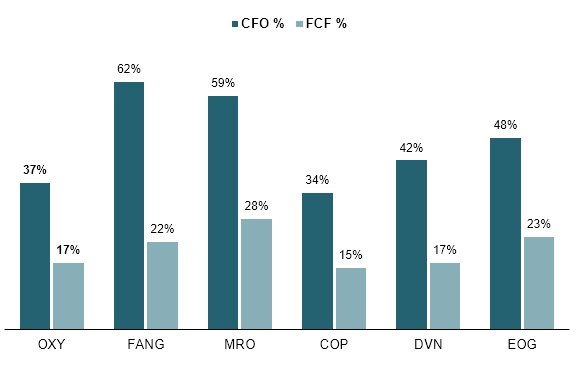
Taking into account both margins and asset base I find that OXY currently generates an LTM Return on Capital Employed (Calculated as Net Income over Total Assets less Liabilities ex Debt) of ~9%, putting it significantly behind both its E&P peers which average 15.9% and its integrated peers at 14.1%.
While OXY also has significantly weaker margins than its E&P peers, I estimate a large portion of this underperformance in ROCE is due to a bloated balance sheet arising from the Anadarko acquisition which more than doubled assets (FY18: $44B / FY19: $107B) while adding only minor increases to net income (Anadarko FY18 Net Income ~$0.8B). Comparing OXY to DVN, which has a roughly similar net income at ~$3.8B, OXY's operations employ almost 3x as much capital hinting at the company's significant inefficiencies.
NA Oils ROCE (Company Filings)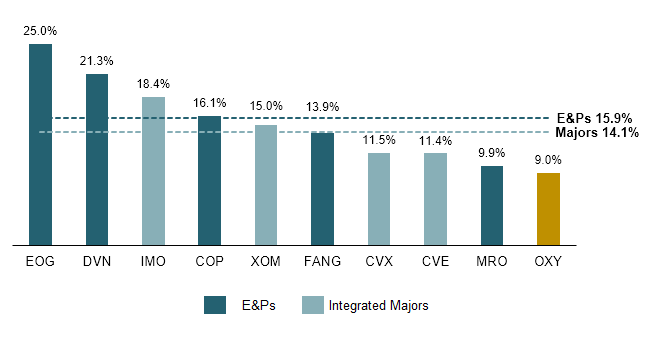
I estimate the key reason for OXY's peer-trailing margin profile is due to its less competitive cost structure. Measuring costs on a comparable per barrel basis, I find that OXY spends up to ~54% more in operating expenses and ~38% more in D&A.
US E&P Expenses/bbl (Company Filings)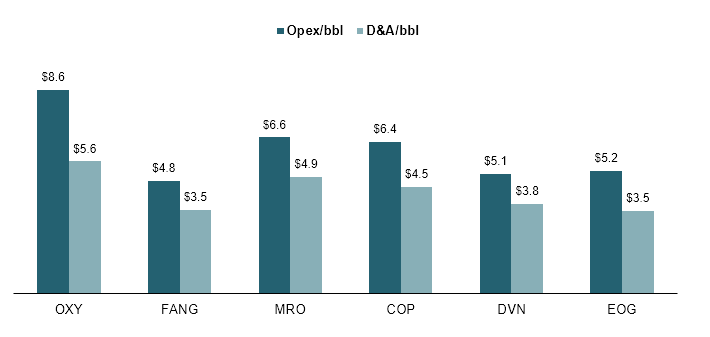
This results in significantly lower Operating Profit and Net Earnings per barrel, with OXY earning just 70% of what peers earn in EBIT and 50% in Net Income despite earning a 9% higher revenue/bbl at $23.4 vs. $21.5.
US E&P Earnings/bbl (Company Filings)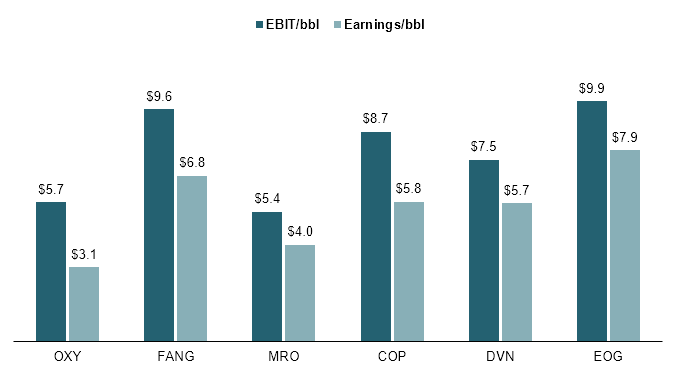
Given lower earnings, OXY also trails behind peers when comparing CFO/bbl, generating ~15% lower operating cash flows. Adjusting for Capex, OXY generated a total FCF of $3.9/bbl in FY23, just ~11% below peers. I estimate OXY scoring better on cash generation vs. book margins to be a result of 1) Higher D&A Expenses as evidenced by a 38% higher D&A/bbl and 2) Capital spending that is significantly below the group average. As of FY23, OXY spent just $4.7 in Capex/bbl or ~20% of sales, compared to group averages at $5.8/bbl and 28%.
US E&P Cash/bbl (Company Filings)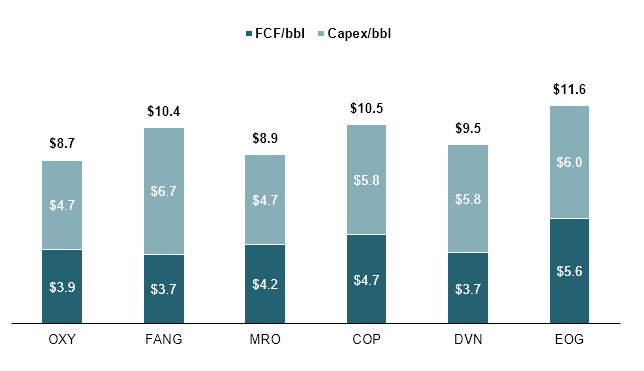
Looking at the Capital Replacement Ratio ("CRR"), which measures Capex against underlying D&A, OXY only has an 85% replacement ratio, implying for every $100 in D&A on its vast asset base it only reinvests $85. This is well below E&P peers who spend around $119 for every $100 depreciated and more in line with its integrated peers.
While I appreciate that capital discipline has increasingly become the name of the game in US shale following the overproduction and price crash of the mid-2010s, I do believe this spending restraint to potentially become an issue. Especially given OXY's already above average operating expenses, any missed investment in higher-profitability recovery techniques could come at a significant cost in the future.
NA Oils Capital Replacement Ratio (Company Filings)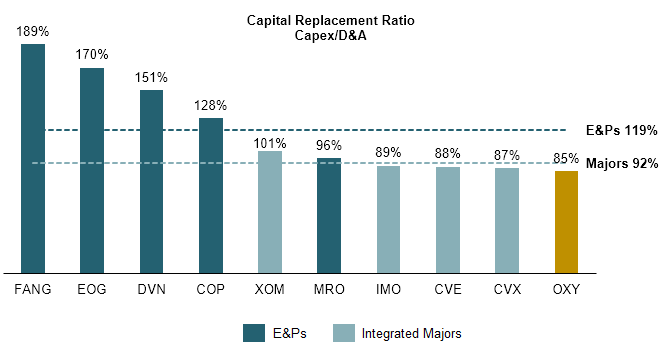
With a potential re-uptick in Capex in the coming years, OXY could also come under pressure in terms of FCF breakeven prices. As recently mentioned by CEO Vicki Hollub, OXY has a current breakeven price of ~$40/bbl, putting it above most peers with Permian pure plays FANG and EOG remaining cash-positive at ~$30 and COP utilizing cheap Alaskan production for a breakeven price of ~$35.
US E&P FCF Breakeven Pricing (Company Filings)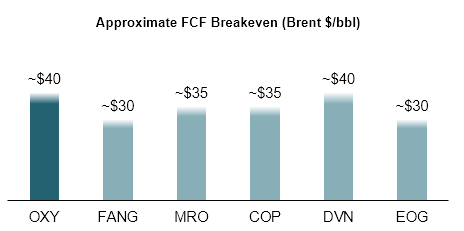
With lower margins due to a less competitive cost structure hindering OXY's returns on capital and breakeven pricing, I also see a significant risk in the company's balance sheet. Since the acquisition of Anadarko in 2019 and the COVID-19 pandemic in 2020, OXY's leverage has continuously exceeded that of peers, currently standing at 1.8x Net Debt/CFO compared to the peer average of 1.1x.
Net Debt / CFO (Company Filings)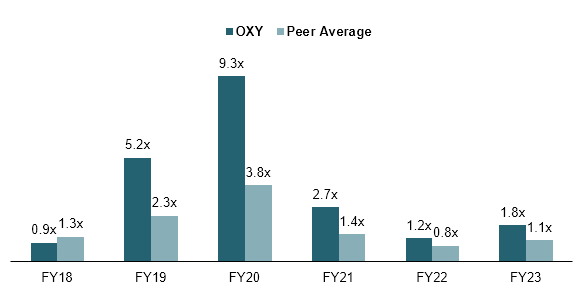
With a total debt position of $20.9B as of FY23, the company also spends ~13% of its total operating income on interest payments. While peer MRO spends more at 15%, this is significantly above the group average of 8%.
US E&P Interest Cover (Company Filings)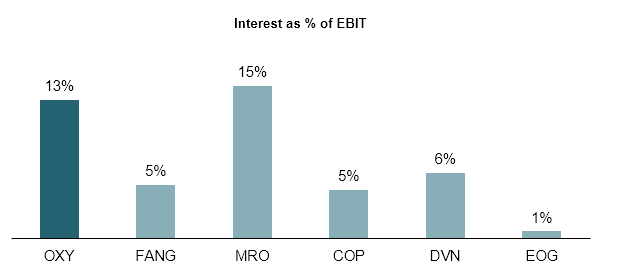
On December 11, 2023, shortly after the onset of the current Oil & Gas consolidation wave, OXY announced it would acquire private driller CrownRock for a total enterprise value of ~$12B (incl. $1.2B in CrownRock net debt). The acquisition will be majority debt financed with OXY raising $9.1B for a total of $10.3B of added debt flowing into OXY's balance sheet. Estimating CrownRock CFO at ~$2B, this would result in a pro forma net debt/CFO ratio of ~2.4x, up from 1.8x for OXY pre-transaction.
Crownrock Debt Implications (Company Filings)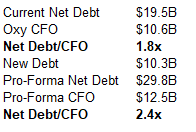
To offset the significant rise in leverage post-acquisition, management has updated its cash allocation framework to focus on debt reduction in the near term. Along with up to $5B in planned divestments, OXY will notably use all of its post-dividend FCF to commit to delevering, aiming at reducing its debt principal to $15B. Assuming full-scope divestments to yield $5B, this would imply OXY allocating around $10B of future FCF to debt paydown. At consensus FCF estimates of $4.8B and $6.2B and adjusting for projected total dividends, I estimate OXY to divert all FCF for FY24 and FY25 towards debt reduction.
OXY Updated Capital Allocation (Company Filings)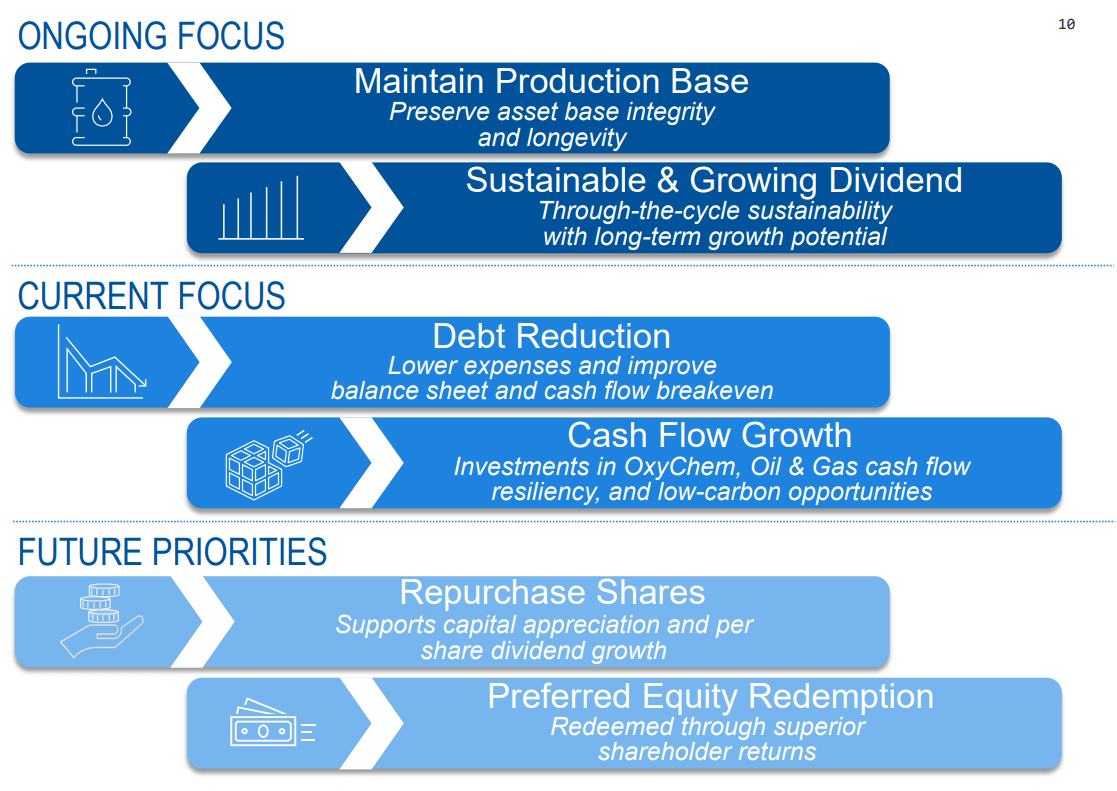
Notably, this change in cash allocation comes at a time when peers commit to paying out the majority of generated FCF with all major E&P peers allocating 50%+ to dividends and buybacks. Notably, FANG which has itself announced its intention to acquire Endeavor Resources, a driller comparable to CrownRock, is planning to finance its transaction through a mix of on-hand cash and new stock, enabling it to continue paying out ~50% of FCF (although down from 75%+).
With OXY estimated to allocate its entire FCF through FY25 towards delevering, this leaves shareholders with just its common dividend which, despite the fact that management has committed to growth, puts its near-term shareholder yields well below peers which are expected to pay out ~6.5% of their current market cap on average.
US E&P FY24e Shareholder Yields (Company Filings)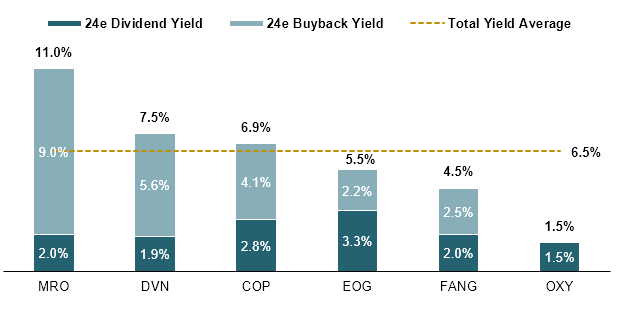
Given those implications, I see the CrownRock deal, while acknowledging its high-quality resources in the Permian, as non-ideal when compared to other deals we have seen in the preceding months. With OXY's current market cap at $52B, an all-stock transaction would have added ~20% in additional outstanding shares which, through utilizing consolidated cash flows could have been retired in a few years while keeping shareholder returns intact.
Based on consensus estimated forward FCF, OXY trades at a ~9.2% yield, well in line with US majors and most E&Ps, but significantly below Marathon and Canadian Oils. However, given the previously mentioned fact that OXY has a combination of higher D&A expenses while simultaneously spending less on Capex, I do not believe FCF to be an accurate metric to determine OXY's relative valuation. Additionally, I see significant downside risk to FCF given the above-mentioned recent underspending relative to (E&P) peers.
NA Oils FCF Yields (Company Filings)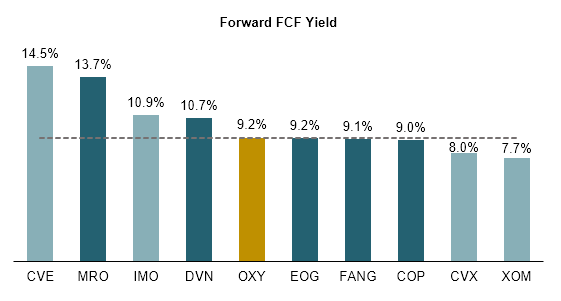
To better account for significant differences in Capex spending I prefer to look at EV/EBITDAX multiples, where X represents the additional exploration expenses incurred. OXY currently trades at 6.2x, significantly above its E&P peers and only below the US supermajors Chevron and Exxon. I do note that FANG's valuation has recently surged by ~20% following its announcement to acquire Endeavor Resources and thus a pre-announcement multiple would be more in line with other US E&Ps.
Overall, I see OXY as up to ~22% overvalued relative to its E&P peers and ~11% compared to aggregate North American oils which I do not see justified given significantly weaker capital efficiency and a higher levered balance sheet limiting near-term shareholder returns.
NA Oils EV/EBITDA (Company Filings)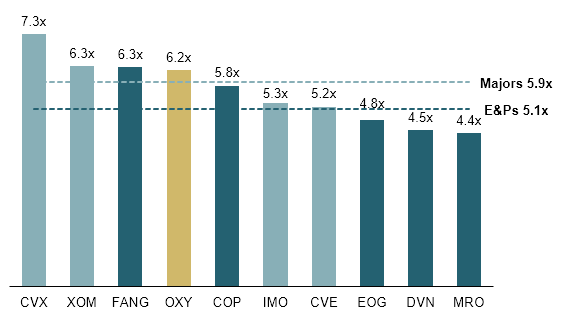
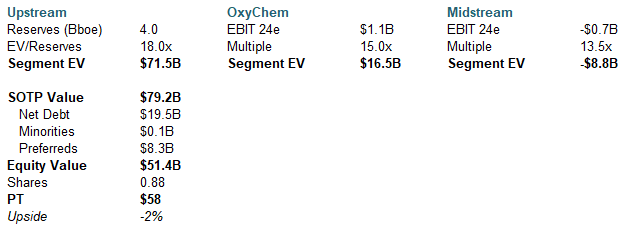
I value OXY on a Sum-of-the-Parts ("SOTP") basis, deriving separate valuations for each of its three businesses through peer-derived multiples. For its upstream business, I will use an EV multiple on its proved reserves while for OxyChem and Midstream, I will rely on peer-average multiples on OXY's FY24 guided EBIT figures.
For Oil & Gas, I will use a multiple of EV/Proved Reserves. Screening peers' EV/Proved Reserves against crude oil share of production indicates higher multiples for more oil-heavy portfolios as Natural Gas and NGLs generate significantly lower revenues (NGLs are typically priced at a 20-40% discount to crude and gas units get converted to boe at 1/6). Using OXY's oil share of ~52%, I estimate a fair multiple for its upstream business at $18/boe of proved reserves. Applying this to proved reserves of 3,982Mboed as of FY23, I calculate a segment EV of $71.5B.
Company Filings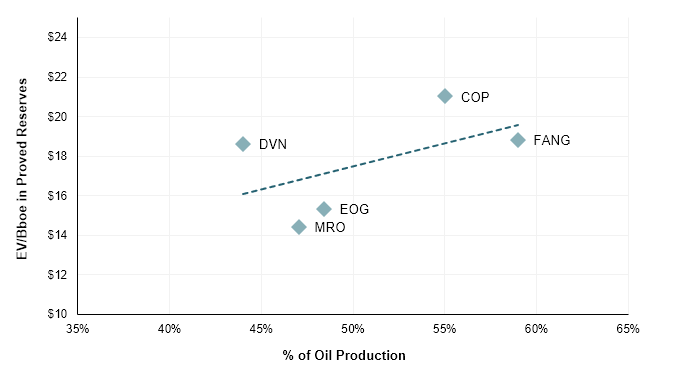
I value both OxyChem and Midstream on the basis of comparable peers' current trading with peer multiples applied to OXY's FY24 guided EBIT as presented during its Q4 23 earnings release.
Considering DD, LYB, DOW, and WLK as peers for OxyChem I calculate an average forward EV/EBIT of 13.7x. Given OxyChem's significantly higher margins (FY23: ~22%) due to its tight integration and advantaged feedstock pricing I apply a 15x multiple to the midpoint of FY24 guided EBIT range of ~$1-1.2B for a segment EV of $16.5B.
For the Midstream division, OXY expects a total FY24 EBIT of negative $750-550MM. Applying a blended peer multiple of 13.5x (peers are MPLX, ET, KMI, and PAA) I estimate a current segment EV of negative $8.8B.
Adding all three segments yields a total Enterprise Value of ~$79B, which deducted for net debt (pre-CrownRock), minorities, and preferred shares gets us to an Equity Value of $51.4B, or $58 per share.
OXY SOTP Valuation (Company Filings and Author's Estimates)