
champpixs
champpixs
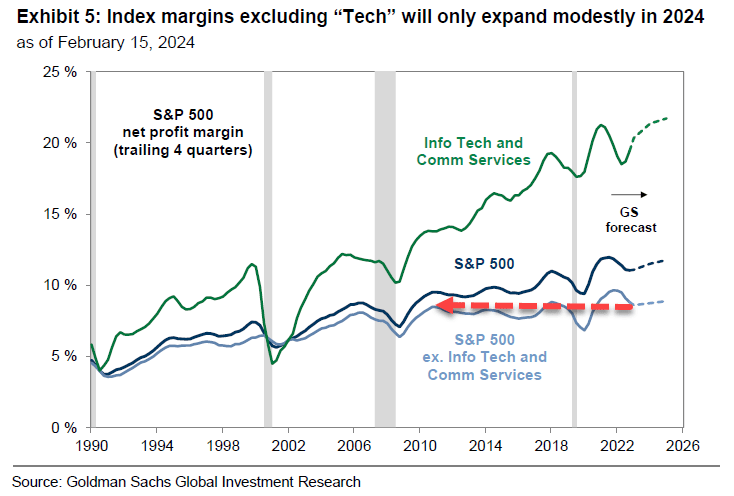
Is tech the only game in town? It has felt that way for much of the last 14 months, sans a brief bout of better breadth during the final quarter of 2023. Goldman Sachs put out a note last Friday upping its year-end S&P 500 price target. It wasn’t a whole-hearted endorsement of the US stock market, however. David Kostin and his team remarked that US large-cap margins are actually somewhat lackluster ex-tech. The implication is that the Information Technology and Communication Services sectors could continue to power the SPX higher in 2024.
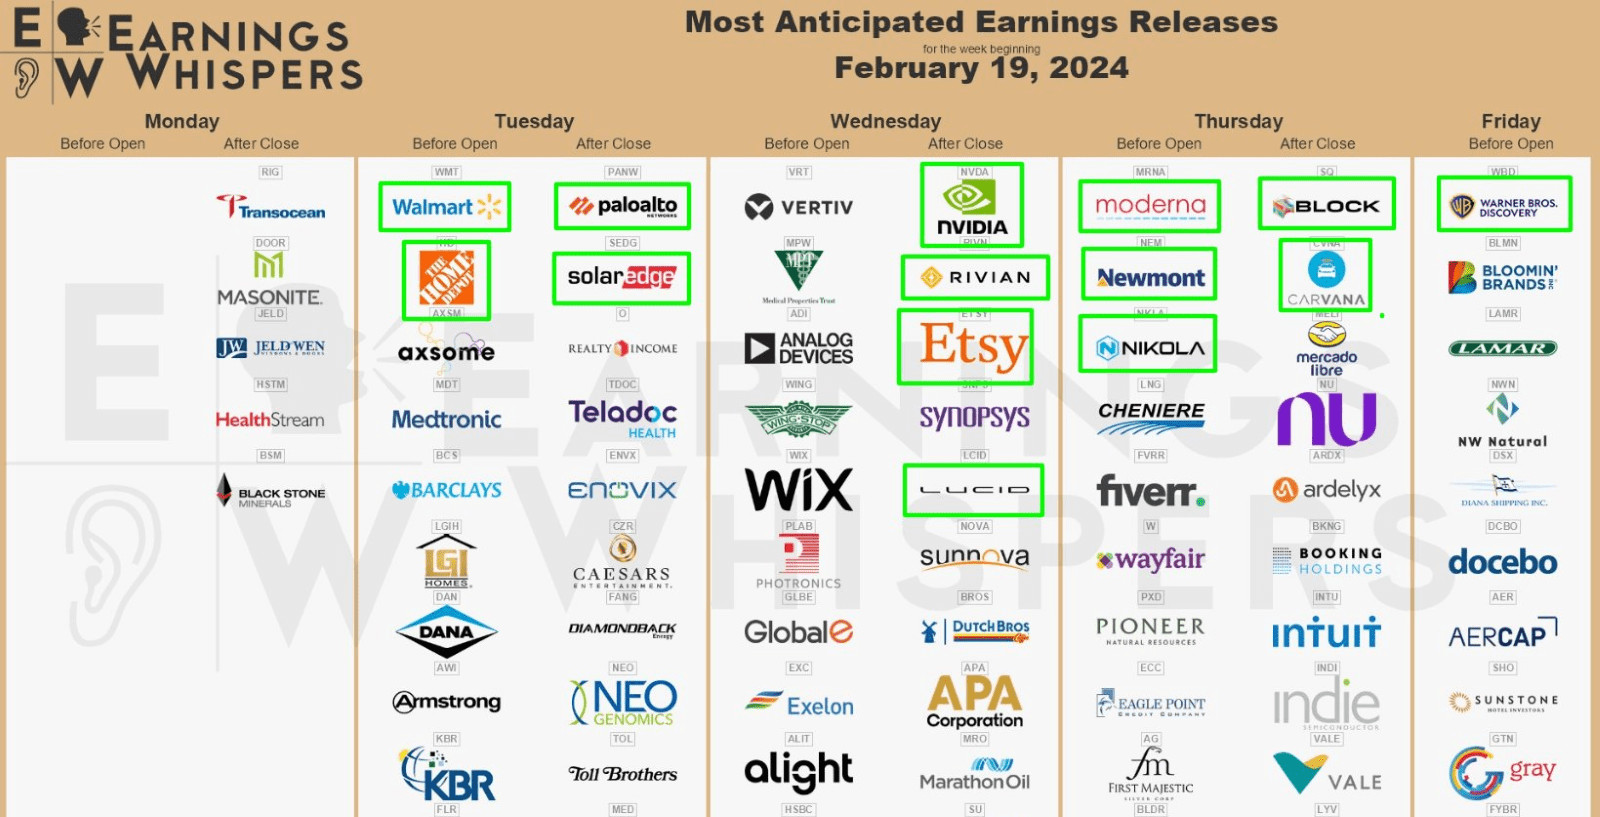
I have a hold rating, however, on the iShares Expanded Tech Sector ETF (NYSEARCA:IGM). While I’m not scared away by its valuation, the fund’s concentration is a risk. With Nvidia's (NVDA) earnings on tap, the ETF’s largest holding could come under pressure if it fails to live up to the AI hype, possibly leading to a pullback in IGM.
Goldman Sachs
Earnings Whispers
According to the issuer, IGM seeks to track the investment results of an index composed of North American equities in the technology sector and select North American equities from communication services to consumer discretionary sectors.
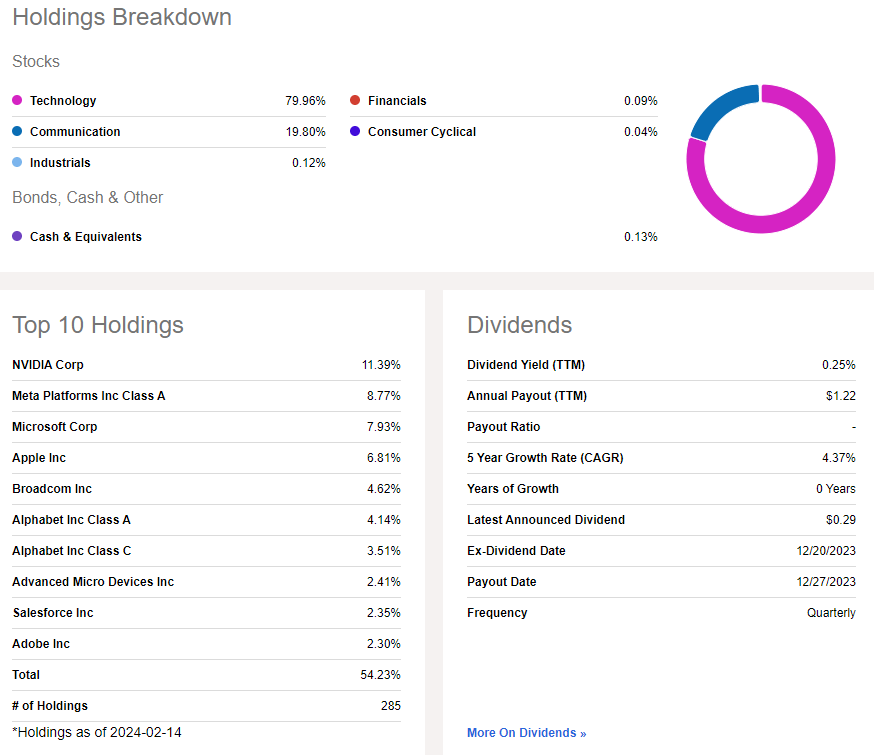
IGM is a growing ETF with total assets under management now surpassing the $4 billion mark. Its annual expense ratio is high in my opinion considering what the fund holds – the largest US tech-related companies. Investors can find comparable ETFs with much lower expense ratios. Its trailing 12-month dividend yield is just 0.25% but share-price momentum has been stellar, helping to earn IGM a No. 5 ranking in its Asset Class, per Seeking Alpha’s Quant Rankings. Risk metrics are generally favorable considering the fund’s low-volatility ascent since the middle of last October. Liquidity is also a strong point for IGM – its 90-day average trading volume is just 30,000 shares, but its median 30-day bid/ask spread is typically just four basis points.
WisdomTree
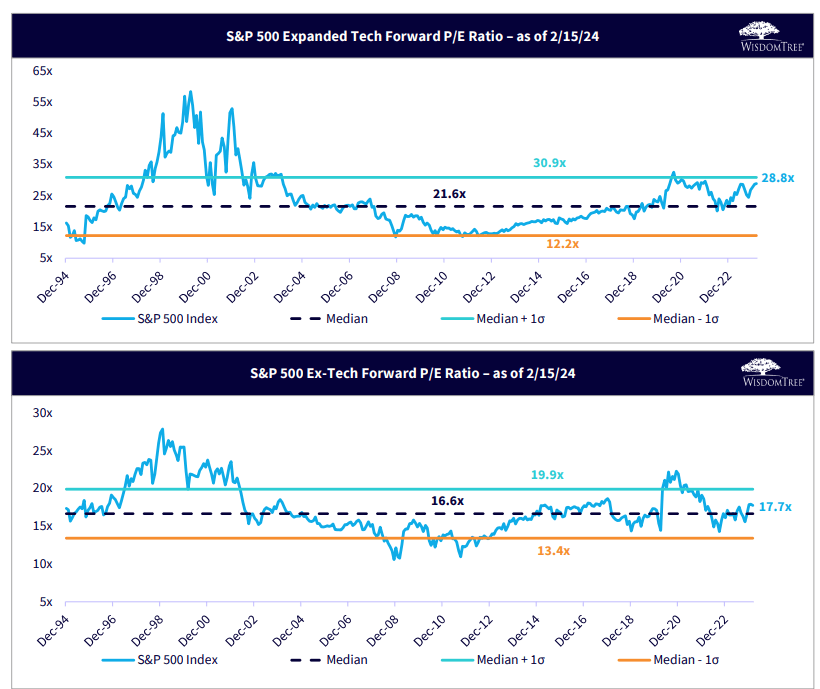
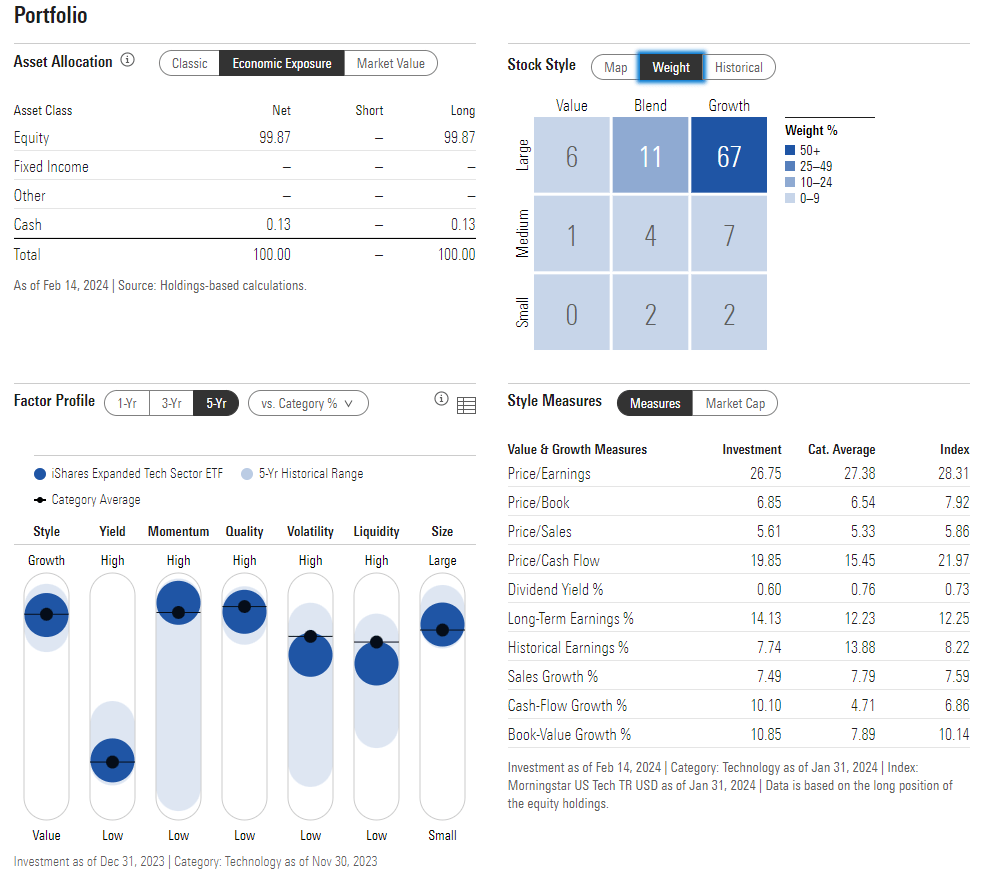
While the risk grade is strong, prospective investors should acknowledge that IGM is highly allocated to the upper-right, large-cap growth quadrant of the style box. The 4-star, Silver-rated fund has a high 27 price-to-earnings ratio, but long-term earnings growth is robust, leading to a PEG ratio that is still above that of other market segments.
Morningstar
Furthermore, BofA notes that the earnings growth of the S&P 493 may soon surpass that of the Magnificent Seven stocks - Apple (AAPL), Microsoft (MSFT), NVDA, Alphabet (GOOG) (GOOGL), Amazon (AMZN), Meta Platforms (META), and Tesla (TSLA).
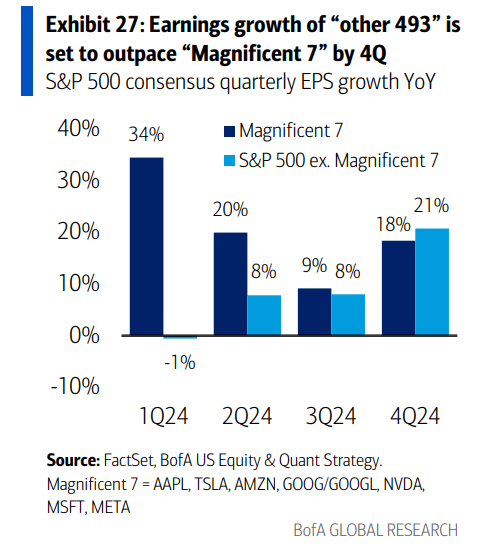
BofA Global Research
What I don’t like about IGM is that the top 10 stocks account for a high 54% of the fund. The largest four positions alone comprise nearly one-third of IGM. Any kind of rotation away from recent winners could quickly lead to underperformance.
Seeking Alpha
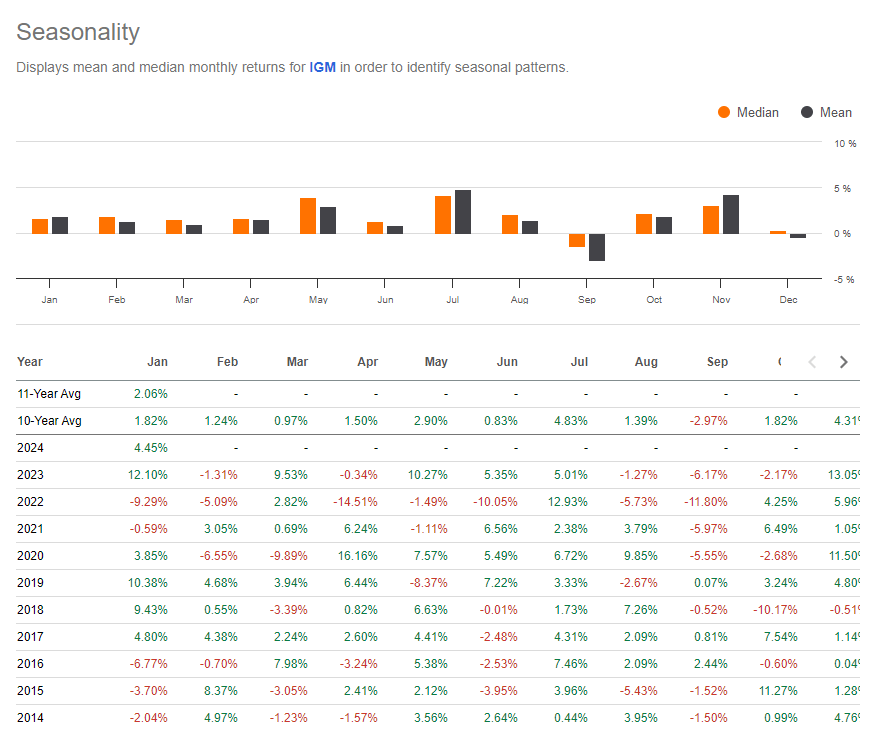
Seasonally, IGM has held up well during this sometimes volatile portion of the calendar, so that is an impressive data point to consider as we venture toward the end of the first quarter. Returns have historically been robust through August.
Seeking Alpha
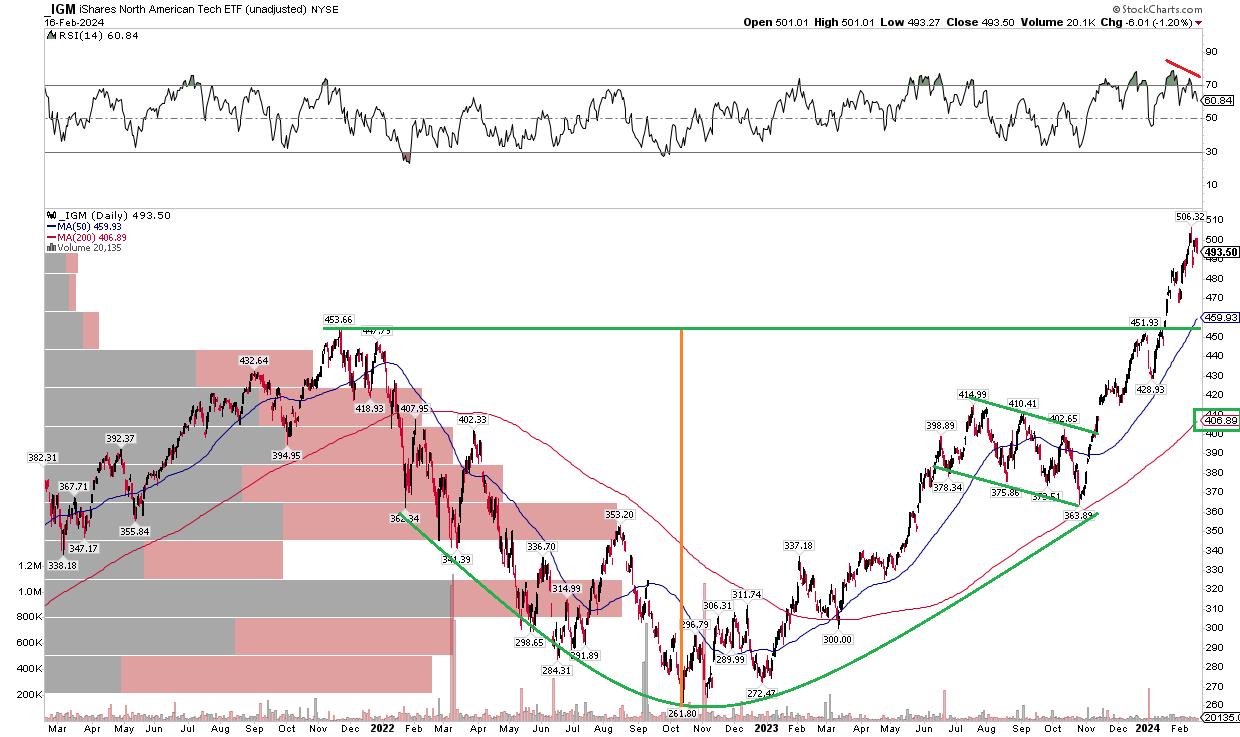
While there are some valuation concerns among most investors and IGM’s concentration is a risk, the ETF’s chart is impressive. Notice in the graph below that shares powered through their late 2021 previous all-time high above $450. The rally off the October 2023 low of $364 has been impressive at nearly 40%. But take a look at the RSI momentum indicator at the top of the graph – it reveals a bearish divergence between momentum and price. Considering that the rising 50-day moving average is down at $459, a bit above key support in the low to mid-$450s, I suspect that a garden-variety correction of 5% to 10% could be in the works.
Buying on a dip to the 50dma could make sense, allowing for the bearish RSI divergence to play out. IGM is close to 20% above its 200-day moving average, which is historically stretched, too. Big picture, the bearish to bullish reversal features an upside measured move price objective to about $650 based on the height of the late 2021 through early 2024 range ($454 - $262 = $192, $192 + $454 = $646).
Overall, the chart pattern is positive, but some recent momentum indicators call for a correction.
Stockcharts.com
I have a hold rating on IGM. I see its portfolio as quite concentrated, particularly ahead of NVDA’s earnings report this week. With a decent valuation and a chart that shows momentum waning, I assert that buying on a pullback to support makes the most sense here.