
KE ZHUANG/E+ via Getty Images
KE ZHUANG/E+ via Getty Images
Looking for high yield infrastructure investments?
This article compares two CEFs: the MainStay CBRE Global Infrastructure Megatrends Term Fund (NYSE:MEGI) and the Voya Infrastructure, Industrials and Materials Fund (IDE).
We covered UTF, a large infrastructure CEF in an article last week, in addition to several other similar funds. It turns out that UTF underperformed several other infrastructure funds, including the Voya Infrastructure, Industrials and Materials Fund (IDE), over the last year.
MEGI invests in companies generating resilient income from the ownership and operation of essential infrastructure assets. Distributions are expected to be paid to shareholders on a monthly basis.
MEGI is focused on the investment megatrends of decarbonization, digital transformation and asset modernization, which are reshaping the demand for infrastructure assets. It has a 12-year limited term and intends to liquidate on or about December 15, 2033. (MEGI site)
IDE invests primarily in companies in the infrastructure, industrials and materials sectors that will potentially benefit from the building, renovation, expansion and utilization of infrastructure. It seeks to build a diversified portfolio of equity securities of companies that may potentially benefit from spending in six areas: power, construction, materials, communications, transportation and water.
IDE's managers sell call options on exchange traded funds. The underlying value of such calls will generally represent 15% to 50% of the total underlying value of the portfolio. (IDE site)
MEGI's management uses 25% leverage - it's a newer fund, IPO'd in late 2021. It's much larger than IDE, with $808M in assets, vs. $178M for IDE; and higher daily volume of 182K, vs. 34K for IDE.
MEGI has a higher expense ratio, at 3.07%, vs. 1.22% for IDE:
Hidden Dividend Stocks Plus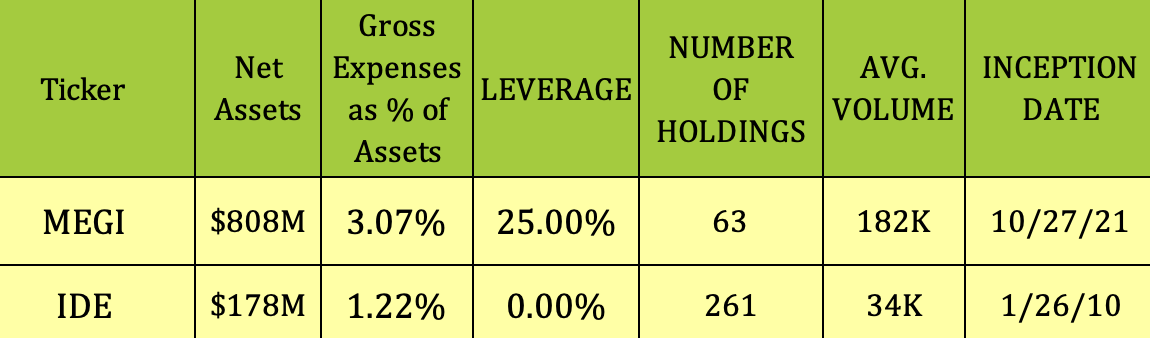
At their 3/21/24 closing prices, MEGI's dividend yield was 12.06%, and IDE's yield was 8.82%. MEGI's management increased the monthly distribution from $.1083 to $.125 in August 2023. MEGI should go ex-dividend next on ~4/19/24.
IDE pays $.229 quarterly - its management decreased the quarterly payout from $.29 to $.229 in December 2019, where it still remains. IDE has a -10.96% 5-year dividend growth rate. It should ex-dividend next on ~4/1/24.
Hidden Dividend Stocks Plus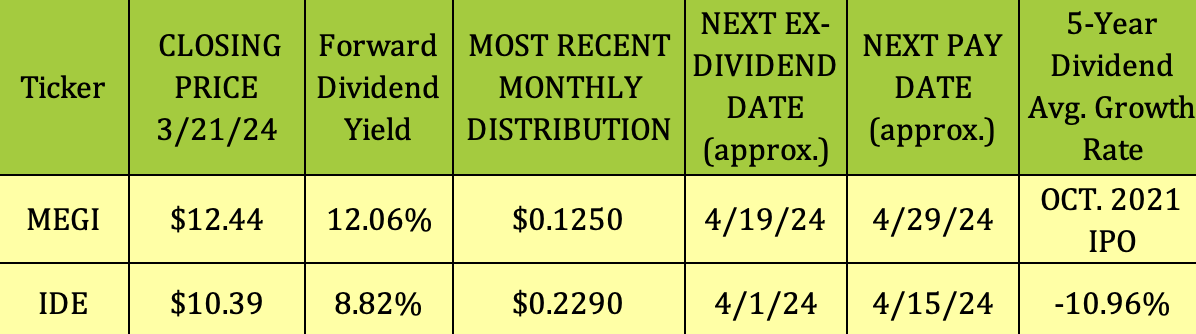
MEGI estimates that NII contributed 73% of its fiscal year to date distributions, with 14% coming from long term capital gains, 3% from short term gains, and 10% from Return of Capital, ROC. ROC offers you a tax deferral advantage, but it does decrease your tax basis, which will affect your taxable profit if you sell your shares.
MEGI site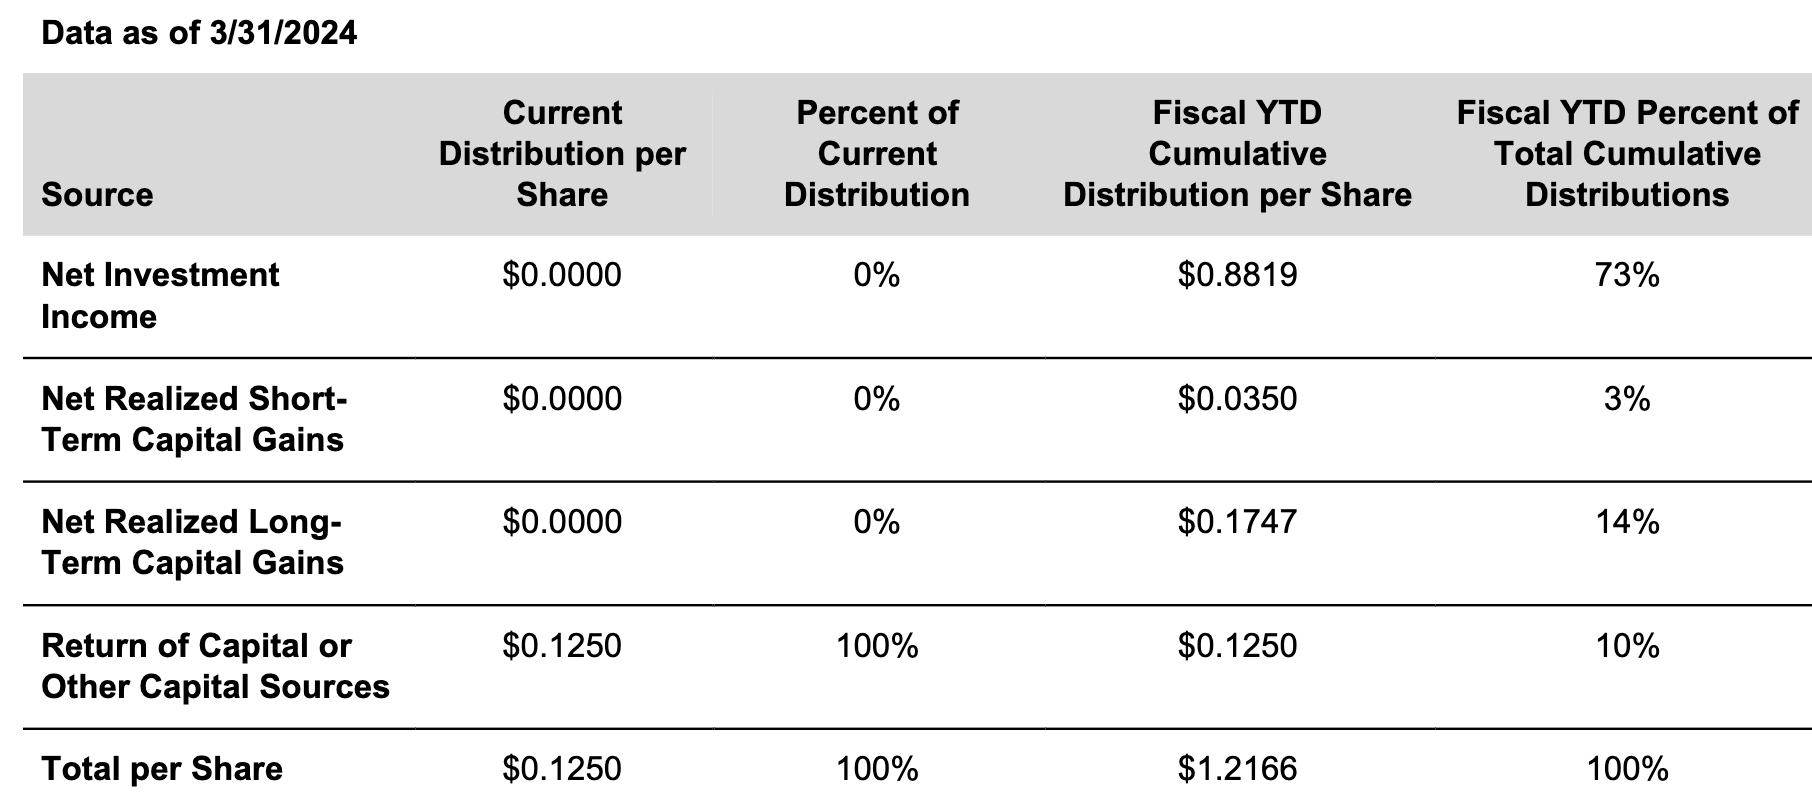
IDE's fiscal year to date distributions are estimated to come from ~45% ROC, 33% long term capital gains, 21.6% NII, and 0.43% short term gains:
IDE site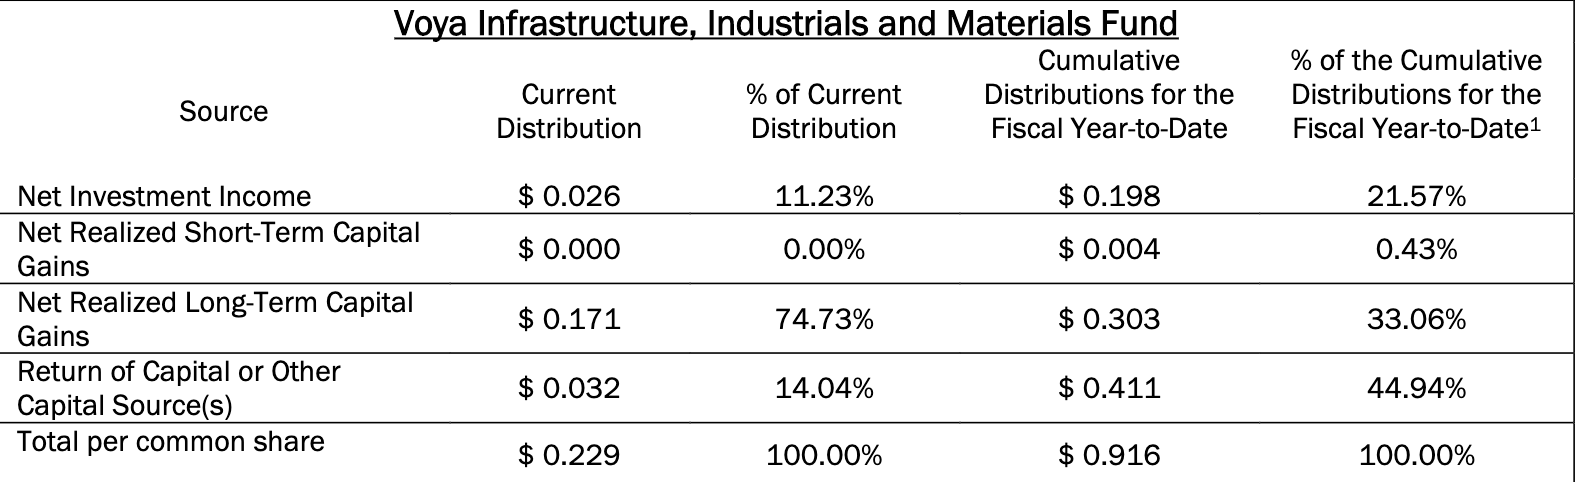
MEGI: Its portfolio is split 45% in N. America, 34% in Europe, and 21% in Asia Pacific.
MEGI site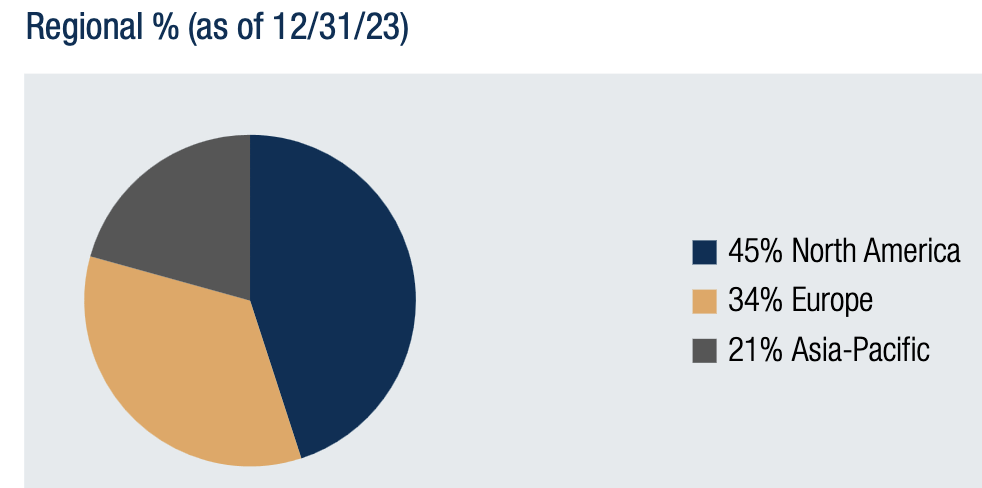
Decarbonization is the biggest theme exposure, at 55%, split between 36% Renewables and 18% smart grid electrification. Asset modernization exposure is at 32%, with sub-categories of Energy Transition, at 15%, Clean Water/Waste, at 7%, Transport, at 8%, ad Diversified, at 2%. Digital Infrastructure exposure is at 13%:
MEGI site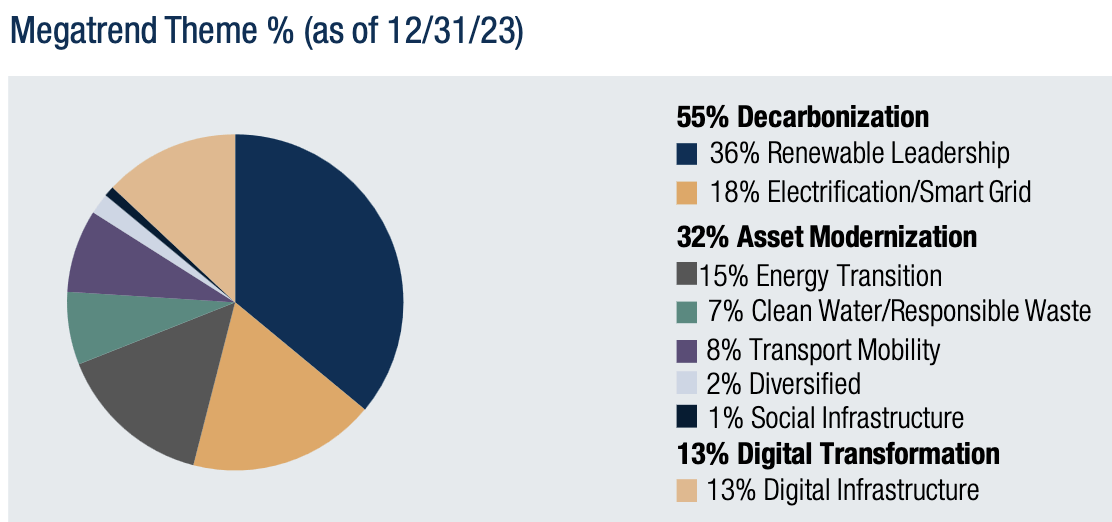
MEGI's top 10 positions form ~42% of its portfolio, led by 2 foreign utility stocks - Enel, at 8.8%, and UK's National Grid, at 5.2%. The top 10 also holds major midstream player Enbridge, communications infrastructure giant Grown Castle, Singapore's fiber company NetLink NBN Trust, in addition to other international companies:
MEGI site
IDE: Its N. American exposure is a bit higher than MEGI's, at ~53%, while its European exposure is lower, at ~17%, as is its Asia-Pacific exposure, at ~16%.
IDE site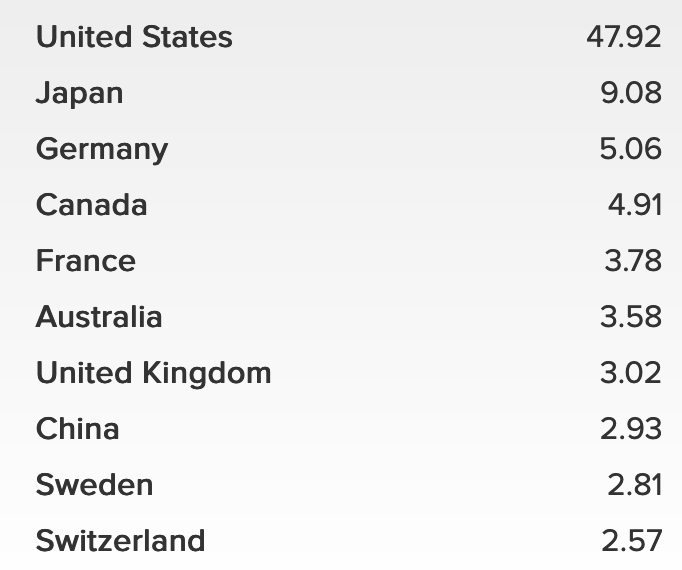
Industrials are the biggest industry exposure, at 8.4%, followed by Electric Utilities, at 6.3%, with a wider range of industries at weightings running from 3.4% to 5.8%:
IDE site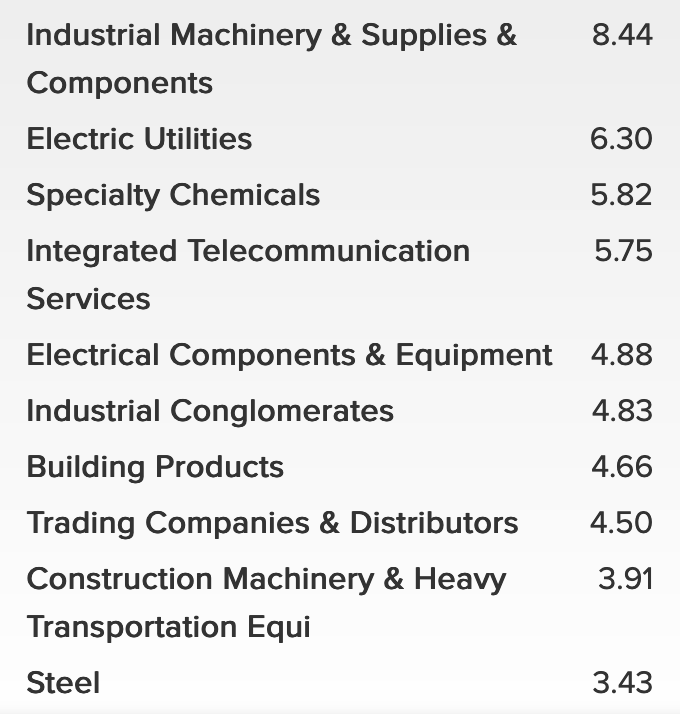
IDE's top 10 holdings only formed ~12% of its portfolio, as of 2/29/24, and included such diverse companies as Cisco, Sherwin Williams, AT&T, and Volvo:
IDE site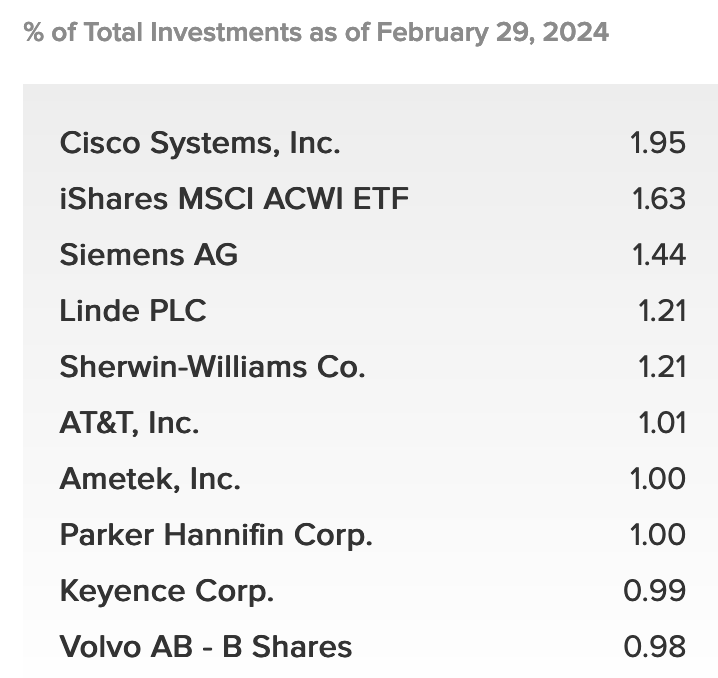
IDE has outperformed MEGI by wide margins over the past month, quarter, year and so far in 2023. Both funds have trailed the S&P 500, but IDE has had an attractive ~22.83% total return over the past year, vs. 32.2% for the S&P.
Hidden Dividend Stocks Plus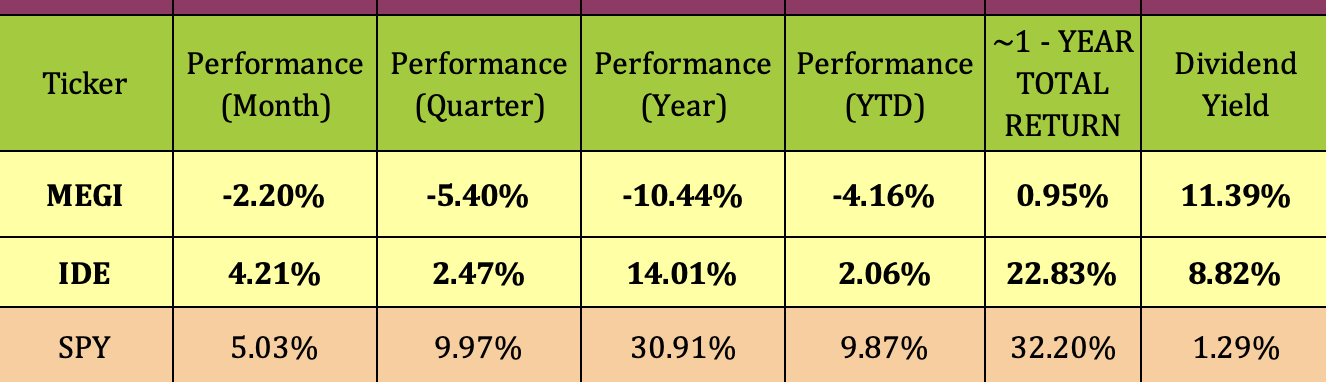
Looking back further - IDE's long term returns are on a lower level than its 1-year return. It had a 10-year NAV return of 4.78%, a 5-year NAV return of 5.80%, and 3-year NAV return of 7.32%:
IDE site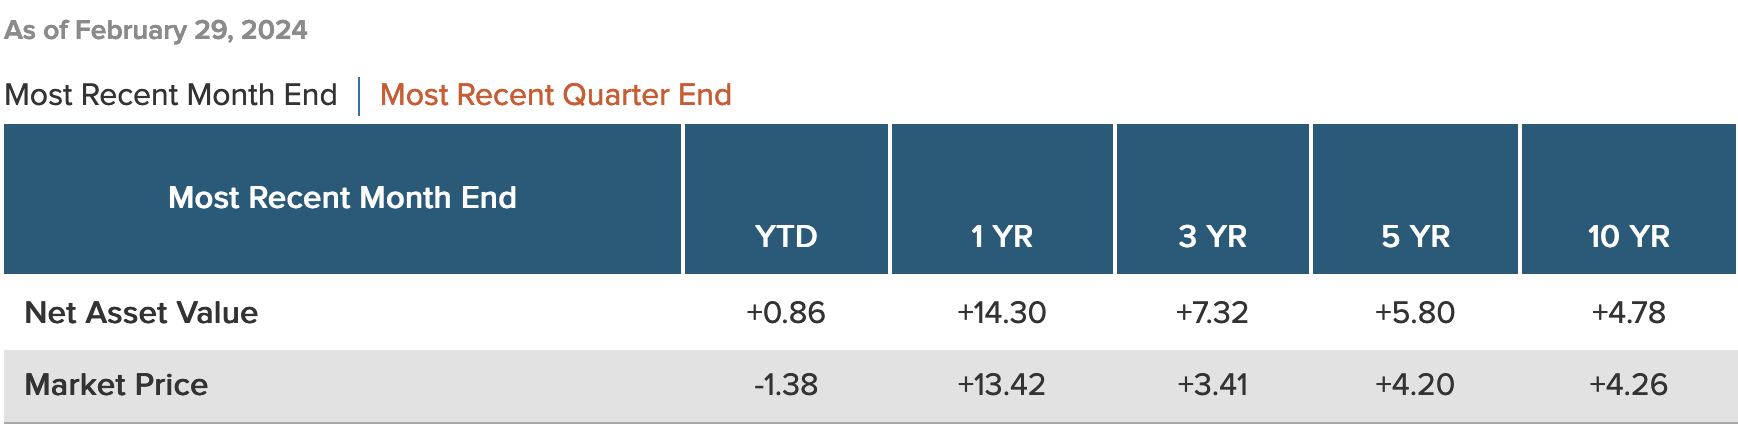
Since NAV/Share is calculated at the end of each trading day, you have to look at the most recent closing values to determine the current NAV discount or premium. Buying CEF's at a deeper discount than their historical average discounts/premiums can be a useful strategy, due to mean reversion.
At their 3/20/24 closing prices, MEGI was selling at a 13.51% discount to NAV/Share, while IDE had a 14.42% discount. MEGI's discount was similar to its 6-month average, and slightly lower than its 1-year average.
IDE's 14.42% discount in line with its 1-year average, but much deeper than its 3-year 10.98% average discount. Although its NAV has decreased from $19.06 at inception to $10.33, IDE has distributed ~$19.00/share over the years.
Hidden Dividend Stocks Plus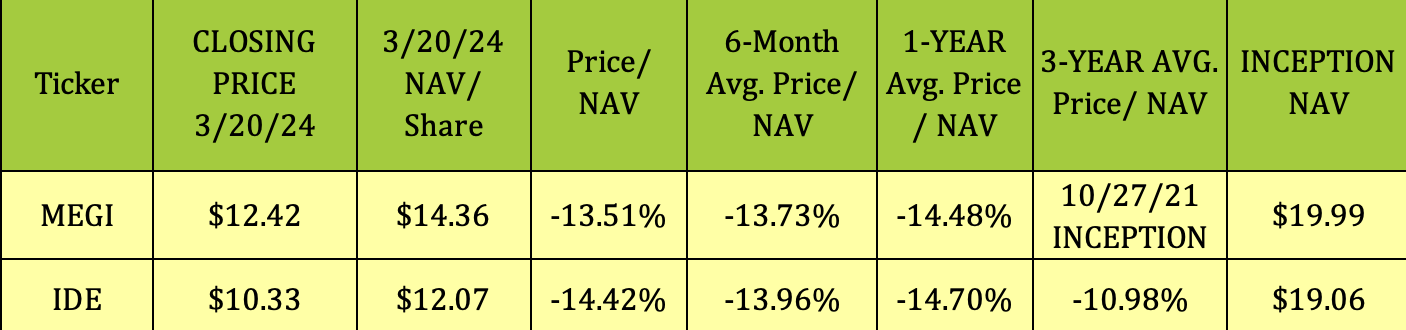
While MEGI's short history doesn't offer you long term trends, it's not encouraging to see a fund which only began in October 2021 with a $19.99 NAV/share already having its NAV drift down to $14.36. We're going to pass on picking up shares of MEGI.
We prefer IDE's greater diversification, but, even though it's selling at a deeper than average discount, its use of covered calls will limit upside gains in a bull market.
All tables furnished by Hidden Dividend Stocks Plus, unless otherwise noted.