
Yuichiro Chino/Moment via Getty Images
Yuichiro Chino/Moment via Getty Images
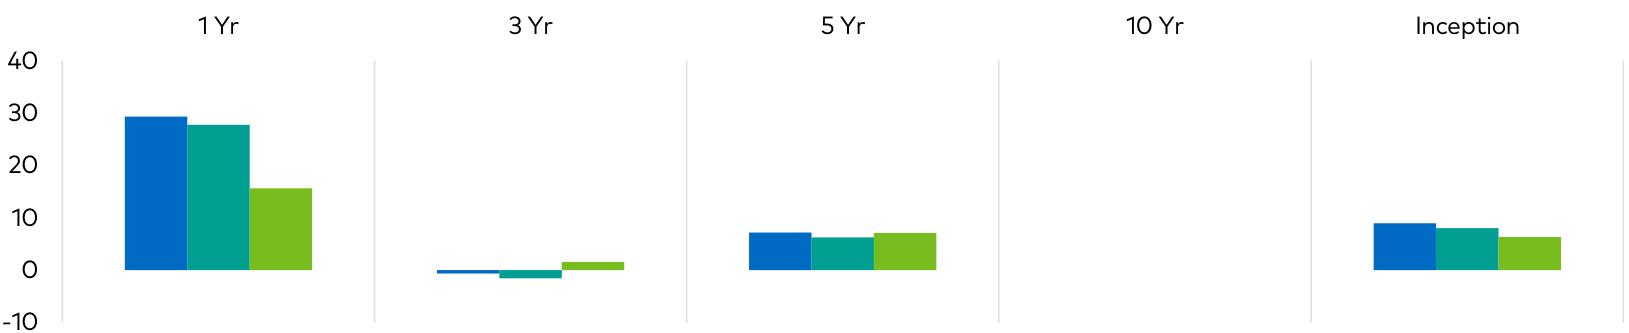
Seeks Growth & Capital Preservation (Performance (%) as of 12-31-2023)
Qtr | YTD | 1 Yr | 3 Yr | 5 Yr | 10 Yr | Inception | |
15.59 | 29.29 | 29.29 | -0.64 | 7.18 | - | 8.95 | |
Polen International Growth (Net) | 15.23 | 27.73 | 27.73 | -1.57 | 6.26 | - | 8.02 |
MSCI ACWI (ex-USA) | 9.75 | 15.62 | 15.62 | 1.55 | 7.09 | - | 6.33 |
| The performance data quoted represents past performance and does not guarantee future results. Current performance may be lower or higher. Periods over one-year are annualized. Performance figures are presented gross and net of fees and have been calculated after the deduction of all transaction costs and commissions, and include the reinvestment of all income. Please reference the GIPS Report which accompanies this commentary. The commentary is not intended as a guarantee of profitable outcomes. Any forward-looking statements are based on certain expectations and assumptions that are susceptible to changes in circumstances. Opinions and views expressed constitute the judgment of Polen Capital as of the date herein, may involve a number of assumptions and estimates which are not guaranteed, and are subject to change. All company-specific information has been sourced from company financials as of the relevant period discussed. Contribution to relative return is a measure of a securities contribution to the relative return of a portfolio versus its benchmark index. The calculation can be approximated by the below formula, taking into account purchases and sales of the security over the measurement period. Please note this calculation does not take into account transactional costs and dividends of the benchmark, as it does for the portfolio. Contribution to relative return of Stock A = (Stock A portfolio weight (%) - Stock A benchmark weight (%)) x (Stock A return (%) - Aggregate benchmark return (%)). |
The consensus view that 2023 would bring a global recession proved wrong. Despite interest rates across much of the world rising from abnormally low levels, many global economies ground along at positive rates of growth. Pockets of weakness in Asia and parts of Europe persist today, but in general, the world economy seems steady. Most companies in the International Growth portfolio ("the Portfolio") are asset-light businesses that fund growth initiatives with internally generated cash, so rising costs of capital do not create the stress that leveraged operators may face in the coming quarters should interest rates remain elevated.
For the full year, the Portfolio appreciated by 27.73% (net of fees) as compared to the MSCI All Country World Index (ex- US) return of 15.62%. Share price appreciation by companies in the information technology, consumer discretionary, and healthcare sectors drove portfolio performance in the year.
Portfolio composition did not change much from 2022, as reflected in full-year portfolio turnover at 13%. During 2023, the valuations accorded to companies we hold improved from the depressed levels registered during 2022. Throughout 2022, we felt market views of many Portfolio holdings reflected excessively dour outlooks. As such, positive re-ratings and earnings delivery by these businesses now bring Portfolio metrics into better alignment with our views.
We continue to believe Portfolio holdings are well positioned businesses poised to grow their earnings faster than the benchmark. In our view, valuations across the Portfolio are fair.
Heading into 2024, conflicts in Western Asia and Eastern Europe are front of mind and threaten to disrupt the flow of traded goods. Further geopolitical uncertainty percolates in the background elsewhere, from the western Pacific to the southern Caribbean. Most economies continue to tread a fine line between positive, slow growth or a garden variety downturn. These points cement our view that the best course to take in markets is owning conservatively capitalized companies with faster-than-average growth potential. The Portfolio delivers on these aims.
During the fourth quarter of 2023, the Portfolio appreciated by 15.23% (net of fees) as compared to the MSCI All Country World Index (ex-US) return of 9.75%. Investor sentiment bottomed in October, setting the stage for a sharp rally in the final months of the year. Share price appreciation by companies in the information technology, healthcare, and consumer discretionary sectors drove quarterly portfolio performance.
The largest relative contributors to the Portfolio's performance during the fourth quarter were Sage Group (OTCPK:SGGEF), Shopify (SHOP), and Lasertec (OTCPK:LSRCF). In absolute terms, the largest contributors to performance during the quarter were Sage Group, ICON Plc (ICLR), and Shopify. The largest relative detractors to the Portfolio's performance during the fourth quarter were Aon Plc (AON), Unilever Plc (UL), and Taiwan Semiconductor (TSM, not owned). From an absolute perspective, the largest detractors during the quarter were Aon, Unilever, and Kering (OTCPK:PPRUF).
Sage Group, which was the largest contributor to relative performance both in the fourth quarter and for the full year, continues to demonstrate strong business momentum with organic revenue growth in the low double-digit range. More recently, in this past quarter, management guided for continued low double-digit revenue growth for their fiscal 2024, a function of Sage's strong value proposition of providing mission-critical software to small and medium-sized businesses. This level of growth, coupled with modest margin expansion, should, in our estimation, allow Sage to grow earnings at a mid-teens annualized rate going forward.
Shopify was the best-performing holding in the Portfolio during 2023, with a 125% total return. The company continued its strong performance last quarter with impressive Q3-23 results that demonstrated continued share gains in North American e-commerce. Additionally, the company's decision last year to sell its fulfillment business, as well as more rational expense management, has led to significant margin expansion with Q3-23 operating margins at 16%, up 1900bps from a year ago. Even accounting for potential valuation compression in the future, we believe Shopify is at least a mid- teens compounder from a return perspective, and we remain excited about the future prospects of the business.
In terms of total return, Lasertec was the best-performing stock in the Portfolio during the fourth quarter, appreciating nearly 70%. As a reminder, Lasertec has a monopoly in the manufacturing of actinic photomask inspection equipment, a critical component of the global semiconductor supply chain market. The company has seen rapid sales growth of its newest photomask machine, and management commentary suggests overall semiconductor sales could be bottoming in the next few months. Given the strong secular trends in the semiconductor industry, as well as Lasertec's importance in it, we believe the company is likely to be one of the faster- growing companies in the Portfolio. At the same time though, the stock's premium valuation earns it a smaller weight in our strategy.
Aon Plc's stock price underperformed during this past quarter following the announcement of the company's acquisition of NFP, a middle market insurance broker, for $13 billion. Though the deal complements Aon's current business, it is expected to be dilutive to earnings in the near term, and thus prompted a sell-off in the shares. We will continue to assess the merits of the NFP transaction, but it does not currently change our long-term view of Aon, which we view as a steady, durable, low-teens earnings compounder.
Unilever Plc was a relative underperformer during the fourth quarter though this underperformance appears to us to be less a factor of any specific fundamental issues with the company. Rather, it seems more a result of consumer staples companies like Unilever underperforming during a quarter in which the broad market rallied sharply through much of November and December. Though we do not currently own it in the Portfolio, Taiwan Semiconductor was one of the larger relative detractors from performance during the quarter due to its strong performance and comparatively greater index weight.
During the quarter, we did not initiate any new positions, nor did we eliminate any existing positions. We did, however, add to our existing positions in Medtronic (MDT), Teleperformance (OTCPK:TLPFF), HDFC Bank (HDB), and Temenos (OTCPK:TMNSF). On the other hand, we trimmed our positions in Unilever, ASML, and Lasertec.
Medtronic is the largest medical technology company in the world. Despite a few tough years characterized by post-COVID supply chain issues, Chinese market payment changes, and diabetes business challenges, the company has continued to invest aggressively in its R&D pipeline. Because of this long- term mindset and commitment to product innovation, the company is in a position today where it has numerous significant new product launches across the business, helping to accelerate growth and improve profitability. More recently, the market's infatuation with the promise of GLP-1 drugs has resulted in valuation de-ratings across the medtech industry broadly, to which Medtronic was not immune. The combination of all of these factors has resulted in Medtronic shares trading at their lowest valuation in a decade. Given the emerging business momentum, we felt the valuation offers a compelling chance to increase our weight in the world's largest medtech company.
France-based Teleperformance is the world's leading outsourced call center manager. Teleperformance shares suffered in 2023 as sentiment surrounding AI adoption reached a crescendo and related market narratives assumed customer experience services would be fully automated. We believe Teleperformance's customers and many other businesses will continue to require effective human customer experience management. Teleperformance continues to leverage technologies, including AI, to deliver successful business outcomes to customers. Management effectively navigated the impacts of transformational technologies at times over its 40 years in business and is proactively thinking through opportunities in the present environment. We believe
Teleperformance can weather today's weak IT services market environment and rebound to the steady growth trajectory of recent years. We see low double-digit total returns ahead. At 8x 2024 earnings, shares discount a darker future than we think is in store. As such, we have increased the position to a more full-sized position.
HDFC Bank is the largest private sector bank in India. It has benefited from the strong growth of the Indian economy over the past two decades while taking significant share from its less well-run public-sector competitors. We expect these trends to remain in place for at least the next five years. More recently, HDFC Bank's share price has stagnated after its merger with parent company, HDFC Ltd. After the completion of the merger in Q3 2023, the bank's margins and returns on capital have deteriorated slightly, owing to its parent company's higher cost of funding. We expect in the coming years, HDFC Bank will integrate its parent's operations and replace its higher-cost funds with lower-cost deposits. If it continues to execute on its strategy well, then a period of outsized earnings growth could follow. Meanwhile, valuations trade at an attractive level of 17x forward earnings, a level not much above its 2008 low valuations. Given this, we increased our position to reflect a more full-sized position.
Switzerland-based Temenos is one of the world's largest software providers to the banking industry. Since our initial purchase in November 2020, the company has faced several difficulties. A volatile economic environment reduced customer willingness for transformational projects, and this issue was compounded by broad management turnover and a business model transition away from a license + maintenance payment model toward a subscription model. Over the past year, the economic environment has stabilized, new management has been installed with a permanent CEO search still active, and >80% of software revenues have transitioned to subscription. At the same time, growth has accelerated, and profitability has begun to improve. As the subscription transition matures, we expect revenue growth to be less volatile and profitability to continue to improve. Given this, we increased our position to reflect a more full-sized position.
UK-based Unilever, among the largest consumer goods companies in the world, has navigated the last few years well. During the post-COVID inflation surge, Unilever's brands enjoyed consistent pricing power and delivered higher-than- average revenue growth. Recently, signs of softening consumer spending have appeared. Inflation measures are now softening, and at the margin, consumers are switching away from branded goods in favor of generic products. Considering decelerating growth, we trimmed our Unilever position and added to Medtronic.
Netherlands-based ASML and Japan-based Lasertec play dominant roles within different segments of the global semiconductor industry. In both cases, shares rallied significantly in the fourth quarter of 2023, prompting our positions to grow as a percentage of the overall portfolio. We believe both companies will see demand for their products as extreme ultraviolet (EUV) lithography and soon high-numerical aperture lithography must be utilized to manufacture the world's smallest chips. However, in our estimation, 2024 could deliver a year of less exciting growth for the semiconductor industry, which prompted us to trim these positions back.
The Portfolio holds competitively advantaged businesses whose weighted average earnings are expected to grow at a mid-teens rate over time. We believe a portfolio of well positioned businesses supports confidence that short-term disruptions are speedbumps on the road to long-term success.
Thank you for your interest in Polen Capital and the International Growth strategy. Please feel free to contact us with any questions.
| GIPS Report International Growth Composite-GIPS Composite Report
Performance % as of 12-31-2023: (Annualized returns are presented for periods greater than one year)
1 A 3 Year Standard Deviation is not available for 2017 and 2018 due to 36 monthly returns are not available. Some versions of this GIPS Report previously included assets of the Firm's wholly-owned subsidiary in the 2022 Firm Assets figure, in error. The figure above has been corrected to no longer count assets at the subsidiary level. Total assets and UMA assets are supplemental information to the GIPS Composite Report. N/A - There are five or fewer accounts in the composite the entire year. While pitch books are updated quarterly to include composite performance through the most recent quarter, we use the GIPS Report that includes annual returns only. To minimize the risk of error we update the GIPS Report annually. This is typically updated by the end of the first quarter. GIPS Report The International Growth Composite created and incepted on January 1, 2017 contains fully discretionary international growth accounts that are not managed within a wrap fee structure and for comparison purposes is measured against MSCI ACWI (ex-USA). Effective January 2022, fully discretionary large cap equity accounts managed as part of our International Growth strategy that adhere to the rules and regulations applicable to registered investment companies subject to the U.S. Investment Company Act of 1940 and the Polen International Growth Collective Investment Trust were included into the International Growth Composite. The accounts comprising the portfolios are highly concentrated and are not constrained by EU diversification regulations. Polen Capital Management claims compliance with the Global Investment Performance Standards (GIPS®) and has prepared and presented this report in compliance with the GIPS standards. Polen Capital Management has been independently verified for the periods April 1, 1992 through December 31, 2022. The verification reports are available upon request. A firm that claims compliance with the GIPS standards must establish policies and procedures for complying with all the applicable requirements of the GIPS standards. Verification provides assurance on whether the firm's policies and procedures related to composite and pooled fund maintenance, as well as the calculation, presentation, and distribution of performance, have been designed in compliance with the GIPS standards and have been implemented on a firm- wide basis. Verification does not provide assurance on the accuracy of any specific performance report. Polen Capital Management is an independent registered investment adviser. Polen Capital Management maintains related entities which together invest exclusively in equity portfolios consisting of high-quality companies. A list of all composite and pooled fund investment strategies offered by the firm, with a description of each strategy, is available upon request. In July 2007, the firm was reorganized from an S-corporation into an LLC and changed names from Polen Capital Management, Inc. to Polen Capital Management, LLC. Results are based on fully discretionary accounts under management, including those accounts no longer with the firm. Effective January 1, 2022, composite policy requires the temporary removal of any portfolio incurring a client initiated significant net cash inflow or outflow of 10% or greater of portfolio assets, provided, however, if invoking this policy would result in all accounts being removed for a month, this policy shall not apply for that month. The U.S. Dollar is the currency used to express performance. Returns are presented gross and net of management fees and include the reinvestment of all income. Net of fee performance was calculated using either actual management fees or highest fees for fund structures. The annual composite dispersion presented is an asset-weighted standard deviation using returns presented gross of management fees calculated for the accounts in the composite the entire year. Policies for valuing investments, calculating performance, and preparing GIPS Reports are available upon request. The separate account management fee schedule is as follows: Institutional: Per annum fees for managing accounts are 85 basis points (0.85%) on the first $50 Million and 65 basis points (0.65%) on all assets above $50 Million of assets under management. HNW: Per annum fees for managing accounts are 160 basis points (1.60%) of the first $500,000 of assets under management and 110 basis points (1.10%) of amounts above $500,000 of assets under management. Actual investment advisory fees incurred by clients may vary. The per annum fee schedule for managing the Polen International Growth Fund, which is included in the International Growth Composite, is 85 basis points (.85%). The total annual fund operating expenses are up to 135 basis points (1.35%). As of 9/1/2023, the mutual fund expense ratio goes up to 1.33%. This figure may vary from year to year. The per annum all-in fee* schedule for managing the Polen International Growth Collective Investment Trust, which is included in the International Growth Composite, goes up to 70 basis points (.70%). *The all-in fee (which is similar to a total expense ratio) includes all administrative and operational expenses of the fund as well as the Polen Capital management fee. Past performance does not guarantee future results and future accuracy and profitable results cannot be guaranteed. Performance figures are presented gross and net of management fees and have been calculated after the deduction of all transaction costs and commissions. Portfolio returns are net of all foreign non-reclaimable withholding taxes. Reclaimable withholding taxes are reflected as income if and when received. Polen Capital is an SEC registered investment advisor and its investment advisory fees are described in its Form ADV Part 2A. The advisory fees will reduce clients' returns. The chart below depicts the effect of a 1% management fee on the growth of one dollar over a 10 year period at 10% (9% after fees) and 20% (19% after fees) assumed rates of return. The MSCI ACWI ex USA Index is a market capitalization weighted equity index that measures the performance of large and mid-cap segments across developed and emerging market countries (excluding the U.S). The index is maintained by Morgan Stanley Capital International. The volatility and other material characteristics of the indices referenced may be materially different from the performance achieved. In addition, the composite's holdings may be materially different from those within the index. Indices are unmanaged and one cannot invest directly in an index. The information provided in this document should not be construed as a recommendation to purchase or sell any particular security. There is no assurance that any securities discussed herein will remain in the composite or that the securities sold will not be repurchased. The securities discussed do not represent the composite's entire portfolio. Actual holdings will vary depending on the size of the account, cash flows, and restrictions. It should not be assumed that any of the securities transactions or holdings discussed will prove to be profitable, or that the investment recommendations or decisions we make in the future will be profitable or will equal the investment performance of the securities discussed herein. A complete list of our past specific recommendations for the last year is available upon request.
GIPS® is a registered trademark of CFA Institute. CFA Institute does not endorse or promote this organization, nor does it warrant the accuracy or quality of the content contained herein. | |||||||||||||||||||||||||||||||||||||||||||||||||||||||||||||||||||||||||||||||||||||||||||||||||||||||||||||||||||||||||||||||||||||||||||||||||||||||||||||||||||||||||||
Editor's Note: The summary bullets for this article were chosen by Seeking Alpha editors.
Editor's Note: This article discusses one or more securities that do not trade on a major U.S. exchange. Please be aware of the risks associated with these stocks.