
Khanchit Khirisutchalual
Khanchit Khirisutchalual
abrdn Healthcare Investors (NYSE:HQH) is a closed-end fund, or CEF, that was incepted nearly 37 years ago in April 1987. The fund was formerly known as Tekla Healthcare Investors with the same symbol HQH. Recently, all of the Tekla funds (four healthcare funds) were acquired by the Aberdeen group along with all of the management staff. So, in essence, the management and objectives of the fund have not changed except the umbrella group.
The Aberdeen Group is a U.K.-based investment firm managing over $600 billion of assets for institutional and retail clients worldwide. The fund [HQH] invests in the equities of healthcare companies all over the globe, but mostly in the companies based or listed in the U.S. The fund's primary objective is to provide high income, mostly by means of capital gains. It generates very little income by way of dividends, which are consumed by the expenses, including management fees.
As per the fund's literature:
"Abrdn Healthcare Investors is a non-diversified closed-end healthcare fund traded on the New York Stock Exchange (under the ticker HQH). HQH primarily invests in healthcare industries and will emphasize both large, established companies and smaller, emerging companies, with a maximum of 40% of the fund's assets in restricted securities of both public and private companies. The Fund's investment objective is to seek long-term capital appreciation by investing primarily in securities of healthcare companies. In addition, the Fund seeks to provide regular distribution of realized capital gains."
Let's look at the Fund's Financial health and performance. The most recent detailed report that is available to investors is the annual report for the period of Oct. 2022 – Sep. 30, 2023.
The net investment income (or NII in short) is the net income that a fund earns from its investment in the form of dividends, distributions, and interests or derivatives like options, minus all of the fund's expenses, including management fees, operating expenses, commissions, and interest on leverage. For equity-based funds, especially in high-growth sectors like technology, the NII is not very relevant. However, for fixed-income or bond funds, it is very relevant.
The HQH fund is between 85-90% equity and the rest in convertible preferreds or cash equivalents. Also, more than 50% of its assets are invested in biotechnology companies, some of which do not pay much dividends. So, whatever income is generated it is all consumed by the expenses, and in fact, all of the distribution has to be supported by the realized capital gains. This is okay when markets and the healthcare sector are doing good. However, during the downturn, the fund may not have sufficient capital gains to pay the distribution, and it has to pay as ROC. It may not be a problem in the long term, but a prolonged downturn can really hurt the NAV.
Here is what it looks like in terms of NII, Distributions, and Net Assets at the beginning and end of the statement period.
(all amounts are in US $ (except Shares Outstanding) for the 12-month period; negative amounts are shown inside parentheses, per the annual report, 12 months ending Sep.30, 2023. We also provide the data for the year 2022 for comparison.
Table-1:
Data source: HQH's 2023 annual report.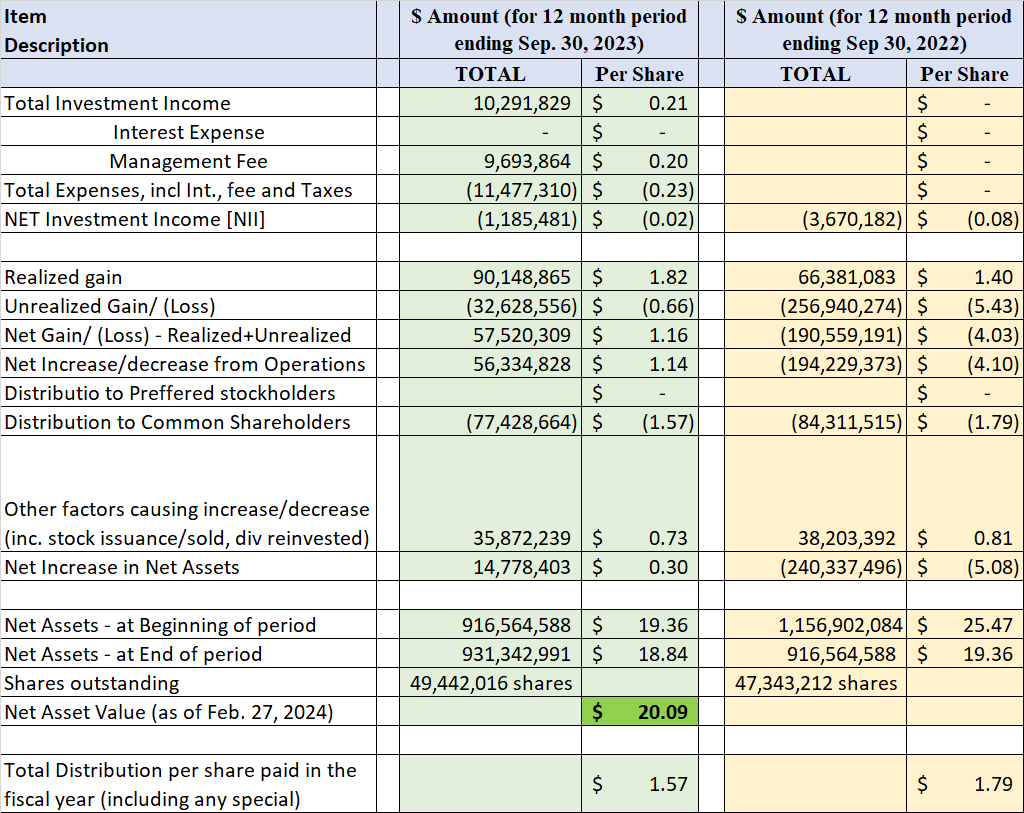
In the most recent quarter, HQH increased the distribution amount to $0.48 a share (from $0.38 the previous quarter), which is a sign of improving NAV during the last quarter.
So, is the distribution covered?
Table-2: Distribution (from 2020-2023)
Fund's Literature.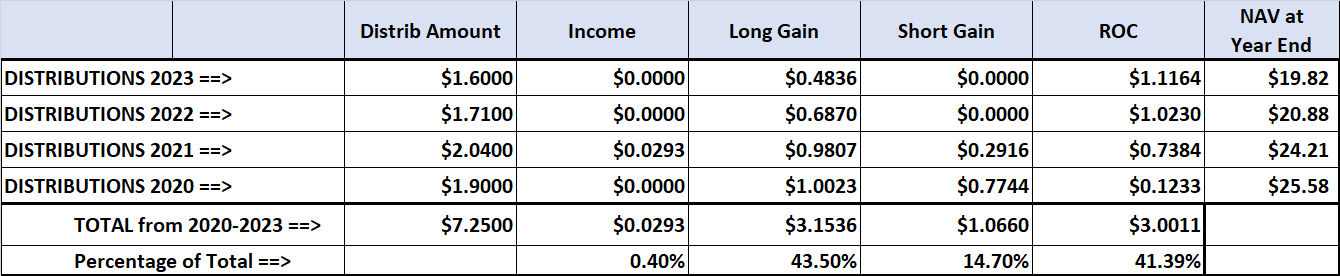
We can observe from the above table that distribution varies from year to year, but no more than 20%. We also observe that nearly 40% of the dividend in the last four years has been paid as ROC. Distributions in the form of NAV itself are not bad, but they are bad when accompanied by a declining NAV. This may be a temporary period of difficulty; as we know, the healthcare sector was hammered pretty badly in 2022 and 2023. However, the sector is showing signs of recovery right now.
The fund is currently trading at a discount of -14.58% to its NAV. But if you look at its 3-year history, it has traded at a discount of -7.83% on average. At the same time, the recent discount has been higher in the last six months, with an average of -16.30%. If we look at the 5-year chart below, the majority of the time, it has traded at roughly -10% discount. All that said, we should always look at both the premium/discount and the overall valuation of the fund within its sector. Right now, generally, stocks are quite expensive, but not the healthcare sector.
Chart-1: HQH – Premium/Discount Chart
CEFConnect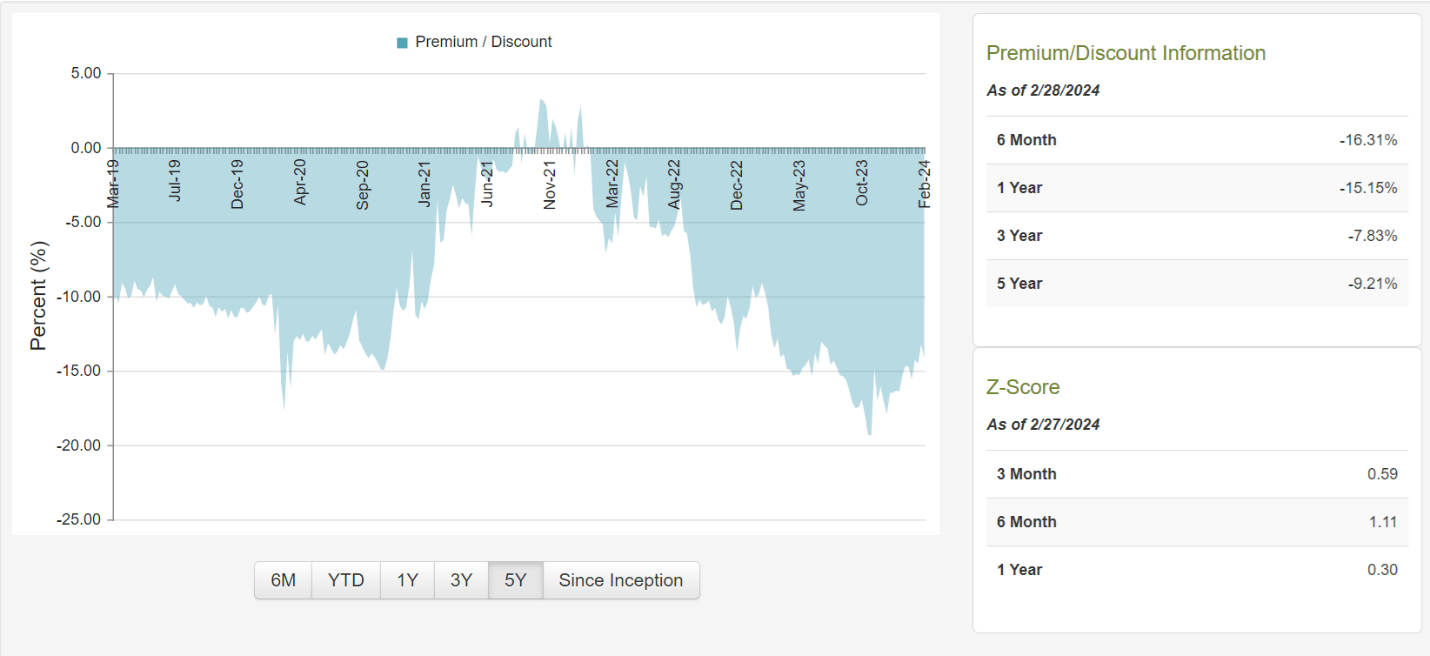
The fund is sector-specific and heavily weighted towards the biotechnology sector with the broader healthcare sector. It has nearly 100 equity positions and a total of 127 positions as of Jan.31, 2024. The top 10 holdings, which are mostly equity positions, make up about 45% of the total assets, which makes it a concentrated fund.
Some of the top holdings are Vertex Pharma (VRTX), Regeneron Pharma (REGN), Amgen (AMGN), Gilead Sciences (GILD), AstraZeneca (AZN), Biogen (BIIB), Eli Lilly (LLY), and AbbVie (ABBV).
The top holdings and asset composition as of Jan.31, 2024, are presented below.
Table-3: Holdings as of 01/31/2024
Seeking Alpha
Chart-2:
Fund's Literature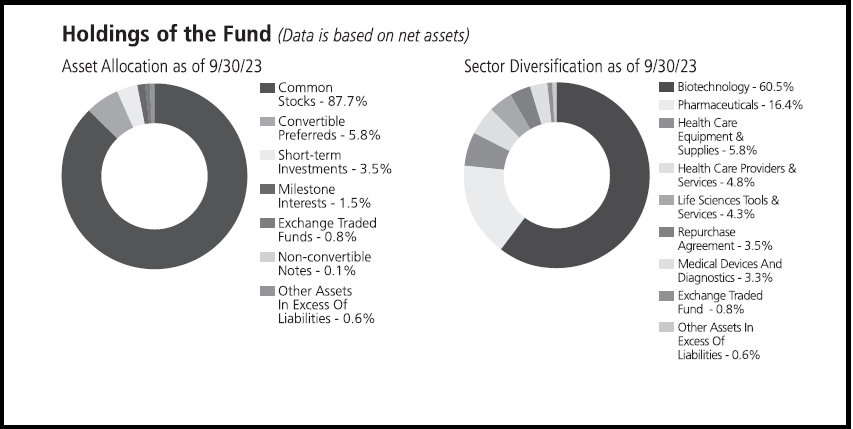
The fund's big attractions are its current high yield of over 11% and nearly -15% discount to NAV. However, if you are looking for market-beating performance, this may not be the fund. Though the long-term performance has been solid, the recent and mid-term performance of this fund does not inspire much. However, the healthcare sector in general, and biotech in particular, has underperformed the broader market heavily in the recent past.
Table-4:
Fund's Literature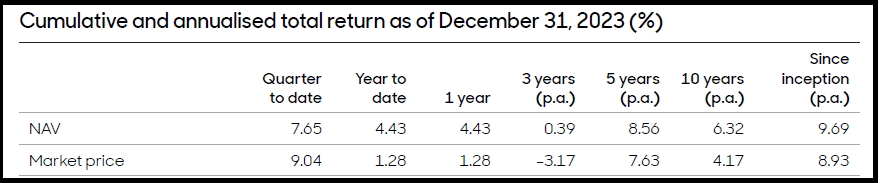
In the above table, the performance since inception stands out as it has nearly matched the S&P 500 Index (SP500) over a period of 37 years. But the short or near-term performance has been dismal, especially if we compare it with the S&P 500. As such, the S&P 500 is not an appropriate benchmark for this fund. The closest benchmark may be the "NASDAQ Biotechnology Index."
Since HQH fund is 87% equity (with nearly 56% allocation to biotechnology), its performance will naturally be heavily impacted based on how the biotech sector does in the future. The fund uses no leverage, so the movement of interest rates has no direct impact on the fund, but certainly, it has an impact on the securities that the fund holds.
Let's see how the fund compares over the last 20, 10, 5, and 3 years with the S&P 500 and a hypothetical blended fund (to mimic HQH allocations).
Blended Fund 1 (hypothetical):
Blended Fund 2 (hypothetical):
Table-5: (Data - period as specified, if not specified then as of Jan.31, 2024)
Item Desc. | HQH (on NAV basis) | Blended I (56% XBI, 34% XLV, 7% FCVSX, 3% Cash) | Blended II (56% IBB, 34% XLV, 7% FCVSX, 3% Cash) | S&P 500 |
Annualized Return [CAGR] From Jan. 2007 – Jan 2024 | 8.89% | 10.98% | 10.29% | 9.44% |
Dividend Yield% (as of 02/27/2024) | 11.19% | 0.80% | 0.94% | 1.31% |
Annualized Return [CAGR] From Jan.2008-Jan.2024 | 8.42% | 10.45% | 10.55% | 9.75% |
Max. Drawdown (2008-2023) | -28.8% | -32.6% | -29.0% | -48.5% |
Std. Deviation (2008-2023) | 16.8% | 20.2% | 16.8% | 16.2% |
10-Year CAGR (Feb 2014 – Jan 2024) | 5.17% | 8.48% | 7.66% | 12.46% |
5-Year CAGR | 5.55% | 5.96% | 7.30% | 14.14% |
3-Year CAGR | -1.40% | -5.99% | 0.04% | 10.83% |
1-Year CAGR | 3.34% | 2.02% | 2.21% | 20.65% |
Fees (excluding interest) | 1.18% | 0.25% (XBI, XLV combined) | 0.31% (IBB, XLV combined) | 0.09% |
Leverage | 0% | 0% | 0% | 0% |
No of holdings | 127 | 189 (XBI, XLV combined) | 293 (IBB, XLV combined) | 504 |
Assets | ~$1 Billion | >$48 Billion (XBI, XLV ) | >$48 Billion (IBB, XLV ) | $484 Billion |
Allocation | 90% Equity (56% biotech), 7% Convertibles, 5% others. | 56% Biotech, 34% Healthcare, 7% Convertibles, 3% Cash. | 56% Biotech, 34% Healthcare, 7% Convertibles, 3% Cash. | Largest 500 US companies |
Note: Some of the data (e.g., number of holdings and leverage) may not be current as of Jan.31, 2024.
Now, we can observe that in the last 17 years, the blended fund (from broad Biotech and Healthcare ETFs) sometimes performed better than HQH but other times worse. What we see is that the healthcare sector, and especially the biotech segment, has performed very poorly during the last five years. HQH, being in that space, could not have done much better.
At the same time, HQH offers a very high yield of 11% in addition to a deep discount of -15% on its NAV. The healthcare sector has been in a down cycle for quite some time, and the biotechnology sector is especially highly cyclical. When a closed-end fund like HQH is in a down cycle, the discounts tend to get larger. So, we can hope that when the cycle turns positive and NAV starts improving, the discount should start getting narrower. However, investors will need patience for this to play out.
Investors need to be aware of certain risk factors that are associated with this fund and CEFs in general. Risk factors could be summarized as follows:
HQH fund currently offers a deep discount of nearly -15% and a high distribution yield of 11% plus. The distribution yield is 2.5% of NAV every quarter (increased from 2% recently); hence, it is variable. The healthcare sector and the biotech segment are showing early signs of recovery (from a down cycle), but it may take time for it to show substantial progress. Patient investors can profit by playing abrdn Healthcare Investors right while being paid for waiting. For existing investors, it is a "hold."