Alex Potemkin/iStock via Getty Images
Alex Potemkin/iStock via Getty Images
You may recall that a few days ago I wrote an article titled, 3 Risky Office REITs (Dumpster Fire Alert).
In that article, I explained that office real estate investment trusts, or REITs, can “offer value” for those who are “willing to take on elevated risks.”
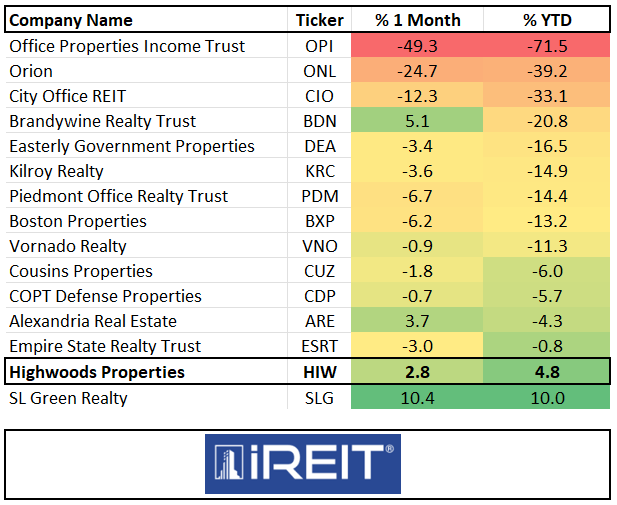
Just look at the year-to-date performance (or shall we say underperformance) of the office sector:
iREIT®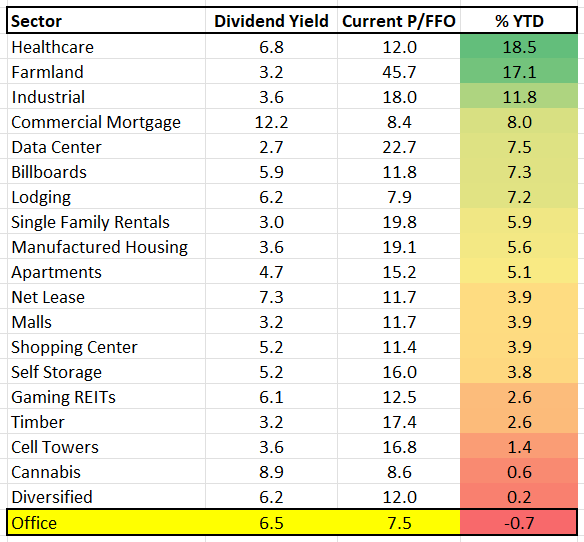
Our team is constantly scanning the REIT universe in search of opportunities, and we find it especially exciting in the office sector.
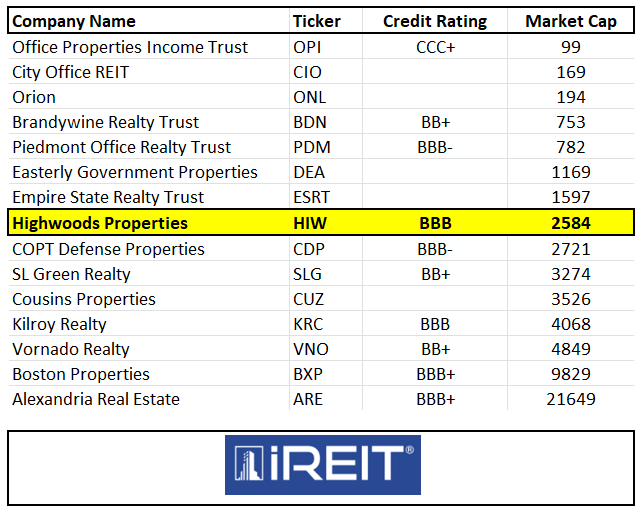
Today I wanted to take a closer look at North Carolina-based Highwoods Properties, Inc. (NYSE:HIW) because, from where I site (in South Carolina), nothing could be finer than a REIT in Carolina!
HIW, headquartered in Raleigh, NC, is an internally managed office REIT that owns, develops, acquires, leases and manages properties primarily in the best business districts of Atlanta, Charlotte, Dallas, Nashville, Orlando, Raleigh, Richmond and Tampa.
HIW IR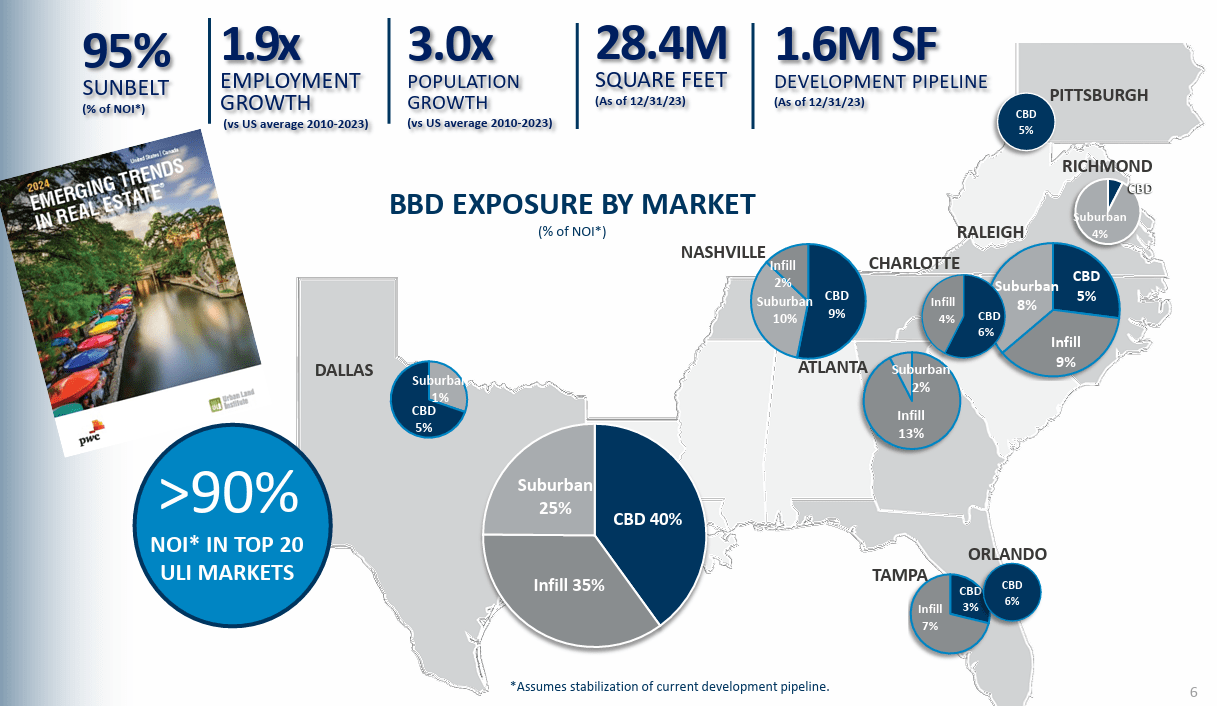
As you can see, around 95% of the portfolio is located in “Sunbelt” markets that enjoy strong employment and population growth.
The 28.4 million square foot portfolio has an average occupancy of 88.9% (Sunbelt portfolio is 95% occupied) with 4.1% rent CAGR. In addition, the portfolio has an average age of 20 years (2004) with a WALT (weighted average lease term) of 5.6 years.
HIW IR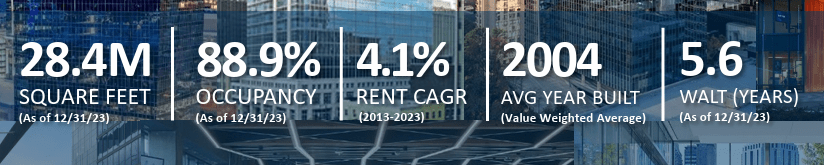
As shown below, Raleigh, Nashville, Atlanta, Charlotte and Tampa are HIW’s largest markets, followed by Dallas, Orlando, Pittsburgh, and Richmond.
HIW IR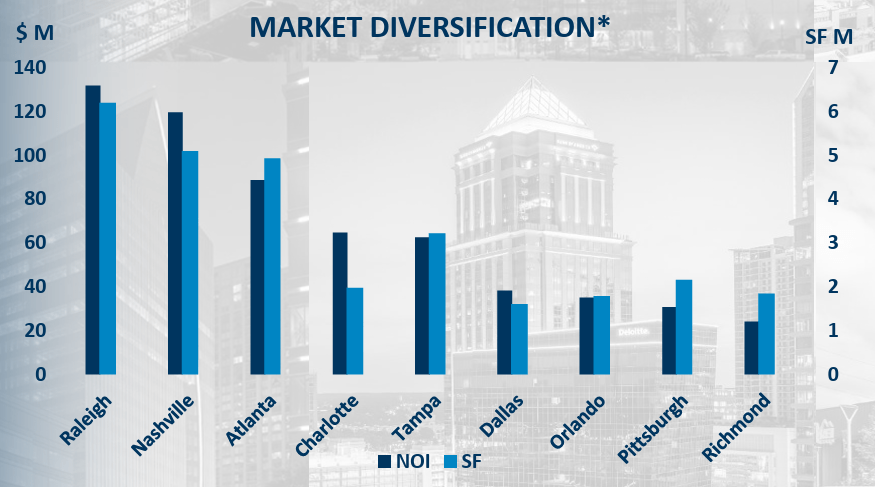
The portfolio consists of these sectors:
Here are the top tenants, and as you can see there is no WeWork exposure throughout the entire portfolio and < 1% of total revenues derived from co-working.
HIW IR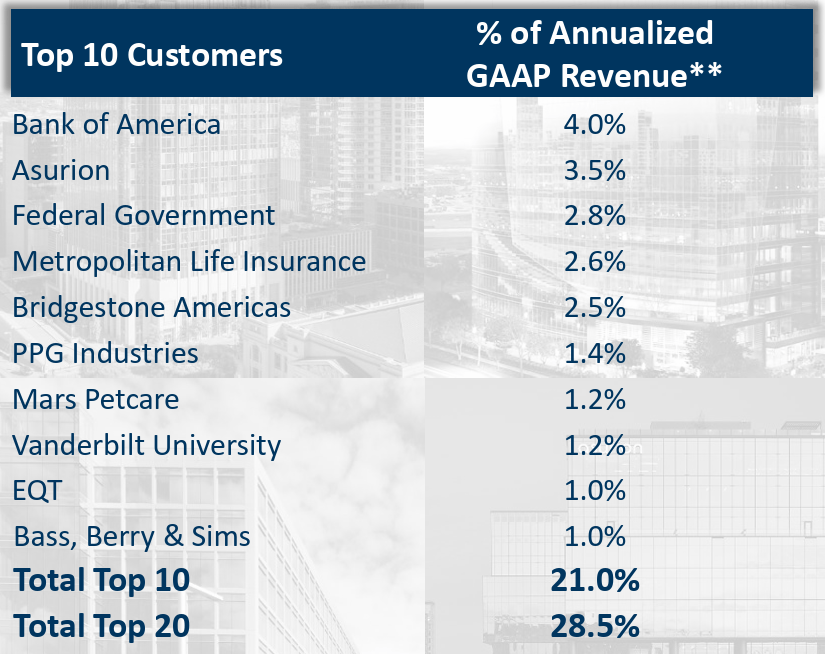
HIW has maintained one of the strongest balance sheets in the office REIT sector, as evidenced by Moody’s affirmation of the Baa2 rating with a stable outlook.
This is highlighted by the fact that HIW raised $350 million of 10-year bonds with strong support from a broad group of fixed income investors and nearly raised $600 million of debt capital during 2023.
In addition, the company extended its $750 million credit facility into 2029, with no change to the size or the borrowing spread. The company now has no consolidated debt maturities until May 2026 and over $900 million of available liquidity.
HIW IR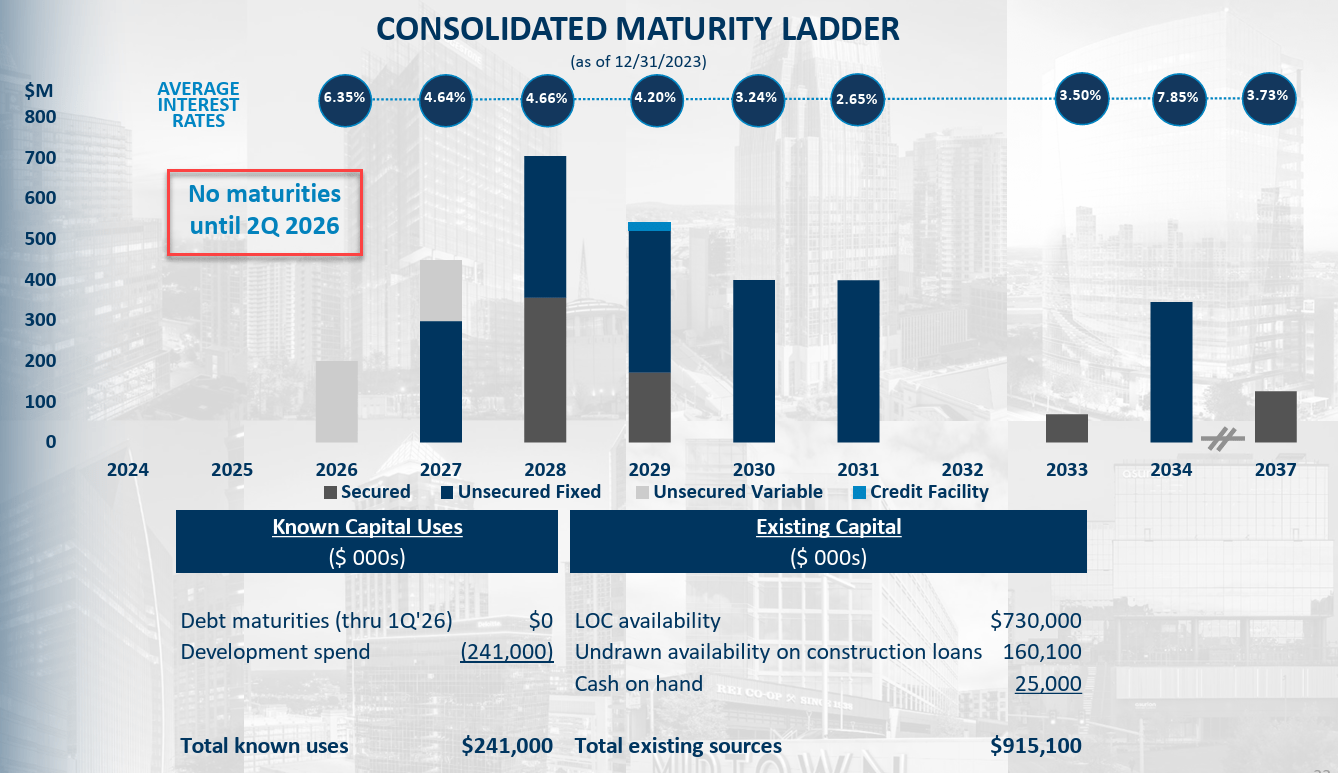
Other solid debt metrics include:
Also, HIW has less than $250 million of capital left to complete its 1.46 mm SF development pipeline.
HIW IR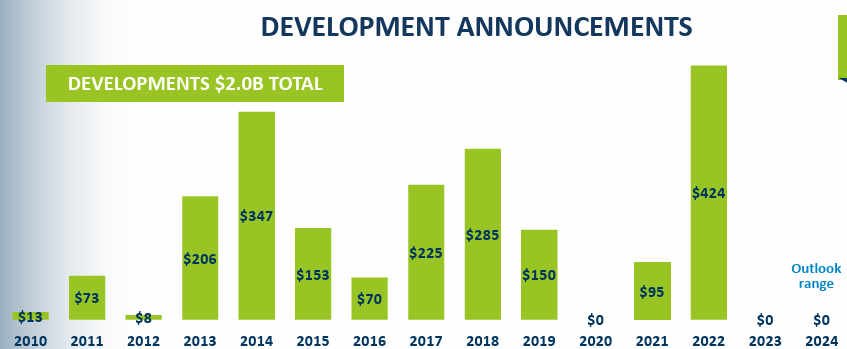
Having been a developer myself for over two decades, I enjoy researching REITs that create value from the ground up.
As you can see below, HIW’s development pipeline consists of six properties that should generate $40 million of stabilized GAAP NOI, which translates into a cap rate of 8%.
HIW IR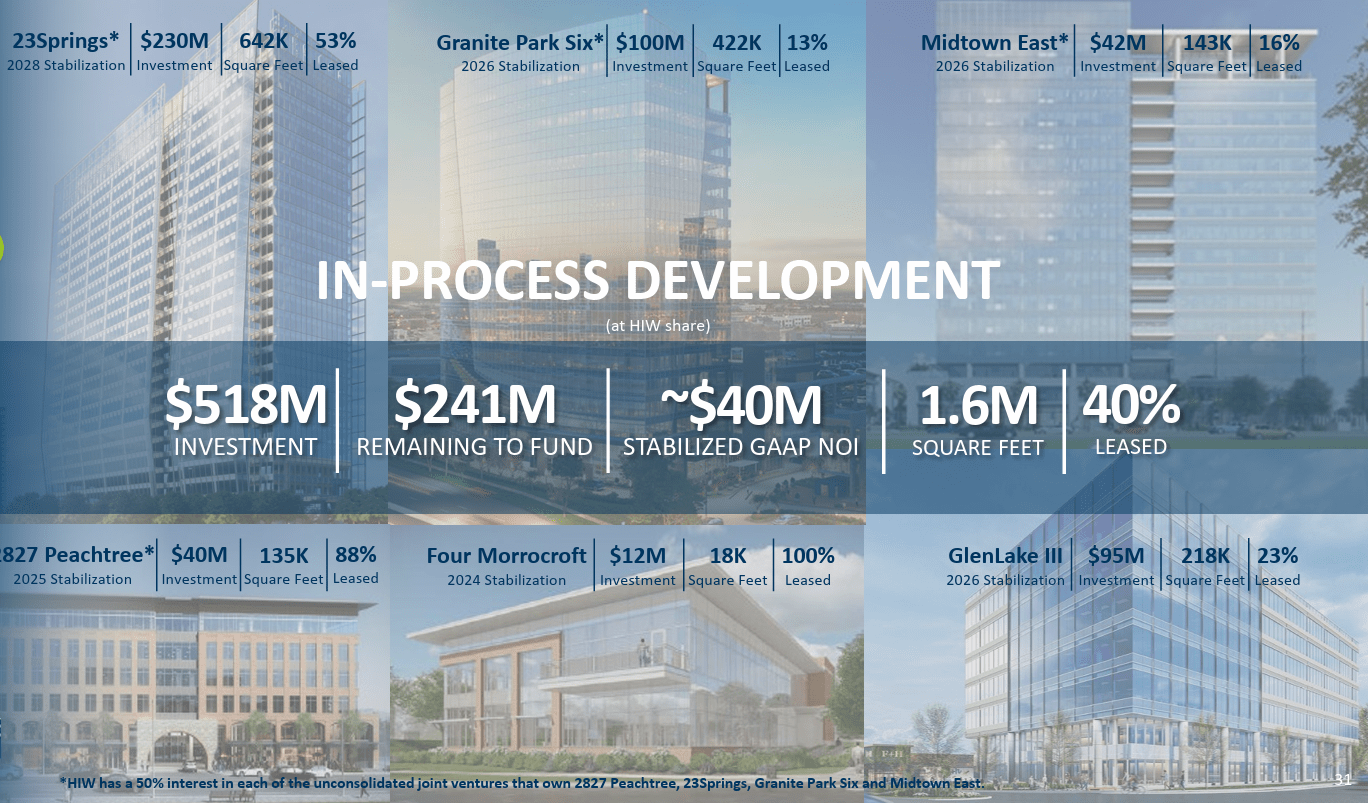
In addition to development, HIW has a healthy land bank that could result in over $3.7 billion of build-out over the next several years.
HIW IR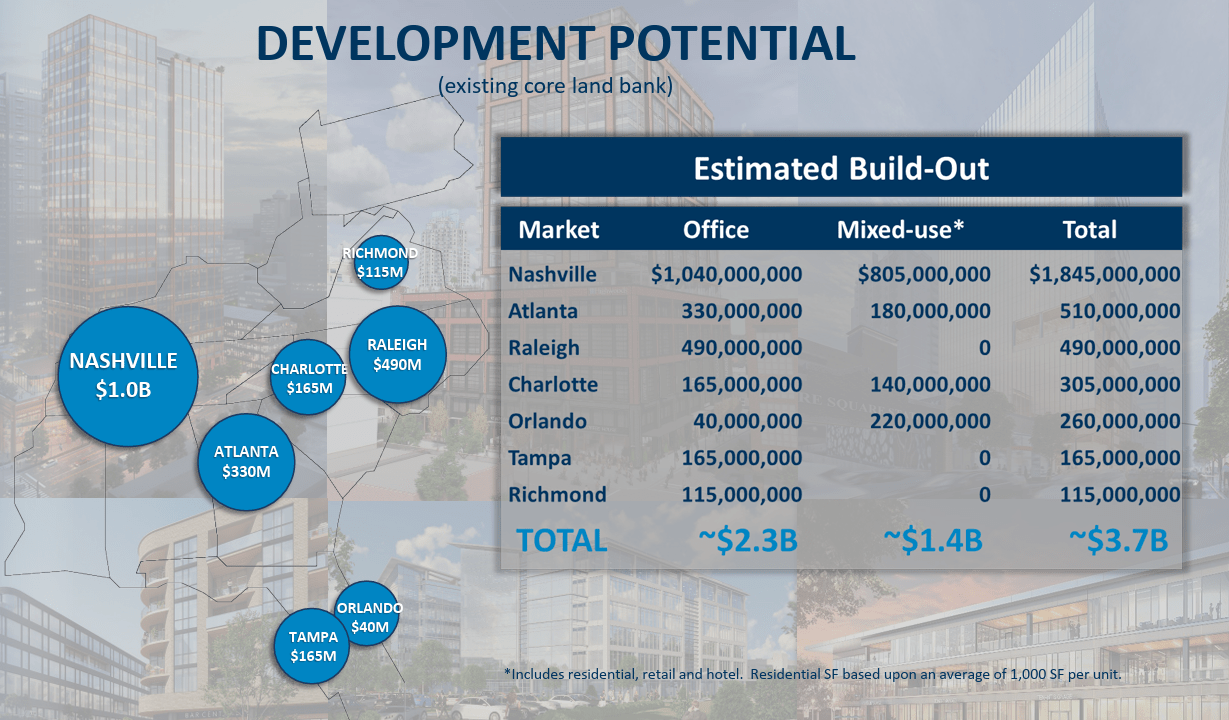
One of the key differentiators for HIW is capital markets discipline. HIW is the ONLY office REIT that did not cut its dividend in 2008-2009:
iREIT®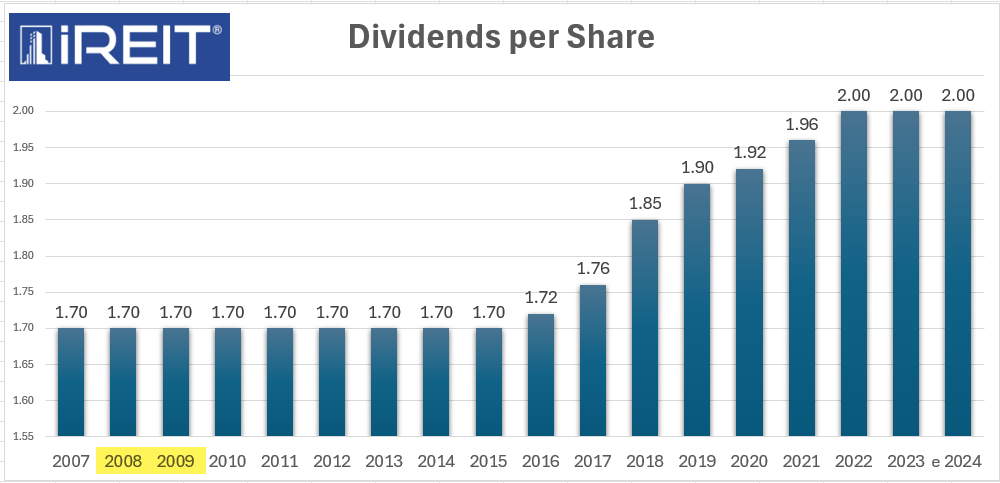
Of course, the reason that HIW did not cut its dividend is because of its disciplined balance sheet. As seen below, HIW maintained a conservative payout ratio (using AFFO/sh) in 2008 and 2009.
iREIT®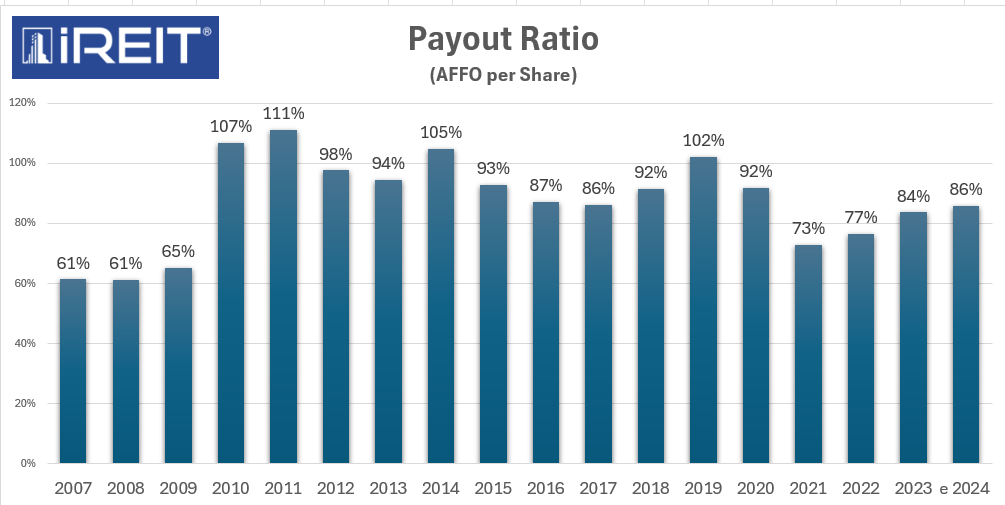
As you can see (above), the payout ratio was over 100% in 2010 and 2011 and has averaged over 90% from 2010-2020. As shown below, HIW began to generate more earnings post-COVID and based on analysts’ estimates should generate around $2.33 per share in 2024.
iREIT®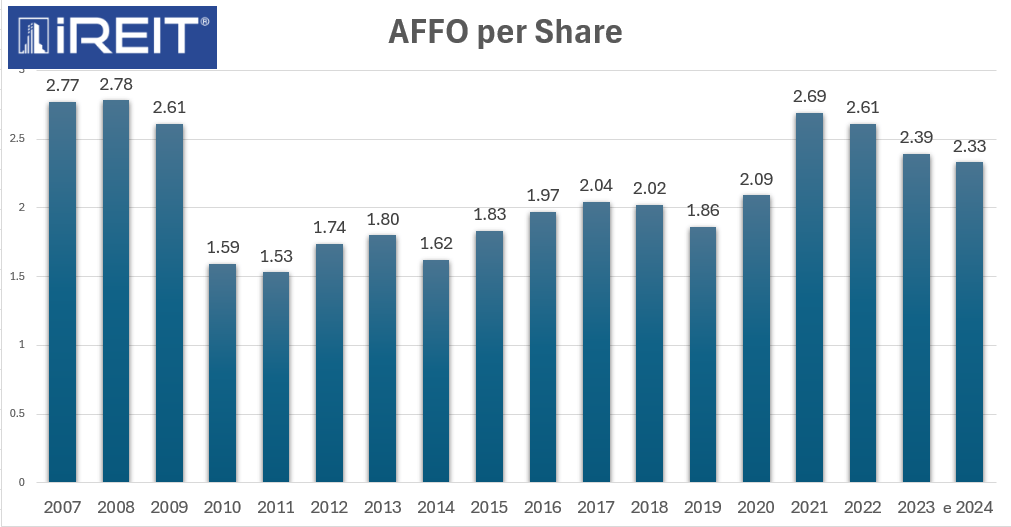
Using that data point ($2.33 in AFFO) and 2025 consensus of $2.22, HIW is likely to stay under a 100% payout ratio in 2024 and 2025. Once again, HIW did not cut the dividend during the Great Recession of the Global Pandemic.
iREIT®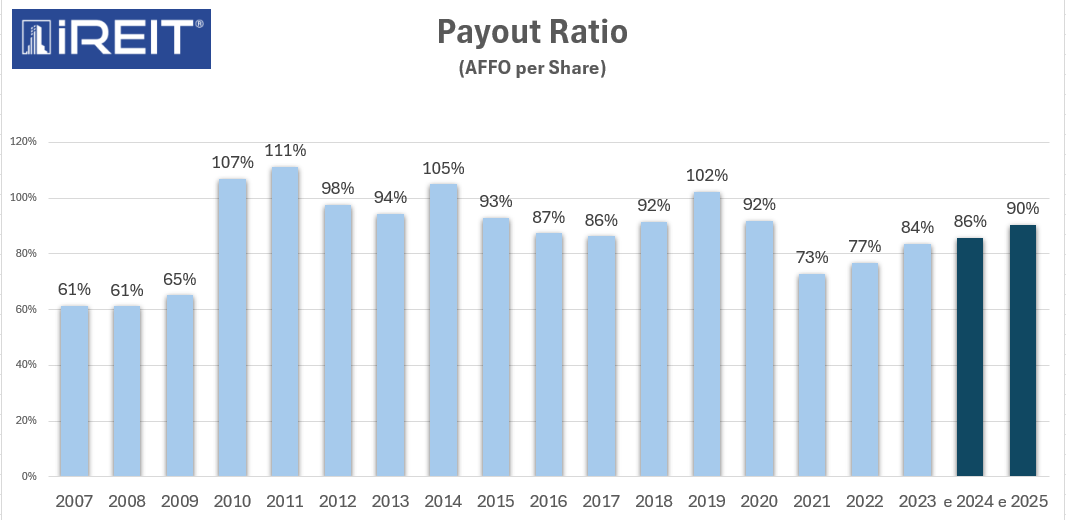
There are four analysts that provided estimates for 2026, and the average forecast is $2.37 per share. This translates into +7% growth over 2025.
HIW IR
Here’s what HIW CEO, Ted Klinck said about the dividend on the latest earnings call:
“…it's something we talk about virtually every quarter with the Board. As we look at our dividend, it is covered by our cash flow. And we think the dividend is an important part of total return for us. So -- and we've been pretty proactive the last few years with respect to our CapEx spend and our cash flows have been improving. So based on the outlook that we see for the business, we feel very comfortable with the dividend at this time.”
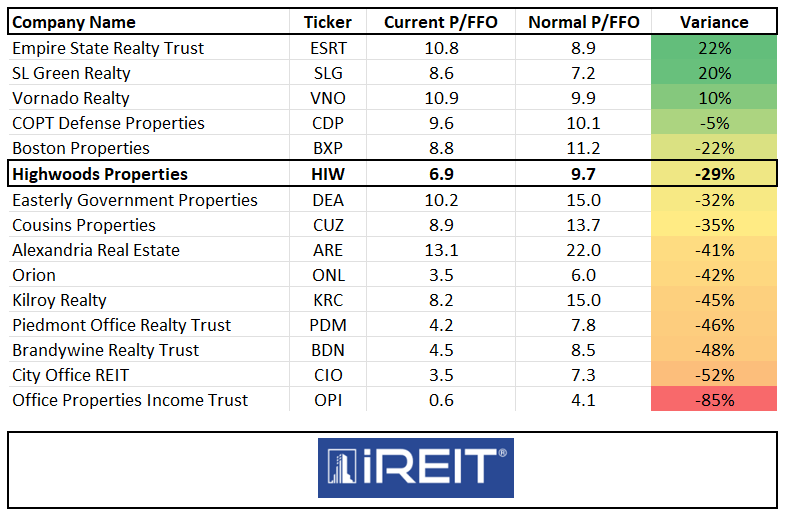
As you can see below, HIW now trades at 10.3x P/AFFO compared with the normal multiple of 19.1x.
In 2008 HIW traded as low as 6.1x. What I find interesting is that HOW traded above 19x during the period in which the payout ratio was much higher than it is today.
FAST Graphs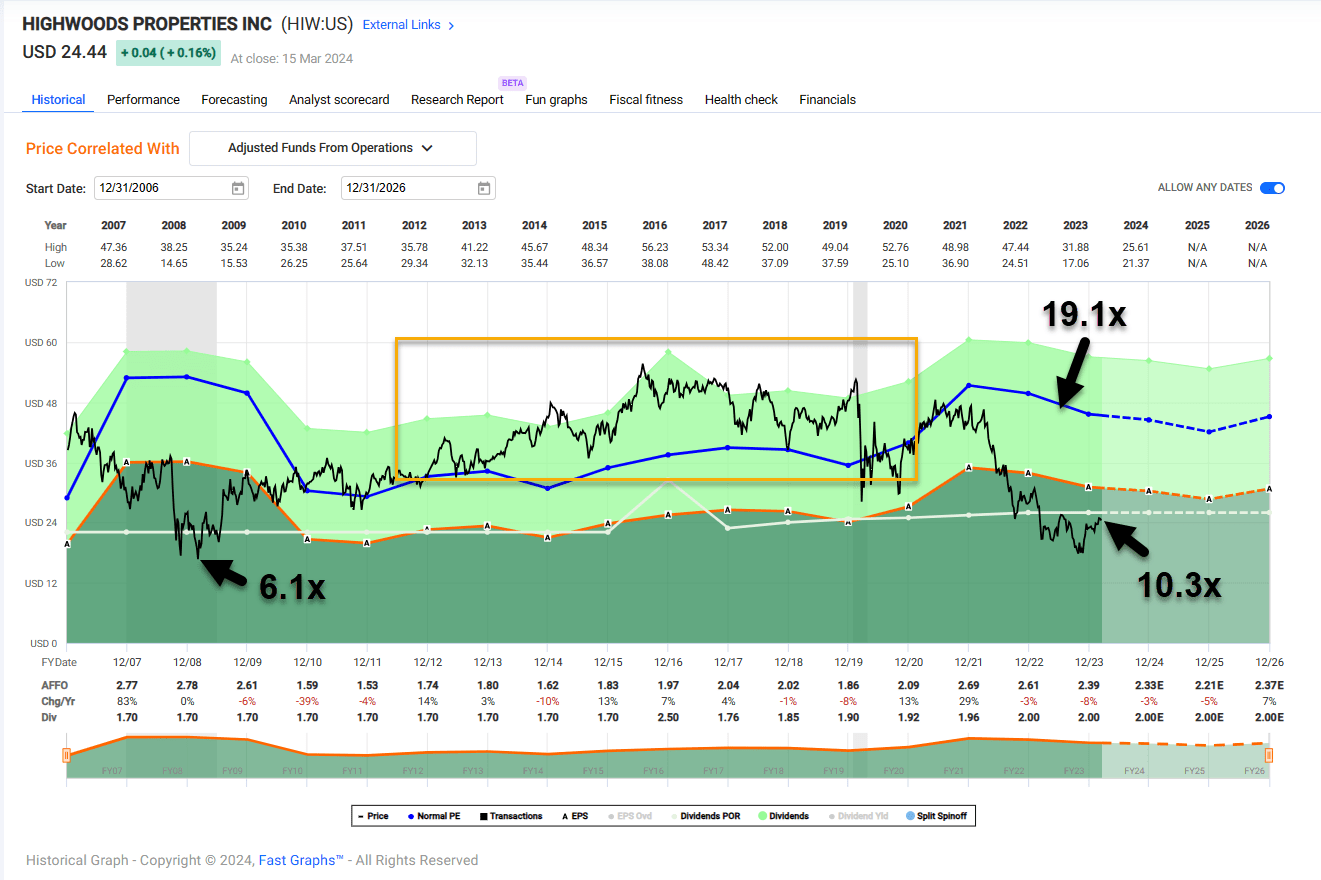
What this tells me is that HIW is trading at a sizeable discount, as Mr. Market does not know the difference between a “Sunbelt” REIT and a NYC REIT. The current dividend yield is 8.2% which is covered by earnings (AFFO/sh). Mid-point occupancy for 2024 is 88%.
HIW IR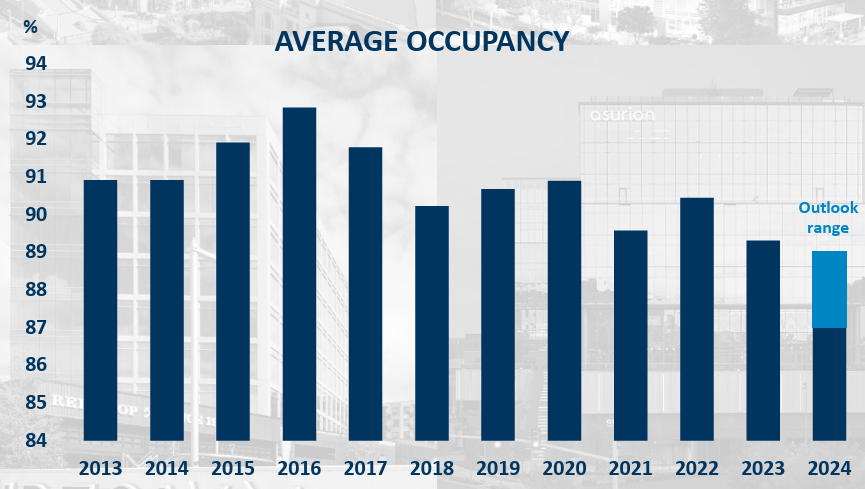
Occupancy is also higher than most office REIT peers:
HIW IR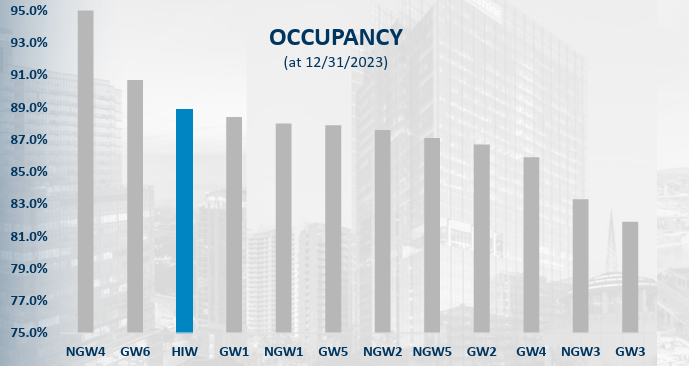
All things considered, we are maintaining a STRONG BUY on HIW, as we believe shares could return 25% annually over the next two years.
FAST Graphs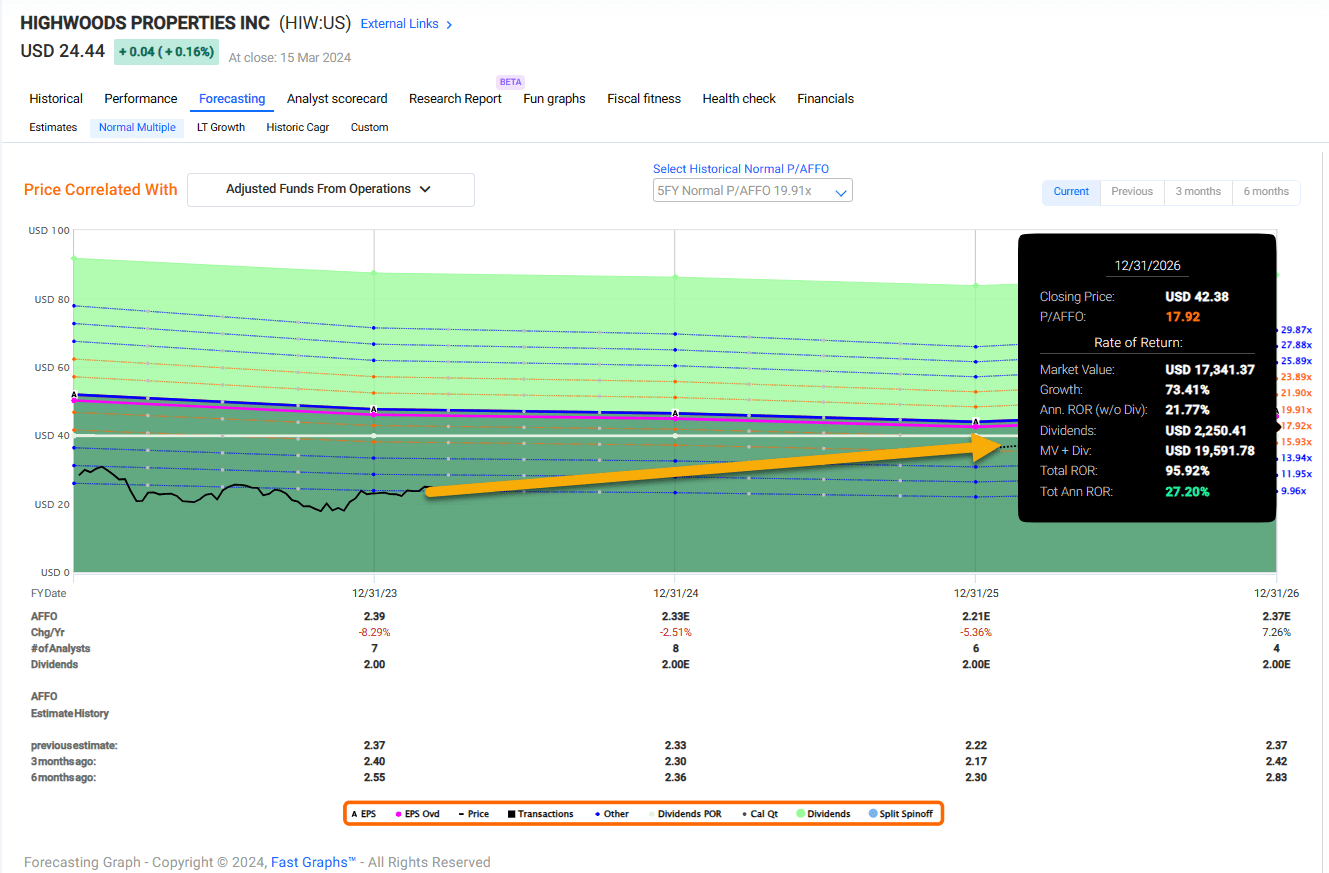
(I hope you're enjoying our new "data duel" feature. Let us know your feedback, please. Thank you)
iREIT® iREIT® iREIT® iREIT® iREIT® iREIT®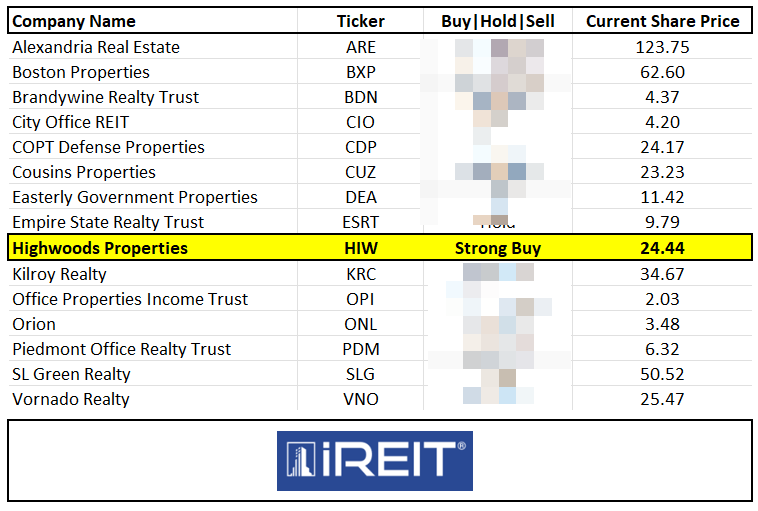
That's all folks!