manassanant pamai
manassanant pamai
Gold spot prices (XAUUSD) have accelerated upward as speculation about where interest rates will go has intensified. Rate cuts have historically been good for gold in recent cycles and all eyes have been on the Federal Reserve. On Wednesday the Federal Reserve decided to maintain interest rates and reiterated their call for patience, but left the door open for rate cuts later in the year. The market overall including gold liked the outcome, with gold (XAUUSD:CUR) jumping almost $50/oz.
In this article, I intend to prove that gold is not necessarily the great inflation hedge that it is made out to be. Instead, I propose that gold's price is dependent on two factors: near-term economic outlook including market tinkering by the Federal Reserve, and structural supply and demand. To support my thesis, I will cover gold's historical price relation to CPI inflation, how gold behaves during rate hiking and cutting cycles, and how structural supply and demand dynamics ultimately set the base price. I am a gold bull, but not for the reasons usually cited for investing in gold.
From November to the end of February, gold prices floated between $2000/oz and $2050/oz. Since the end of February, spot gold prices (XAUUSD:CUR) have increased sharply. Spot prices have retaken their all-time high at $2203/oz as I write this article (3/20/2024) following a fairly dovish FOMC meeting presentation by Jerome Powell.
Gold price vs CPI from 1978 to present (World Gold Council, St. Louis Fred, chart by Author)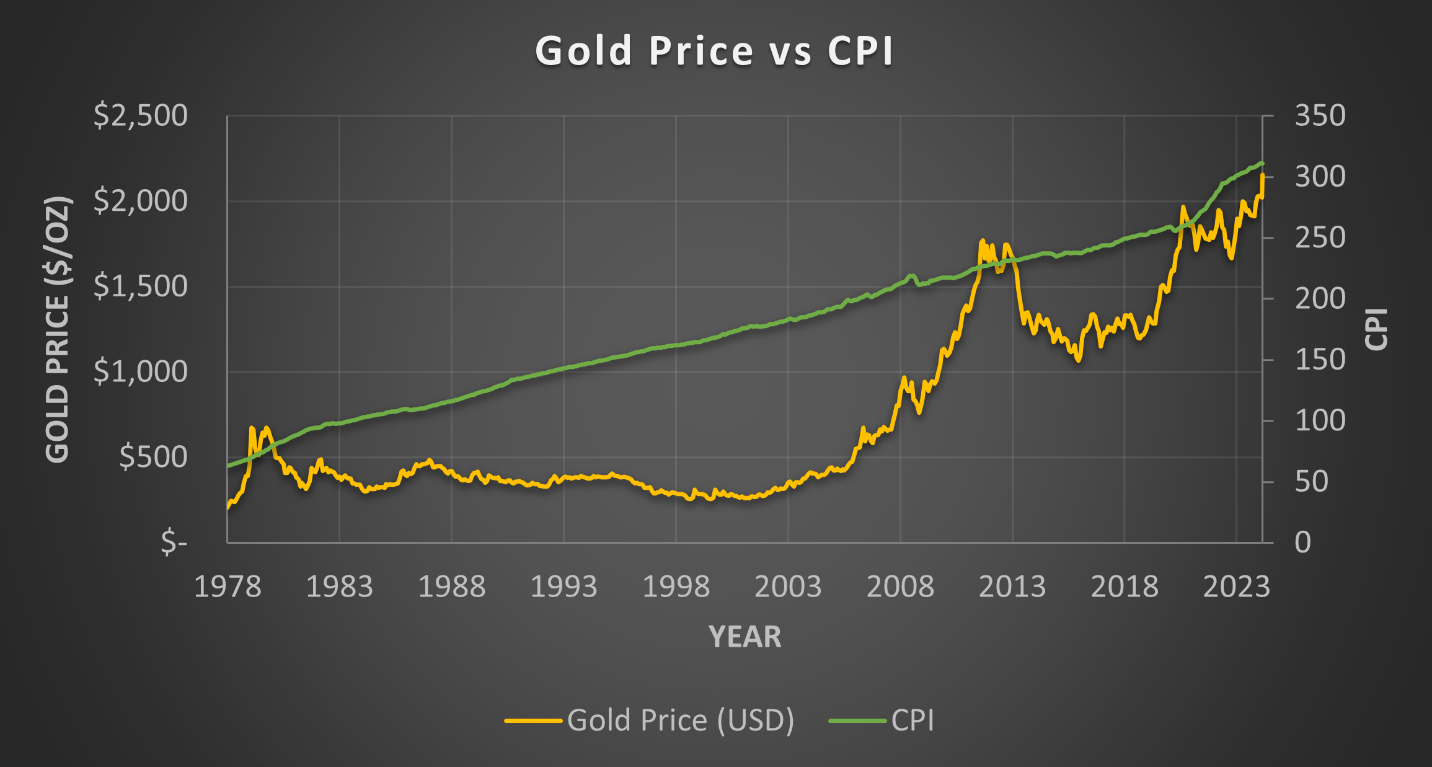
Economic data surrounding the US economy has been inconsistent and confusing, to say the least. The ISM manufacturing report continued to show weakness, as did the Kansas City Fed manufacturing survey, and the Empire State manufacturing survey. Conversely, the Atlanta Fed GDP Now estimate predicts the US economy will grow at a rate of 2.3% annualized, which is well ahead of estimates for other advanced economies. Inflation has also ticked back up with CPI increasing 0.3% in January and 0.4% in February. Not to be outdone, PPI increased 0.3% in January and 0.6% in February.
Inflationary pressures are likely to persist because the federal government continues to rack up debt. So far, fiscal 2024 (Oct 23 through Sept 24) has seen the second fastest rate of debt accumulation. Based on Biden's proposed $7.3 trillion budget for 2025 despite the treasury only bringing in $4.44 trillion in 2023 (a $2.86 trillion discrepancy), I expect the debt to continue to balloon and inflation to persist.
US federal government deficit (Bipartisan Policy Center)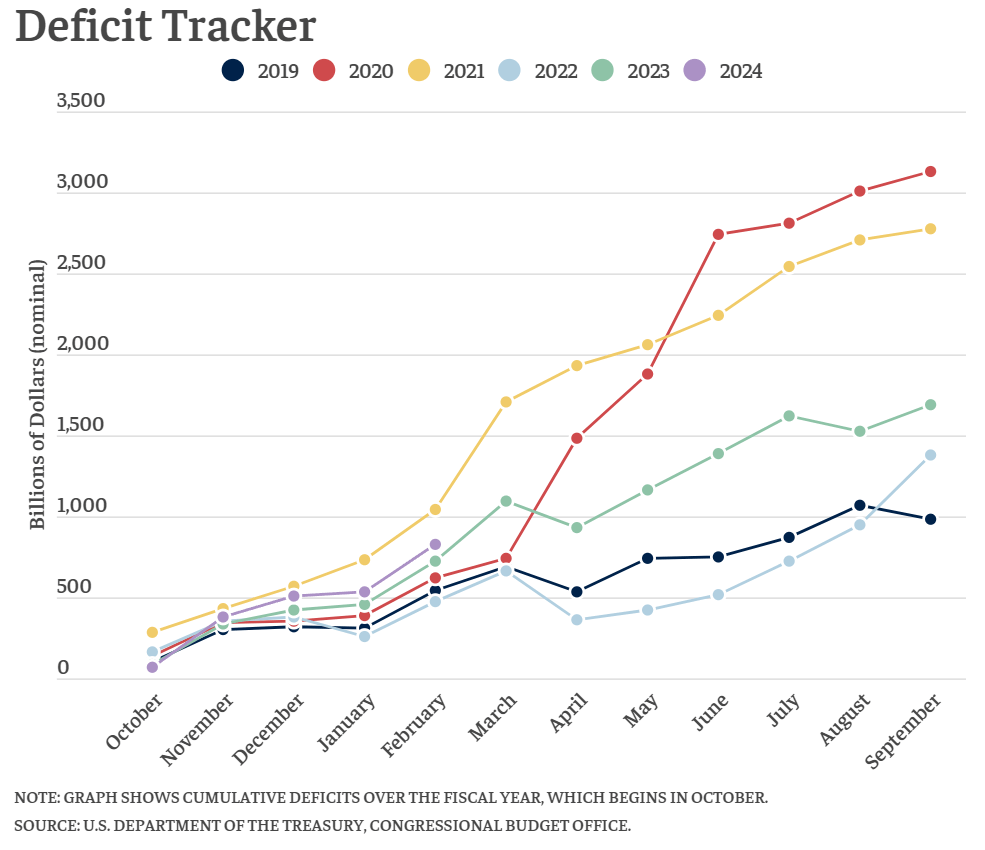
With inflation data coming in hotter than expected and the US economy remaining strong - at least on the top line - the prospects of a rate cut have dropped substantially. In his testimony before Congress, Jerome Powell pushed back on the notion of cutting rates soon. At the FOMC meeting on Wednesday, Powell said the Fed was willing to maintain rates for longer to ensure inflation goes down, but he does expect rate cuts to begin sometime this year. He also discussed reducing the rate of quantitative tightening and indicated that this will likely be the topic of the next FOMC meeting. In the new Summary of Economic Projections (SEP) the Fed maintained its 3 rate cut median expectation (4.6% Fed Funds rate at the end of the year), but the average expected rate increased to 4.8%, which is only 2 rate cuts. The largest surprise in the SEP was the increase in expected GDP growth for the year, which increased to 2.1%, which aligns with the Atlanta Fed GDP Now estimate. Based on the Fed's insistence on patience and hotter inflation reads it is possible the Fed will cut rates fewer than 3 times this year, and potentially not at all. As far as rate cut timing is concerned, there are 2 FOMC meetings after the presidential election. I would not be surprised if the Fed waits until after the election before making the first rate cut to avoid the appearance of bias.
Returning to gold, 2024 is an all-time high in nominal dollars, but it is not the true all-time high. When adjusted for inflation, gold prices peaked in February of 1979 at $3000/oz. Gold prices were also effectively higher between 2011 to 2013, and late 2020 to early 2021.
Gold is often touted as an inflation hedge, but the graph below shows that this is not the case. If gold were truly an inflation hedge, then its price should change with inflation. The inflation-adjusted gold price would therefore be a roughly flat line where all prior prices, adjusted for inflation, would equal the present price. However, gold prices on an inflation-adjusted basis have varied from a low of $500/oz to a high of $3000/oz. This deviation implies that gold should be seen like any other demand-driven commodity rather than as an inflation-protected asset. Later in this article, I will cover why gold is poised for structurally higher prices over the coming decade or longer.
Inflation adjusted gold price in Feb. 2024 dollars (World Gold Council, St. Louis Fred, chart by Author)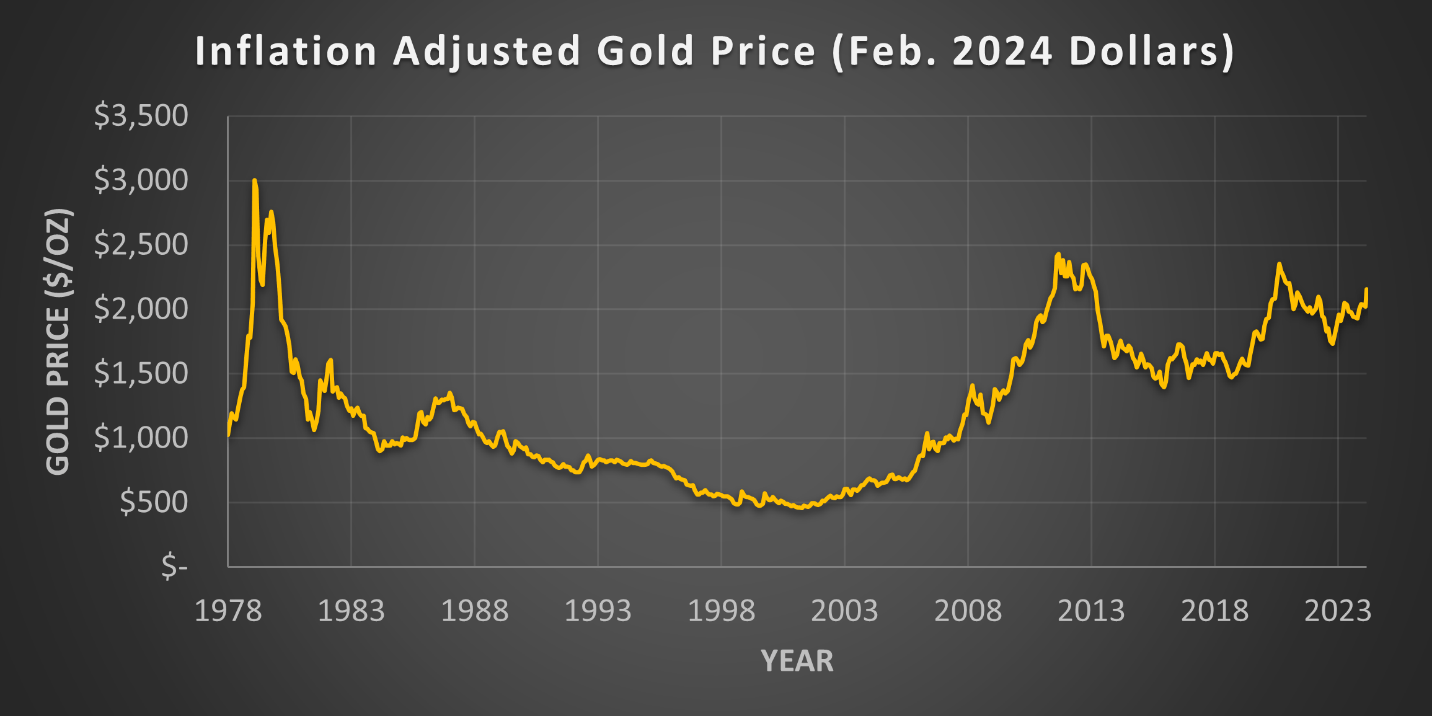
Gold prices tend to move the most during economic uncertainty. Despite my claim that gold is not a good asset for inflation protection based on the data, its reputation as a secure asset has persisted for millennia. Because of this widely held belief, gold tends to have step changes in price around recessions before falling back to structural support during the following expansion.
To examine the role that recessions and the Federal Reserve have on gold prices I am presenting 4 charts. The first shows the nominal gold price from 1978 to present vs the Federal Funds Rate (the rate the Fed pays depositors). The second through fourth charts show enlarged sections of the first chart for better viewing and ensuing discussion. Pay attention to the trajectory of gold prices when the Federal Reserve started increasing interest rates.
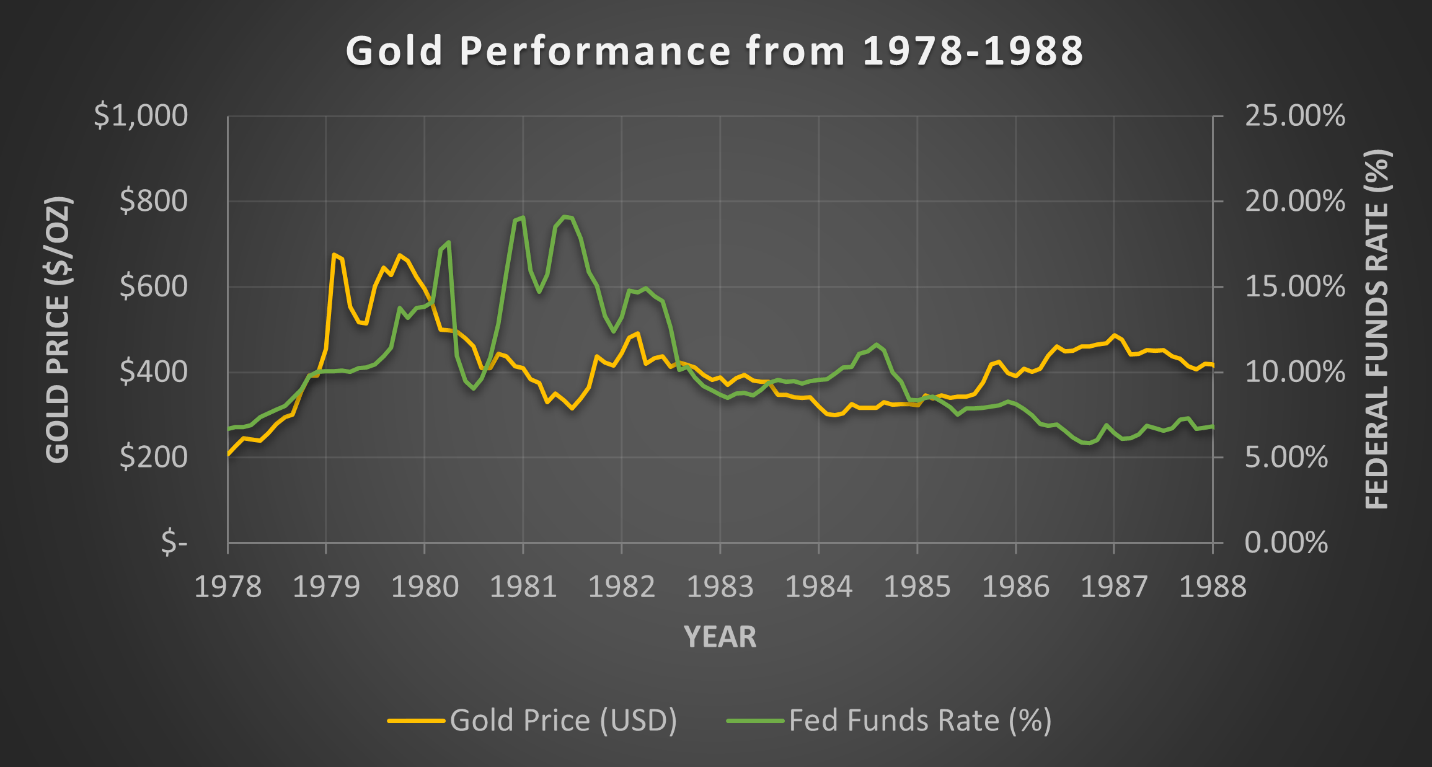
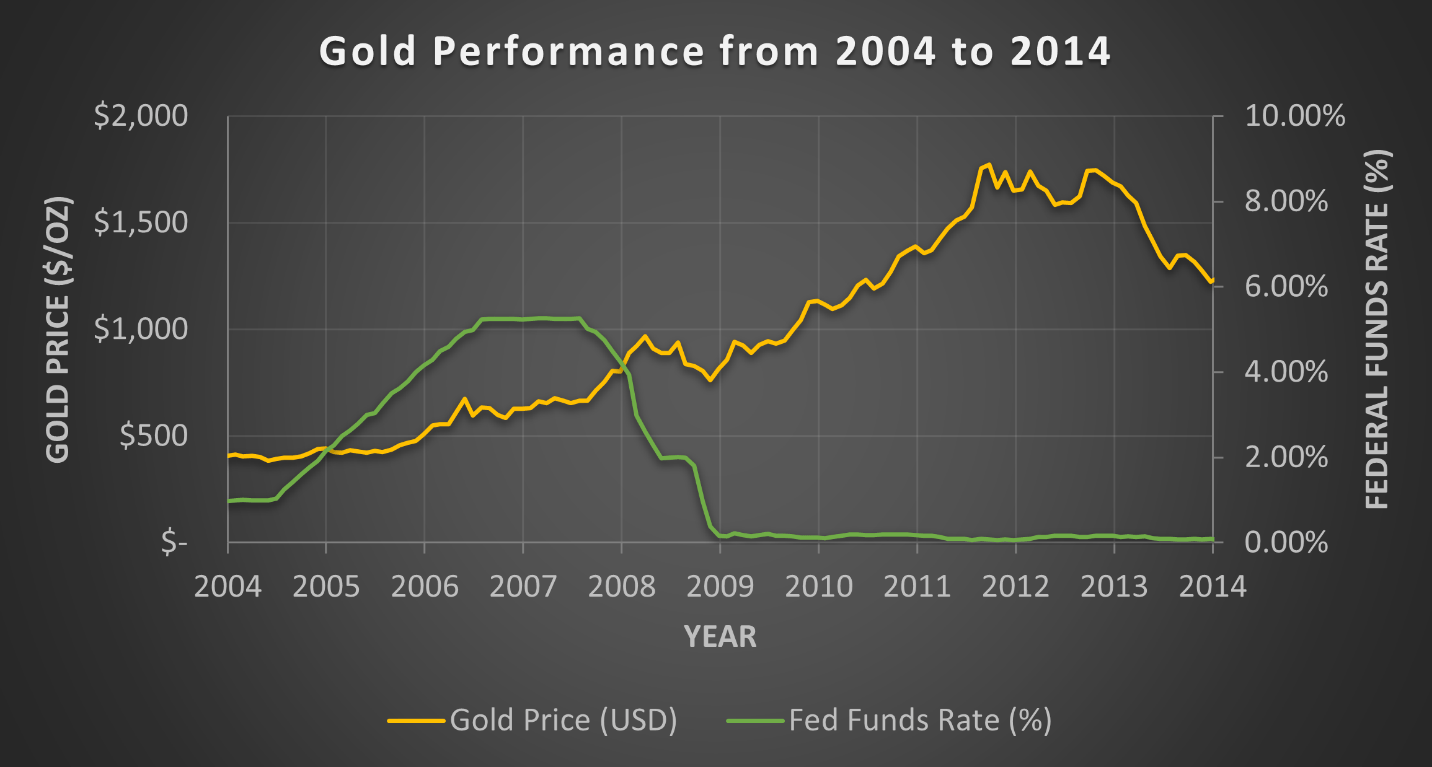
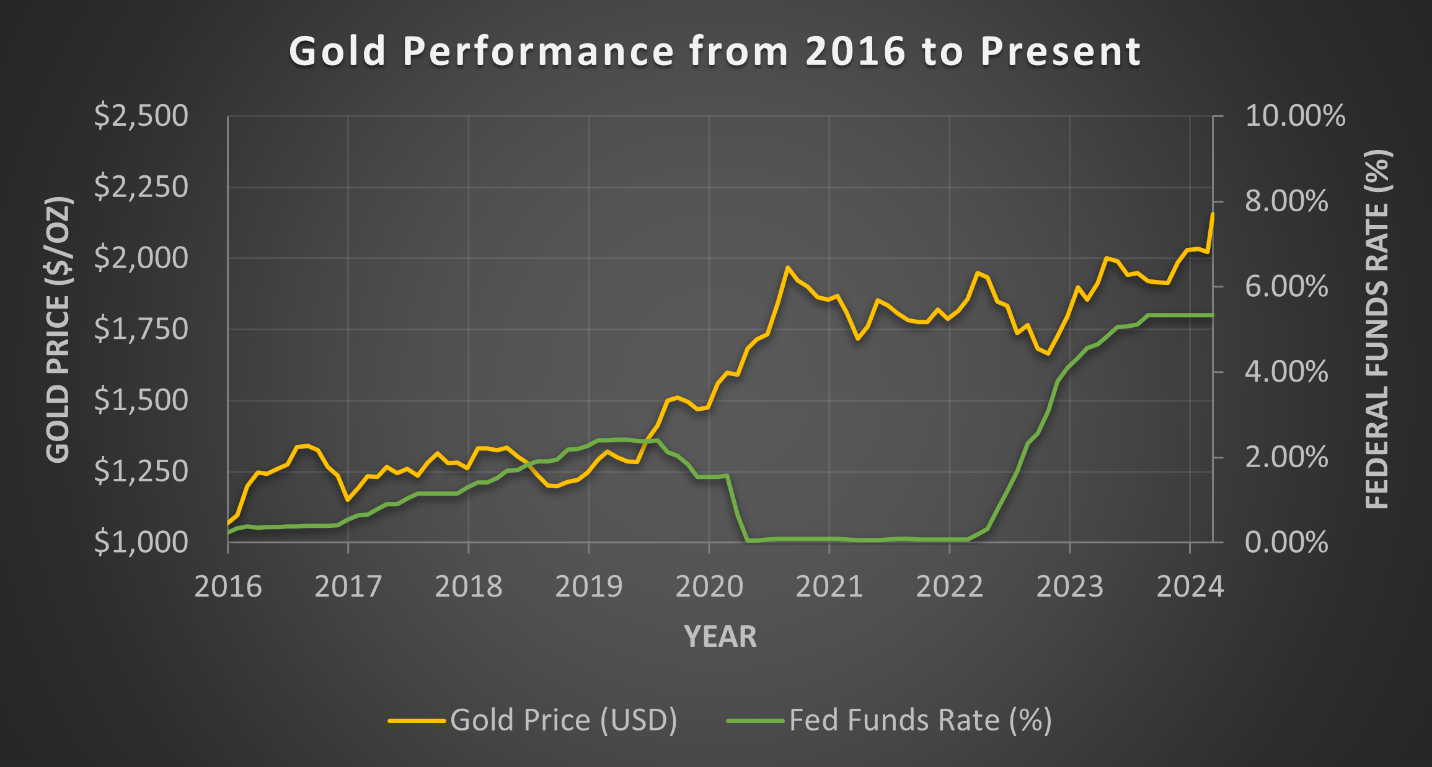
Gold price vs. federal funds rate from 1978 to present (World Gold Council, St. Louis Fred, chart by Author) Gold's performance from 1978 to 1988 (World Gold Council, St. Louis Fred, chart by Author) Gold's performance from 2004 to 2014 (World Gold Council, St. Louis Fred, chart by Author) Gold's performance from 2017 to present (World Gold Council, St. Louis Fred, chart by Author)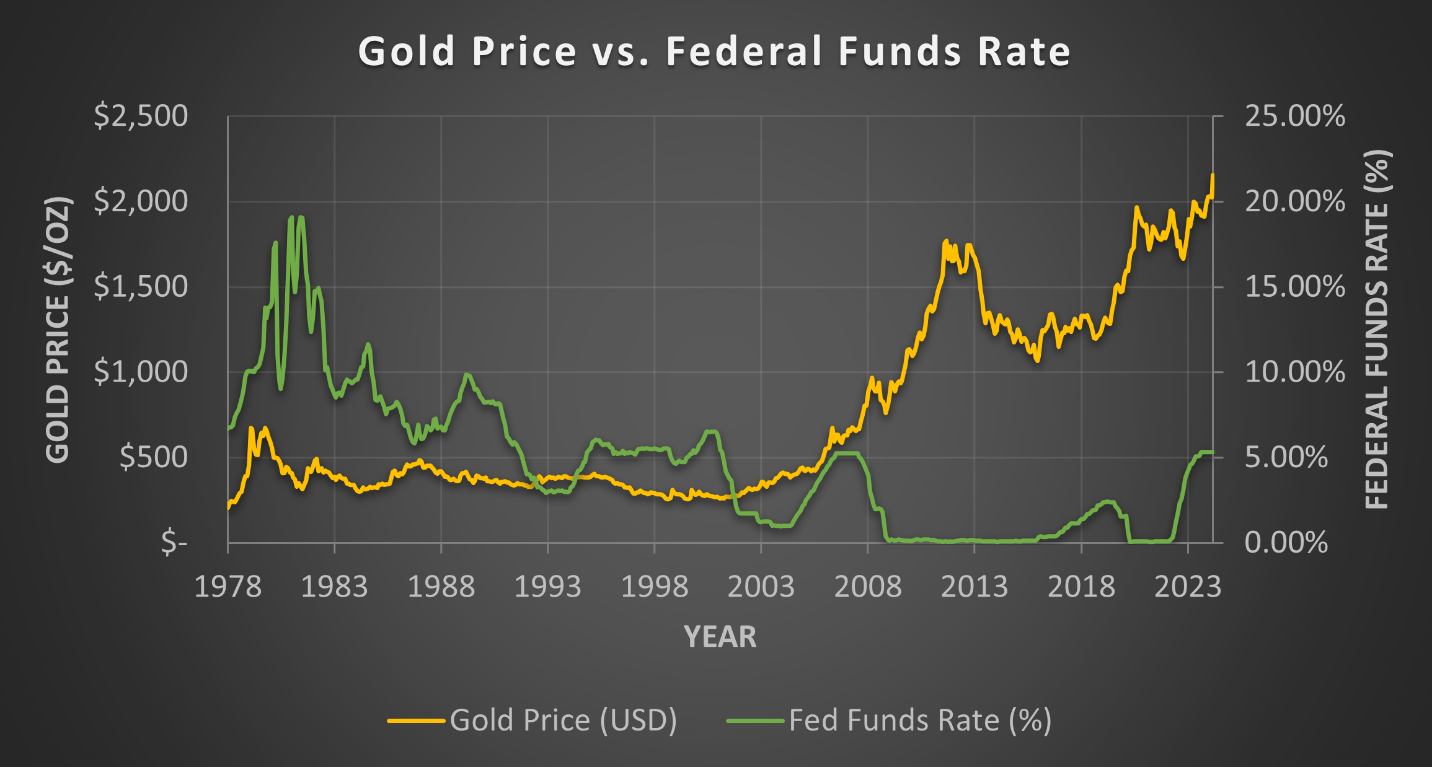
Analyzing this data I identified three trends (bullish, neutral, and bearish) that point towards future gold prices based on the behavior during Fed rate hiking.
In the bullish trend (seen between 2005 to 2007, 2016 to 2019, and 2022 to 2023) gold prices rise while the Fed Funds Rate increases. Once the Fed begins to slash rates, gold prices climb even higher and at a faster rate than they did during the rate hiking. From the start of rate cuts in 2007 to the peak gold price in 2011, gold prices rose 166% for a 27% CAGR. From the start of rate cuts in 2019 to the start of rate hikes in 2022, gold prices rose 50% for a 14.5% CAGR.
In the neutral trend (seen from the mid-1980s through 2003) gold prices were uncorrelated with the Federal Funds Rate. The 1990-91 recession nor the dot-com recession in 2001 can be seen in the price of gold. During this period, investors did not use gold as a flight to safety during recessions, and the structural demand for gold matched supply resulting in flat prices for almost 20 years.
In the bearish trend, gold prices fall as the Fed hikes interest rates, and the decline continues once cuts are made. This occurred during the late 1970's through mid-1980's. The US left the gold standard in 1971 and by 1980, inflation had exceeded 13%. Gold prices reached their inflation adjusted all-time high in 1979 before crashing down in both nominal and inflation adjusted terms as Paul Volcker crushed inflation by drastically increasing rates.
When looking at these patterns, we can observe the bullish trend currently at play. As the Fed hiked rates from 2022 through 2023 the price of gold rose, and it has continued to rise as rates remain elevated. It is also worth noting that the type of pattern has changed over time. The negative pattern occurred the longest time ago (1980) followed by 20 years of the neutral pattern, and finally 20 years of the bullish pattern.
The ownership trends in gold have diverged over the past year. Retail investors have been selling gold as the price has risen. Conversely, central banks located predominately in emerging markets have been adding to their gold reserves. The largest buyer of gold has been the Peoples Bank of China which has steadily increased its gold reserves for 16 months and shows no signs of slowing down. Their gold reserves are currently valued at just over 4.3% of their total official reserves. Central bank purchases of gold are supported by the continuing trend towards de-dollarization in emerging market countries. Gold has the benefit of not being sanctionable, giving these countries more latitude to ignore US and EU demands.
Global gold demand by end use (World Gold Council, chart by Author)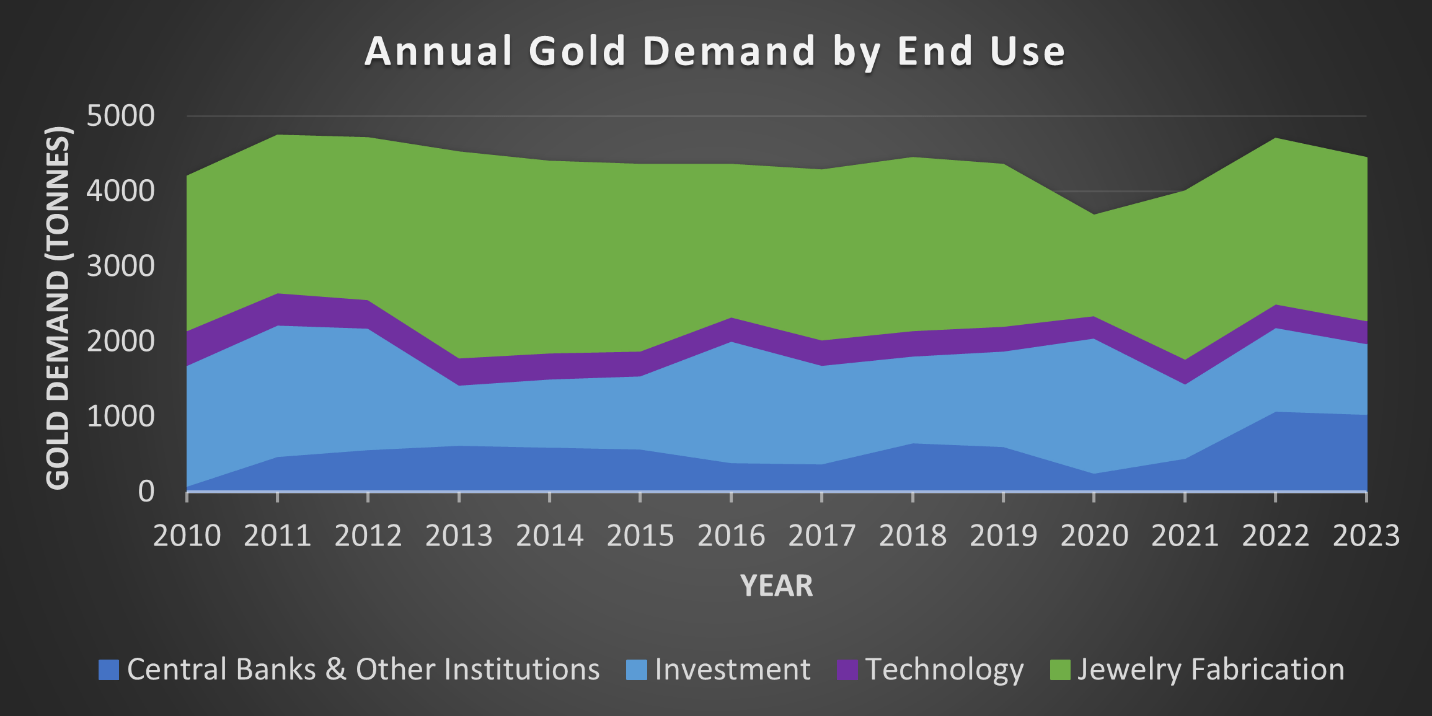
Retail's declining gold demand is most evident in the total gold holdings of ETFs globally. Compiled by the World Gold Council, the total amount of gold held by ETFs has declined every month since May of 2023. This is historically abnormal because ETF holdings usually track the price of gold. The largest declines have been in US and EU based ETFs while Asian funds have grown but remain small. The production of jewelry has remained steady and even increased in China. The Shanghai Gold Exchange set a new record in January, with demand driven by the Chinese New Year holiday. Retail demand for gold in China has also been supported by weakness in the housing sector and poor stock market performance leading households to seek a safer place to invest.
Global gold ETF holdings by region vs gold price (World Gold Council, chart by Author)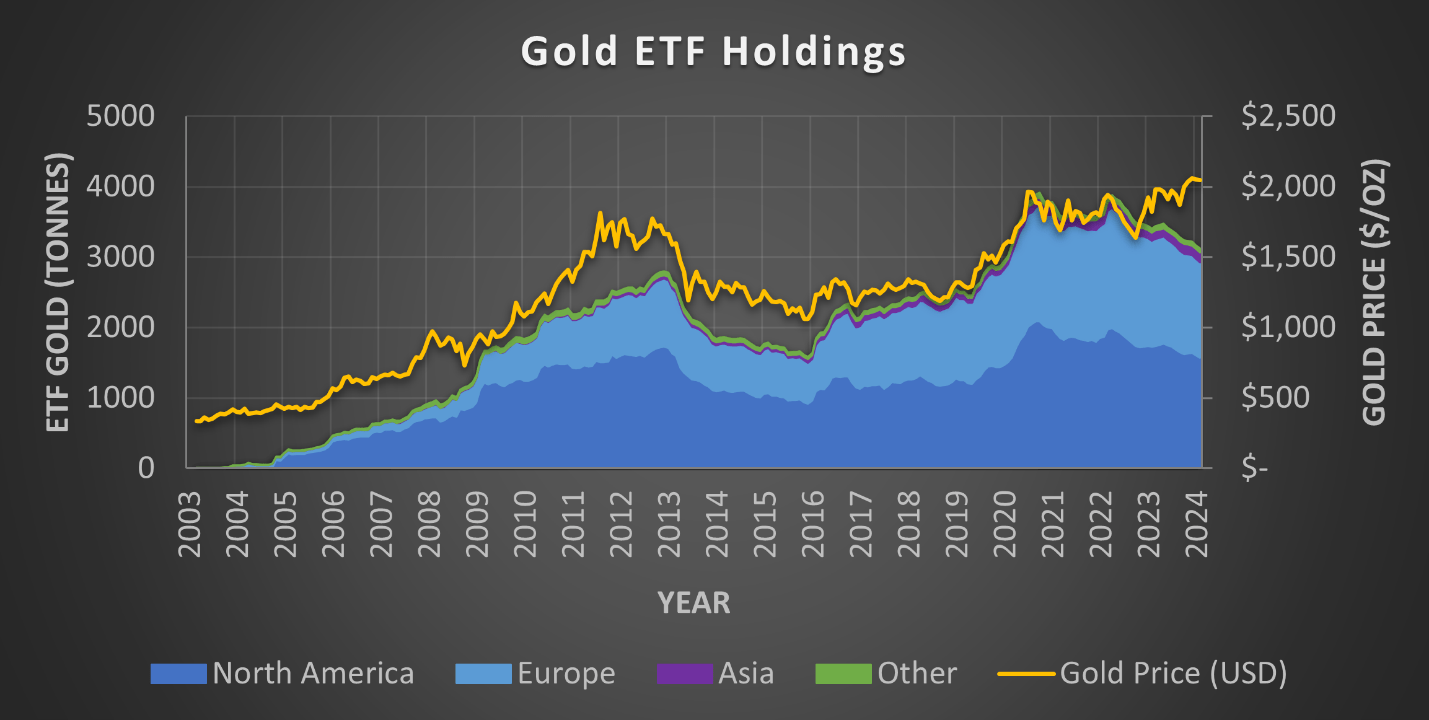
There are two common theories floating around for why gold has been selling off in advanced economies despite the rising prices. The first implies that investors have been selling gold to buy tech stocks and chase AI hype. The second theory is that rising bitcoin (BTC-USD) prices and the introduction of bitcoin ETFs have led some investors to move their money, but JP Morgan analysts disagree because they have seen net purchases of bitcoin and gold by their clients. I could see the transition to tech stocks being a plausible reason for the drawdown because May of 2023 is when Nvidia (NVDA) started to take off, but transfers to bitcoin seem unlikely.
For any investors considering bitcoin instead of gold, they are not the same, and bitcoin is not the new gold. Despite Michael Saylor's comments to the contrary, that Bitcoin will "eat" gold, they are two completely different asset classes; in reality Bitcoin is highly correlated with the NASDAQ-100.
Gold mining is a tough industry to be in. New mines have long lead times, typically around 20 years from discovery to the first bar, and getting regulatory approval in safe jurisdictions is becoming increasingly difficult. Getting permits for a new mine in a Western country is exceptionally challenging and certain to be challenged by environmentalists. Australia and Canada are the only mining-friendly Western countries, and they have seen continued mine development. As a result of restrictions, miners have been pushed to search for new deposits in less safe regions of Africa, Asia, and South America where the governments are willing to allow new mines, but these sites come with significant political risks.
Another challenge facing gold mining companies is a lack of investment. Despite the run-up in gold prices, you wouldn't know it if you only looked at gold equities. Gold miners have adjusted their strategy to focus more on brownfield development and maximizing short-term shareholder returns (which have not been very great despite being the focus) because they have not been rewarded for the long-term risks associated with new mine development. Mergers have been the primary way to acquire more production and reserves, with Newmont's (NEM) takeover of Newcrest being the latest example. Mergers like this ultimately have no impact on the gold market and underlying reserves because no new supply is brought to the market.
The main measurement for gold mining cost efficiency is all-in sustaining costs (AISC). AISC has been generally rising over time due to inflation and ongoing project development. Higher AISC has been one of the reasons gold equities have lagged the gold price. Both Barrick (GOLD) and Newmont should see their AISC decrease in the following years as CAPEX intensive mine expansions complete leading to lower expenses and more production. I will have more on them in future articles.
Gold has multiple structural drivers indicating increased demand globally. Its perception as an inflation hedge, despite the data to the contrary, and status as a stable investment should provide demand during the current economic uncertainty. The presence of the bullish pattern between gold and the Fed Funds Rate indicates that gold should continue to see moderate price improvements while rates remain elevated, followed by greater price increases once rate cuts begin. Additionally, central banks looking to de-dollarize will likely be a long-term trend. Finally, significant new supply coming from mines is unlikely to materialize as gold miners focus on making improvements to their existing sites and margins rather than developing new deposits.
The largest downside risk to gold is the Federal Reserve. The price of gold often moves when they make rate announcements. The gold price has typically dropped following more hawkish Fed presentations, while it has risen when the Fed was dovish. Despite these bumps in the road, the underlying trend has been upward.
Gold provides multiple avenues for investment. I do not like physical gold because it cannot be easily traded, and I would have to find somewhere safe to put it. The gold ETFs provide the easiest way to hold gold without the inconvenience, while the miners provide the possibility for greater upside swings while also carrying more risk. I personally invest in the miners because I believe they will see the greatest return over the coming years. I will cover this in more detail in later articles, but several major miners have seen their share prices drop due to lower free cash flow, but their expenses will decrease soon as short-term redevelopments are complete, leading to lower AISC and better free cash flow.