duoogle
duoogle
Small caps completed a major bullish reversal, erasing initial losses suffered after a hotter-than-expected CPI data print.
To top it off, the Russell 2000 (NYSEARCA:IWM) - as a proxy for the small cap space - has broken out from a 10-month-long base.
This is a key development, as it implies that the broad market may now be ready to participate in the rally.
In the last few weeks, heavyweight technology stocks (FNGU), which make up a large portion of the S&P 500 (SPY) and Nasdaq 100 (QQQ), have contributed to the steady uptrends of the two indices. But the participation of the Russell 2000 was sorely lacking.
This looks ready to change now, and we may be at the early innings of a powerful bull market in small (and mid) caps.
Let us take a look at the technical charts:
The Russell 2000 has been basing since April 2022. Price has been largely rangebound, and has now broken out of this massive base. Look how the index threatened to breakdown this week after the CPI report, before reversing higher to trade at the highs.
Weekly Chart: IWM
TradingView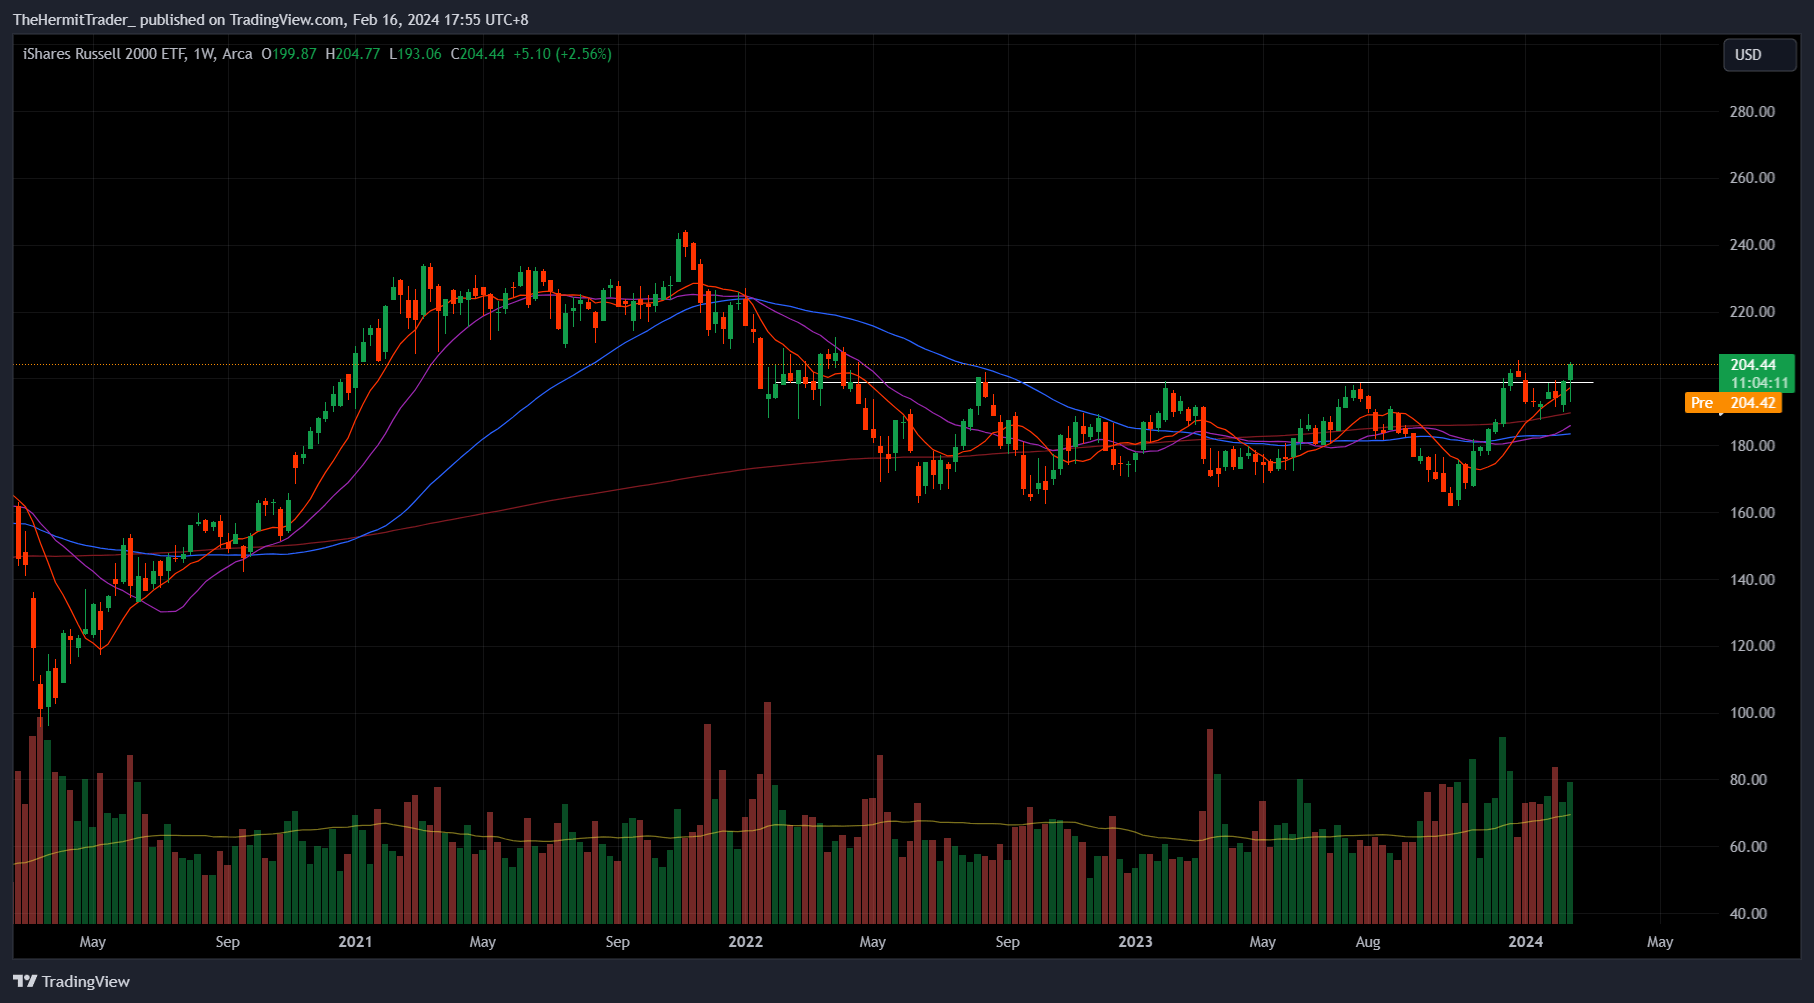
If IWM manages to close the week like this, it will likely set the stage for strong outperformance over the SPY and QQQ for the weeks ahead.
Drilling down into the daily chart, we may observe how swiftly prices reversed after the post-CPI sell-off on 13 Feb. Despite falling close to -5% on that day, it took only two days for IWM to recoup those losses and more.
Daily Chart: IWM
TradingView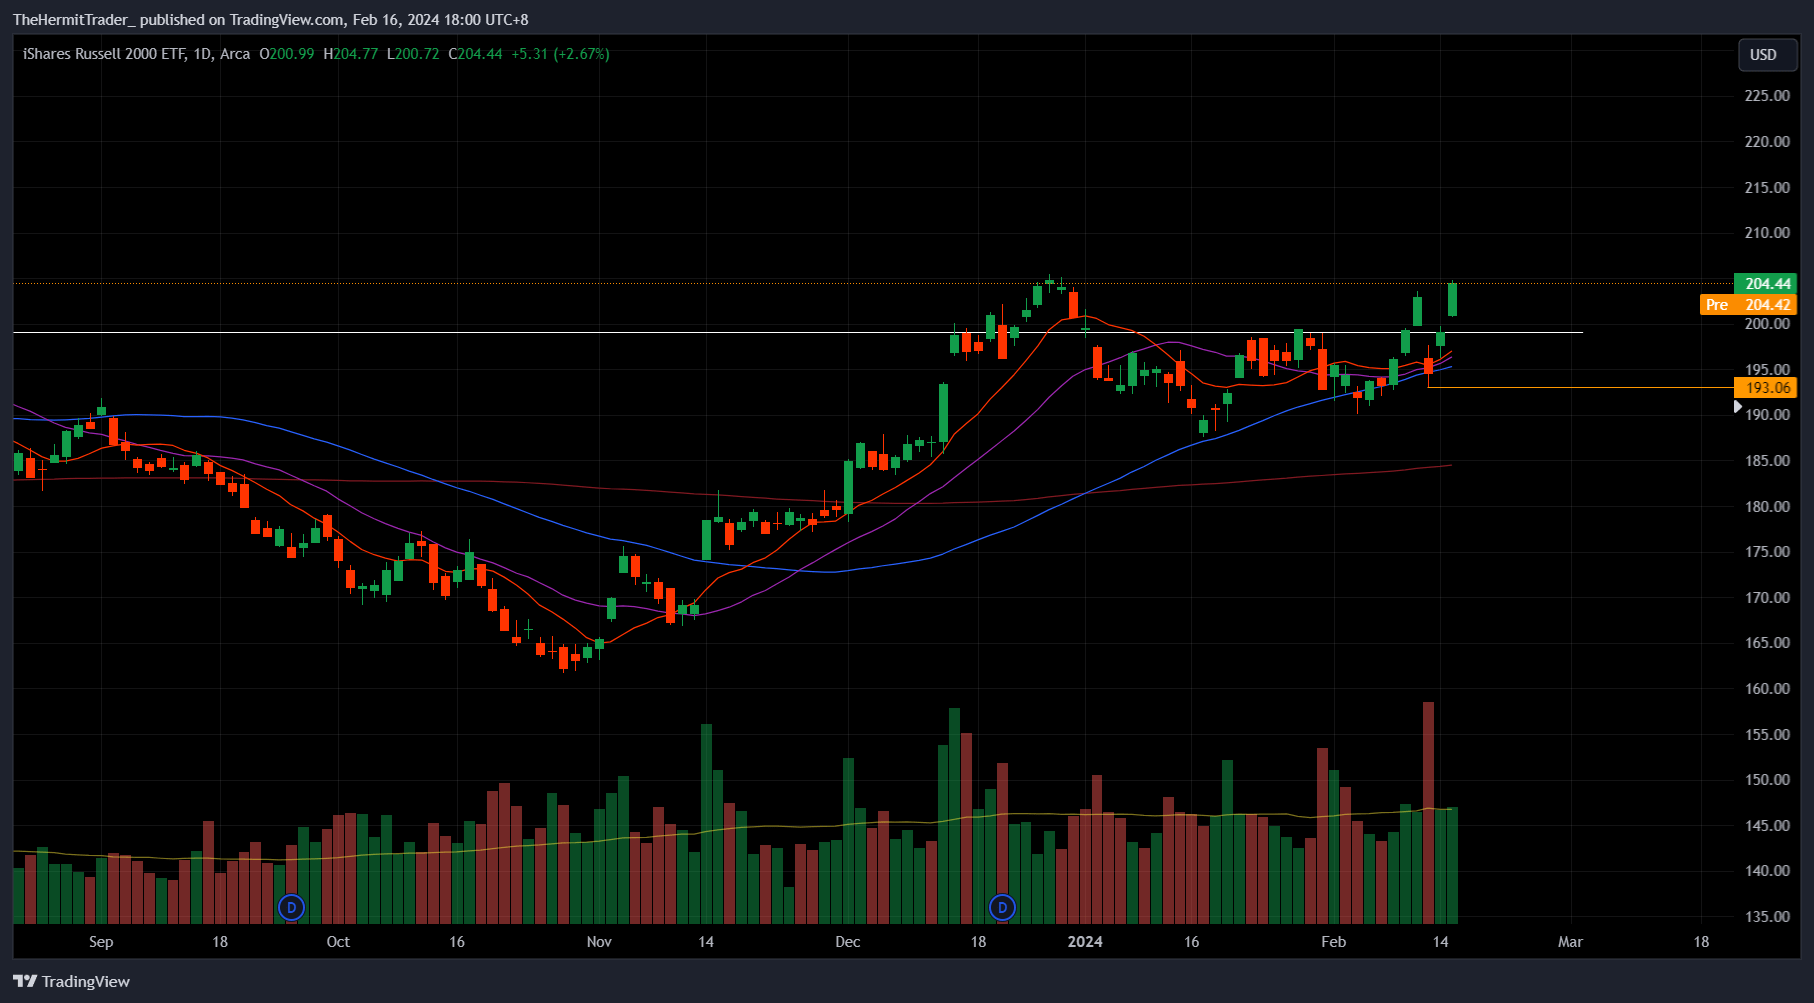
The post-CPI low looks like a "line in the sand". I have demarcated this level in orange. If prices retreat back to this level, then I am likely wrong on my bullish thesis, and the breakout from this 10 month long base is likely to be invalidated.
If we look at the sector weightings in IWM, we may observe that the largest sectors include technology (16%), industrials (15%), healthcare (15%), financials (15%) and consumer cyclicals (10%).
Yahoo Finance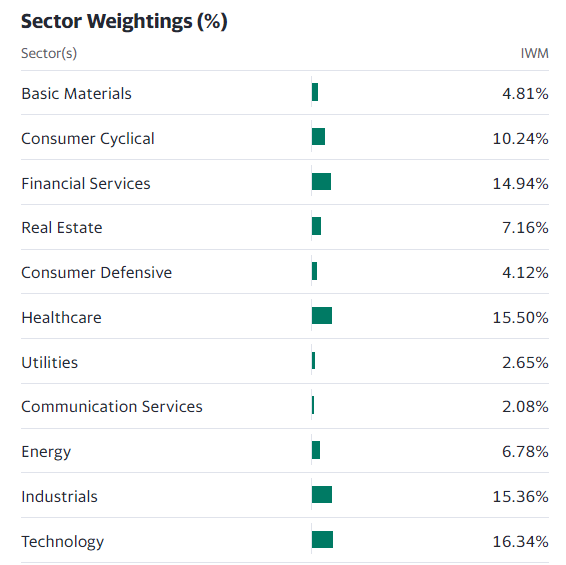
When we look at the ETFs associated with these sectors, we see that the major sectors within the Russell 2000 are setting up well.
Below, I use the equal-weight sector ETFs to get a better sense of how the sectors are performing.
Equal Weight Technology ETF (RSPT) is on a clean, strong uptrend.
Daily Chart: RSPT
TradingView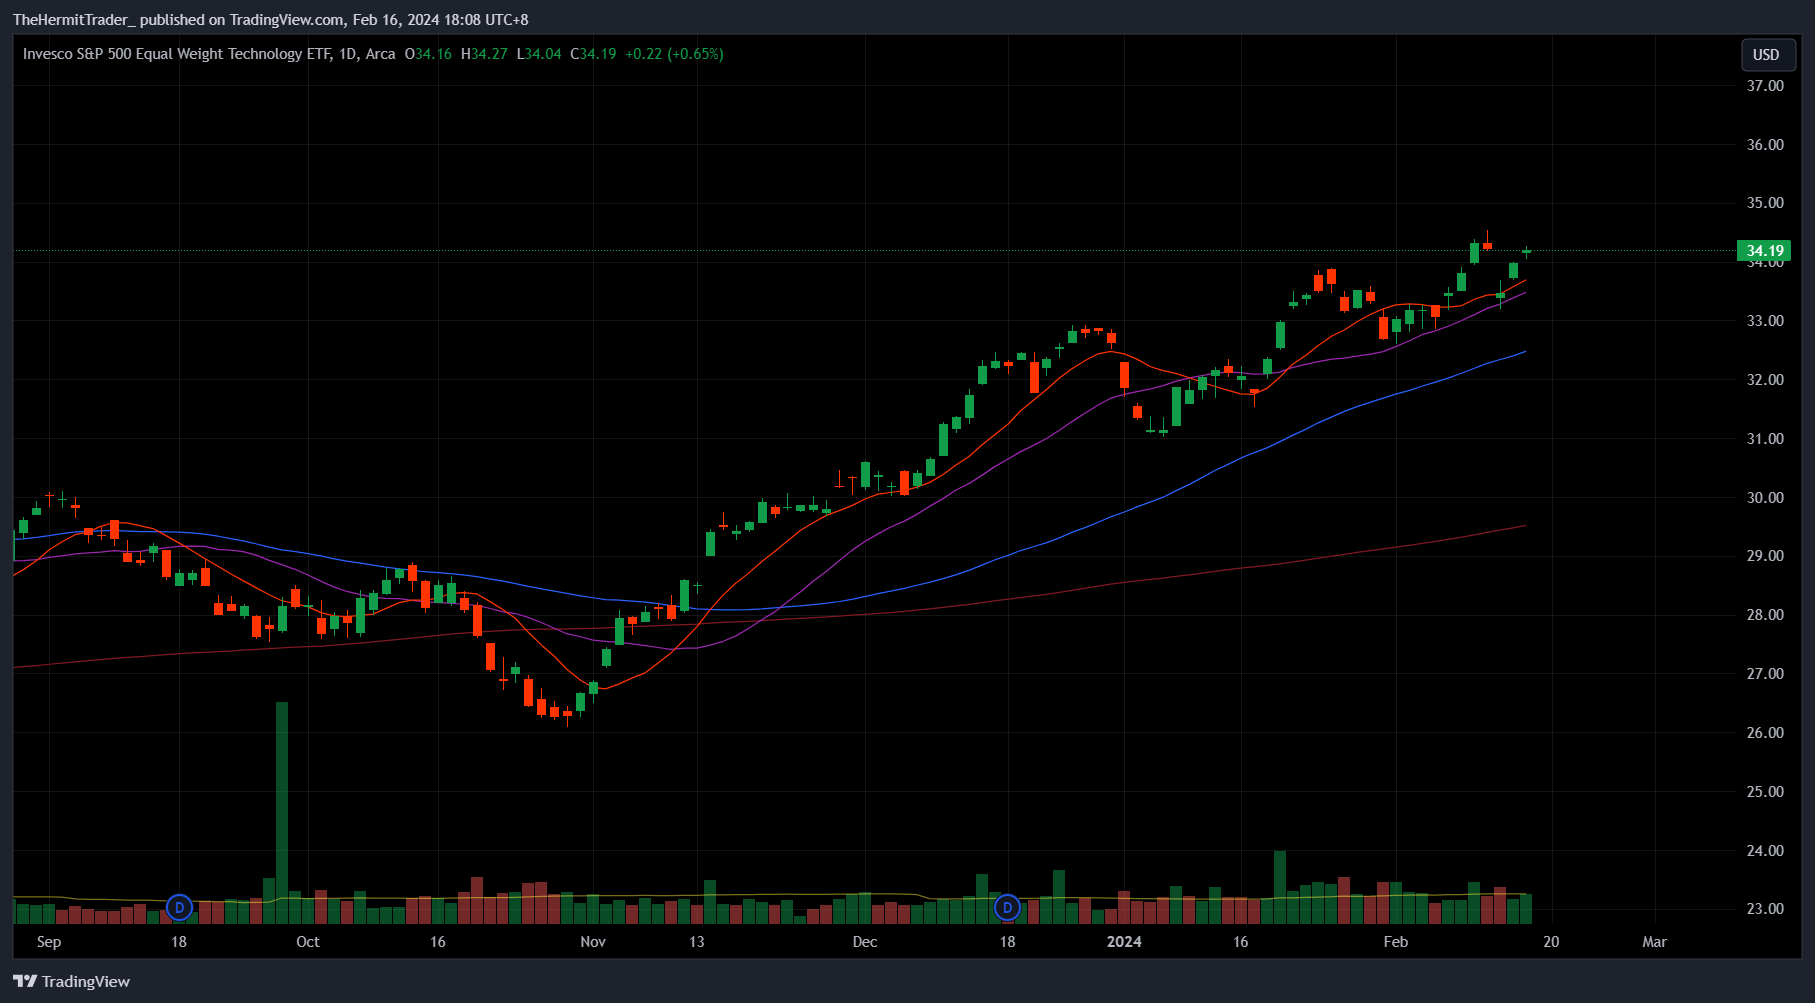
The Equal Weight Industrials ETF (RSPN) is also on a clean and strong uptrend.
Daily Chart: RSPN
TradingView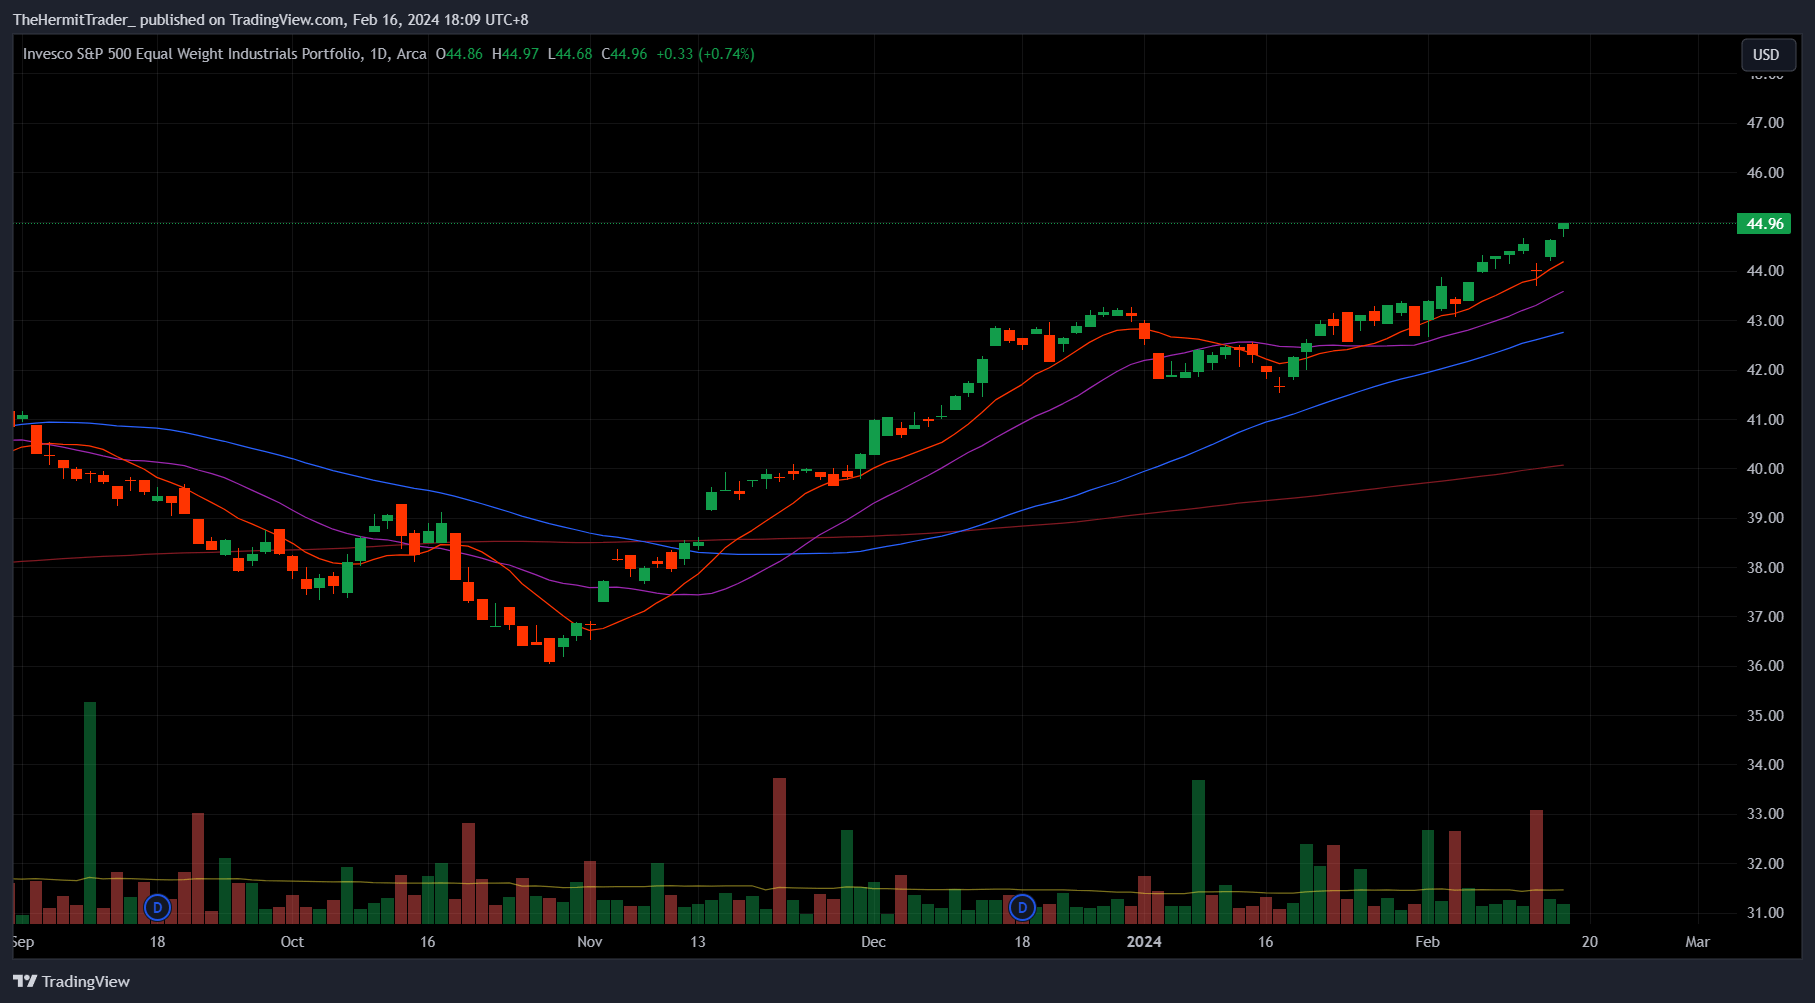
The Equal Weight Health Care ETF (RSPH) is breaking out assertively from a consolidative range it had been building since the start of January.
Daily Chart: RSPH
TradingView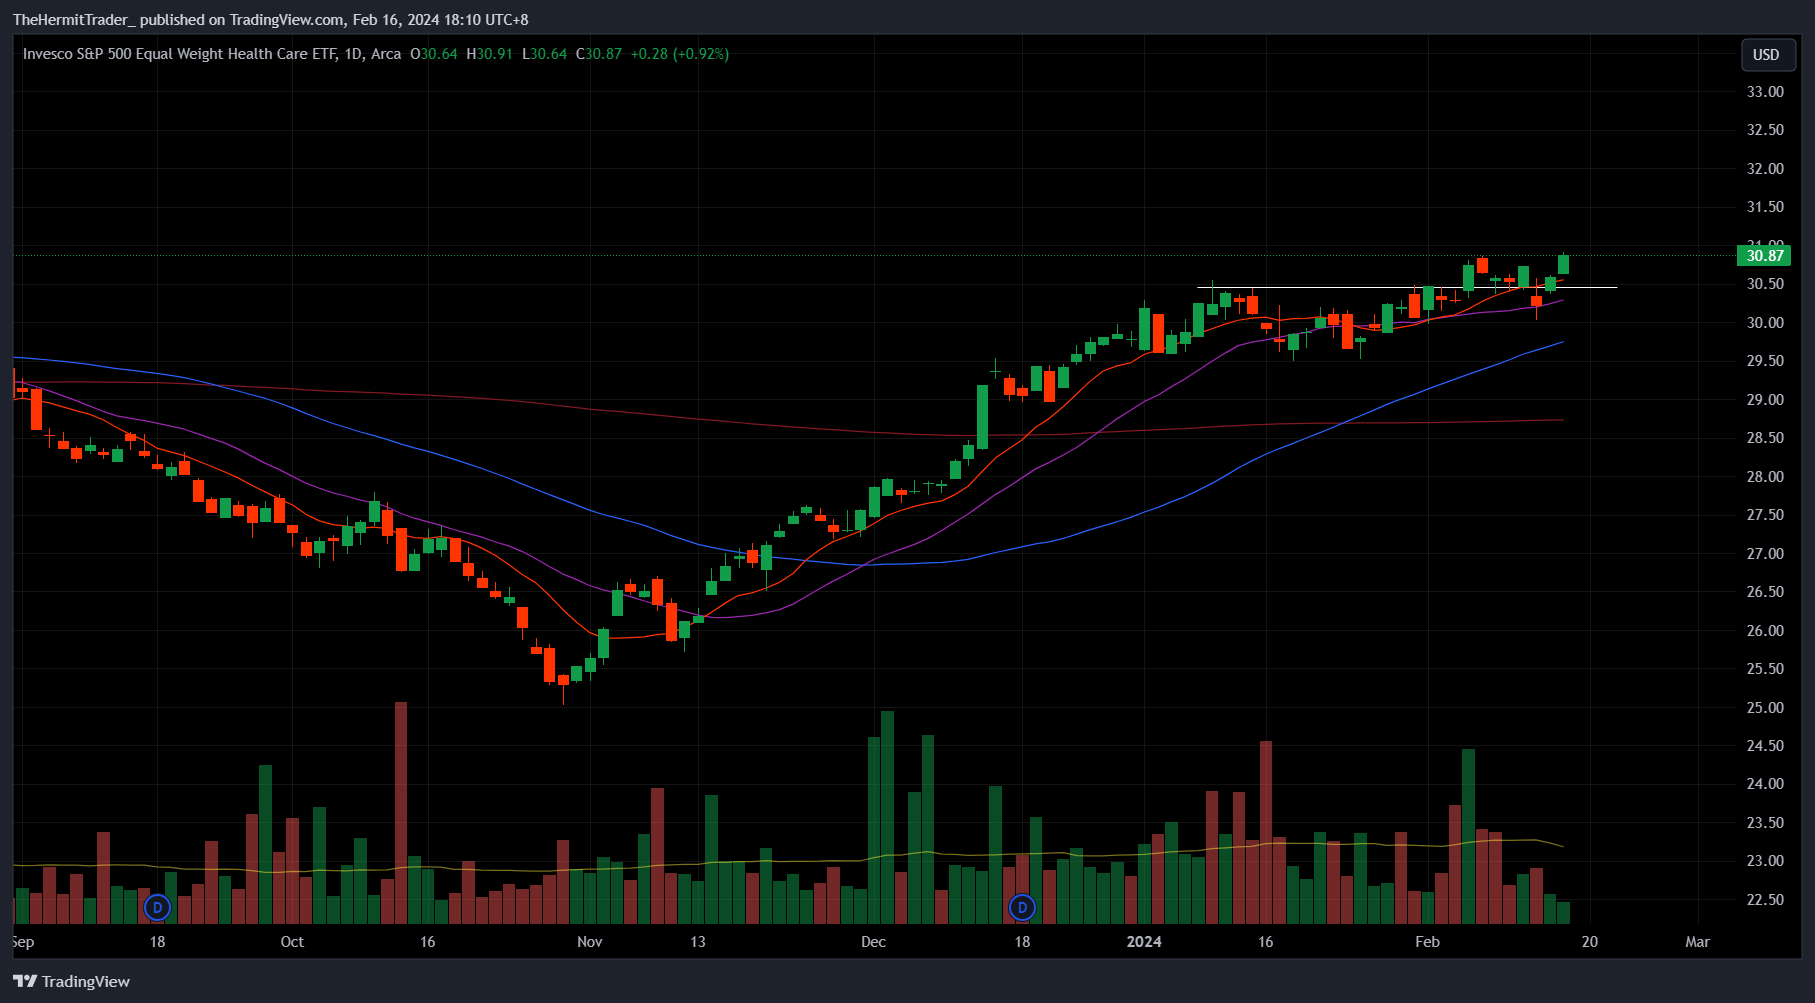
Despite the doom and gloom surrounding financials and the analyst downgrades on New York Community Bancorp (NYCB), the Equal Weight Financials ETF (RSPF) is on a clean and strong uptrend. The fears look overblown.
Daily Chart: RSPF
TradingView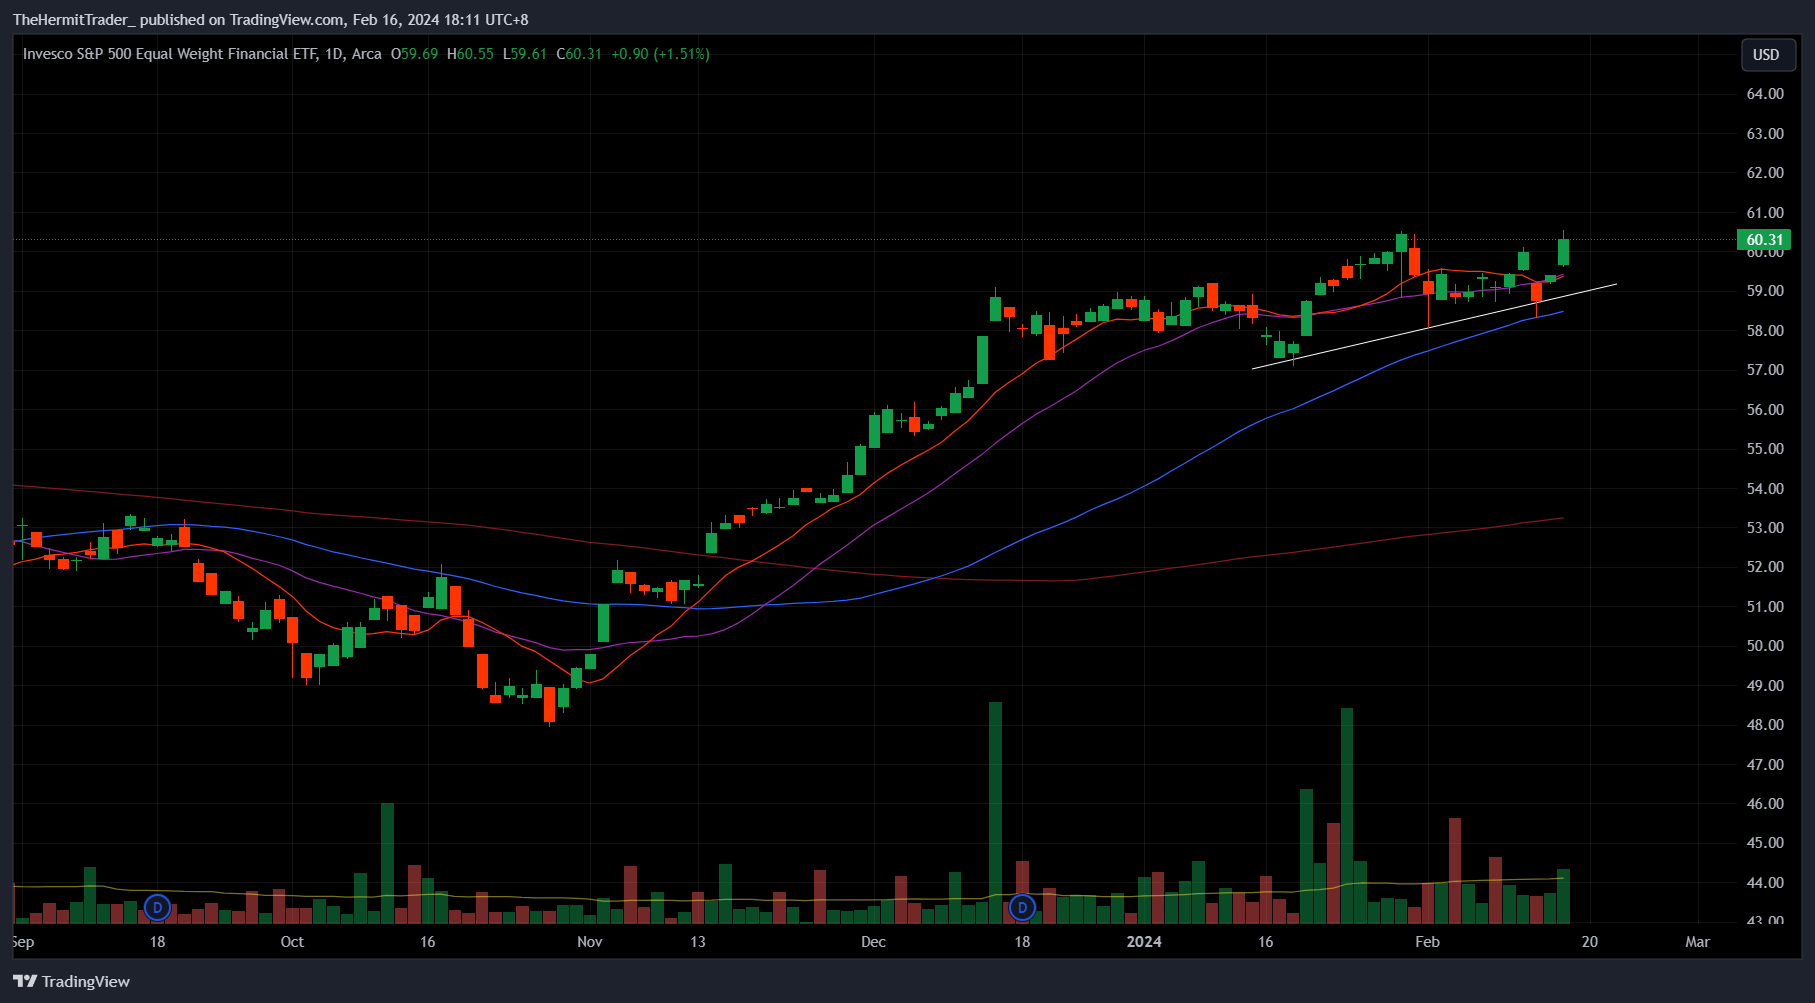
Lastly, the Equal Weight Consumer Discretionary ETF (RSPD) is breaking out of a base it has been building since December.
Daily Chart: RSPD
TradingView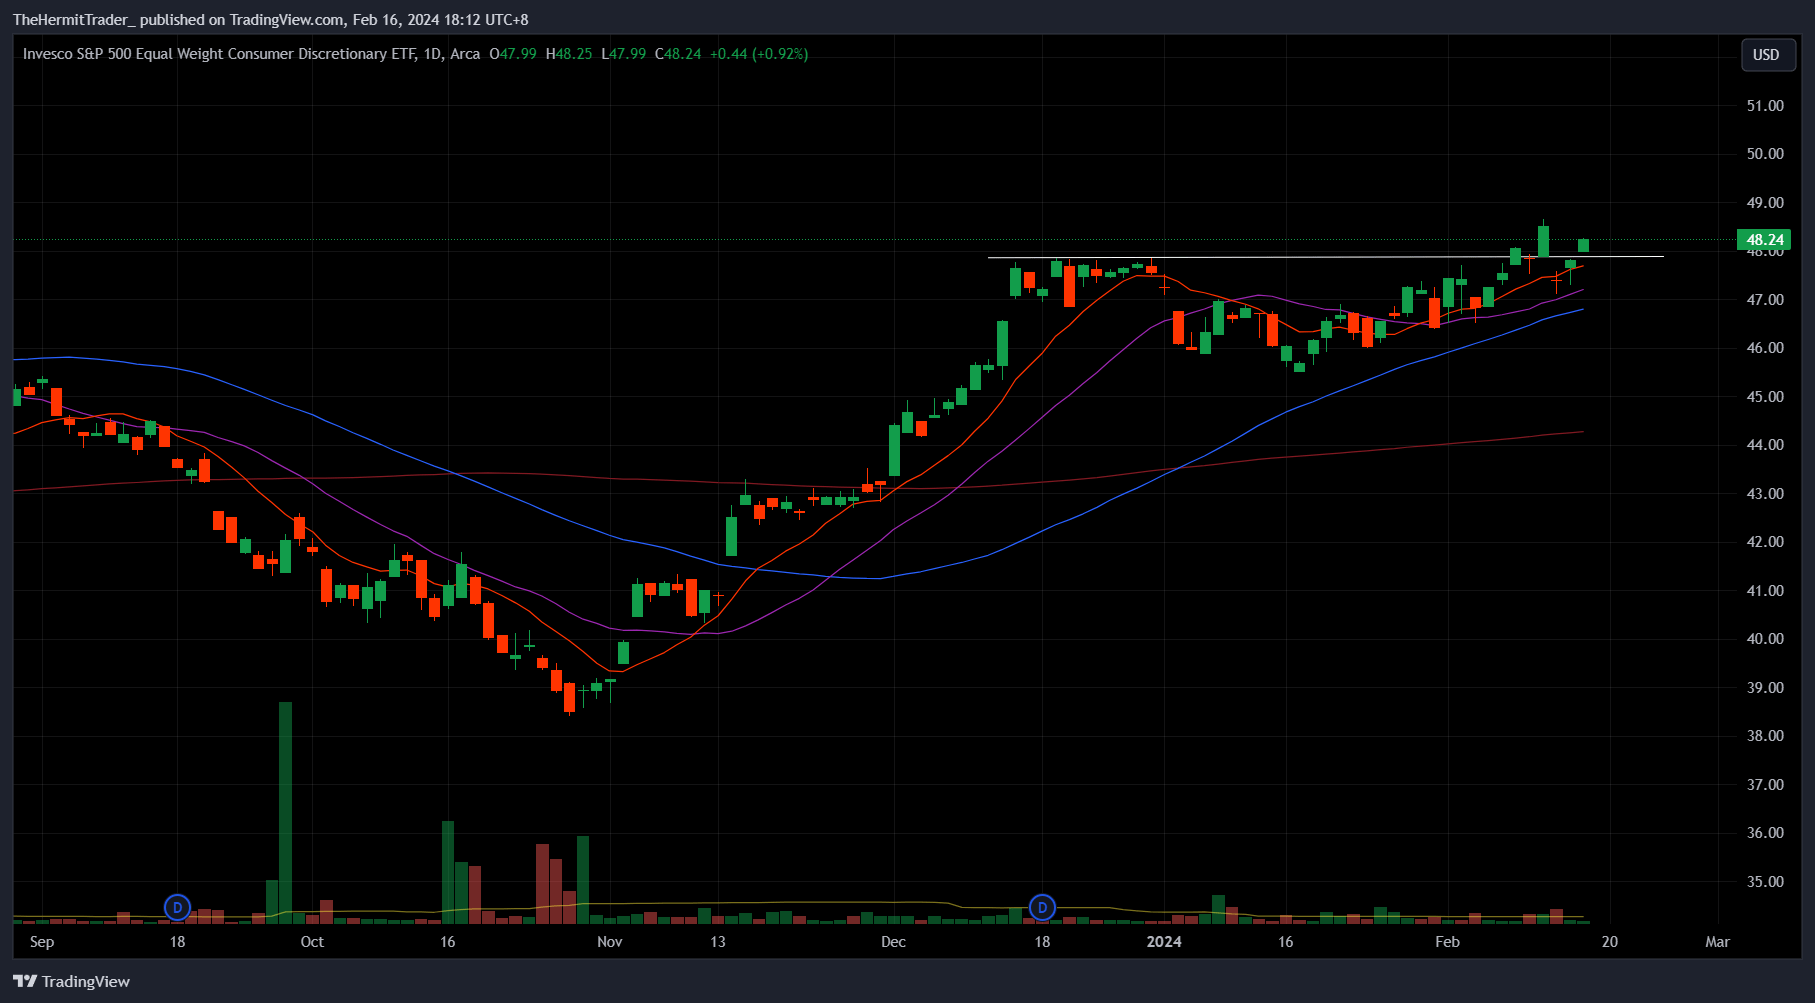
Overall, looking at the technical picture, I like the constructive signs in small caps, which look likely to outperform large and mega caps in the weeks to come.
This week's breakout in the Russell 2000 from its 10-month-long base could mean we are in the early innings of a strong bull market. The index is close to 20% below its all-time highs, which presents a compelling reward-to-risk profile.
I have started to accumulate IWM.