
loveguli/E+ via Getty Images
loveguli/E+ via Getty Images
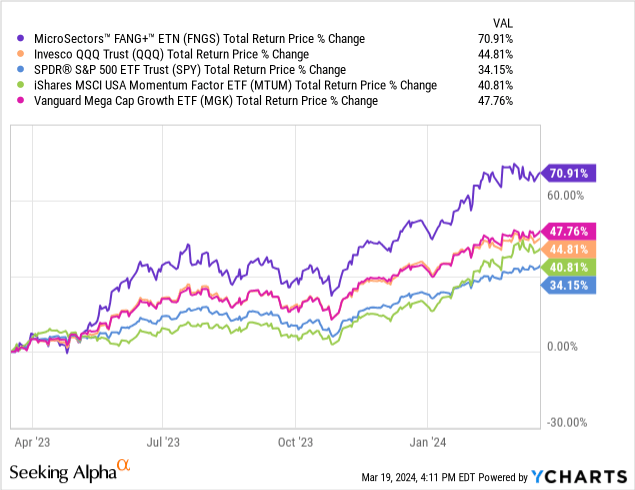
The MicroSectors FANG+ ETN (NYSEARCA:FNGS) offers targeted exposure to a specific group of ten highly traded mega-cap stocks.
From the original "FANG" term coined more than a decade ago referring to outperforming high-growth tech leaders covering Meta Platforms, Inc. (META) "Facebook", Apple Inc. (AAPL), Netflix, Inc. (NFLX), and Alphabet Inc. Class A (GOOGL) "Google"; FNGS expands that list to include Amazon.com, Inc. (AMZN), and Microsoft Corporation (MSFT).
Indeed, not much has changed with this group of stocks as hot as ever considering FNGS has returned more than 70% over the past year. The attraction of FNGS is its ability to capture the high-level trends driving these six names along with a rotating list of four other high-profile stocks in a single concentrated investment vehicle.
We believe the FNGS can work in the context of a diversified allocation to supplement equity exposure on a tactical basis. That being said, this vehicle can be considered high-risk based on its decisively non-diversified profile. The caution here is from the old saying that historical performance is not indicative of future returns. We expect FNGS to underperform on the downside during the next stock market correction.
FNGS is intended to track the "NYSE FANG+ Index" through an exchange-traded note (ETN) structure. In this case, the ETN is linked to the performance of the underlying index through related derivatives without technically holding the underlying basket of stocks.
According to the index methodology, FANG+ begins with the fixed six stocks referred to as "FAANMG" between META, AAPL, AMZN, NFLX, MSFT, and GOOGL. From there, four additional stocks that meet various criteria are selected quarterly to complete the basket. All ten stocks are equally weighted.
The main qualifiers include a minimum market capitalization of $5 billion, being incorporated in the United States, while classified in relevant sub-industries within the Technology, Media & Communications, or Consumer Discretionary sectors.
Eligible securities are ranked based on market cap, average daily trading volume, sales growth, and each company's price-to-sales ratio. The idea here is to identify the most highly liquid mega-cap stocks with a growth profile.
source: ICE Data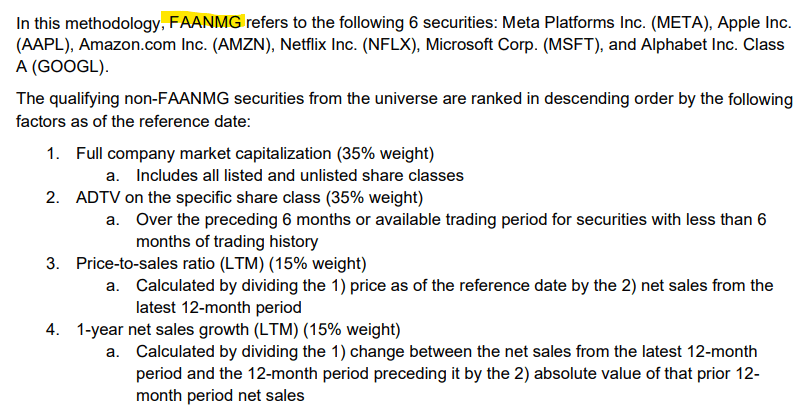
As of March 18th, 2024, the full index includes the above-mentioned names as well as Broadcom Inc. (AVGO), Snowflake Inc. (SNOW), NVIDIA Corporation (NVDA), and Tesla, Inc. (TSLA). These stocks are subject to be removed at each quarterly reconstitution, although we'd expect at least NVDA to be a regular component of the Index for the foreseeable future given its high profile.
The takeaway here is that the common element between FNGS stocks is less about a unique "theme" or factor and more based on their consistent level of widespread investor interest reflected in the average daily trading volume.
The P/S valuation multiple can be seen as indirectly capturing a layer of the momentum factor, assuming strong-performing stocks trade at a large premium. At the same time, this factor along with the net sales growth score plays a relatively small role in identifying the one or two open spaces. There's not much room for new stocks to enter this group.
source: MicroSectors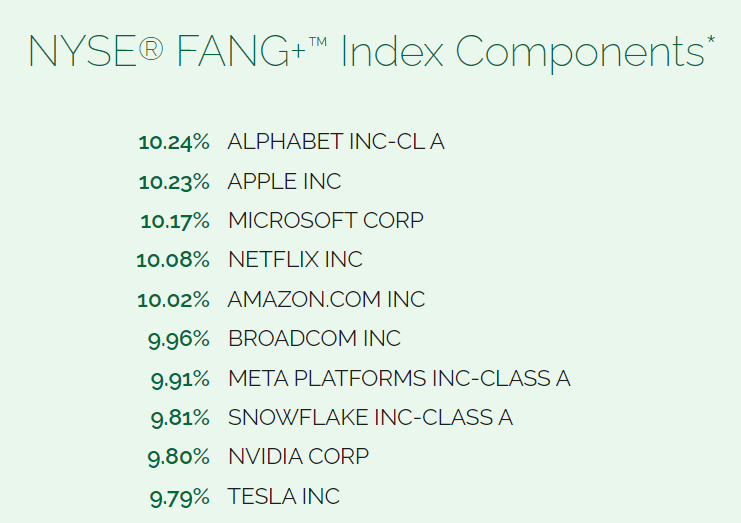
The past year has been defined by a historic market rally emerging from a period of extreme volatility in 2022. Tech companies, including the stocks within the FNGS strategy, benefited from what evolved into better-than-expected economic conditions with the market looking ahead to easing inflation expectations and a path for the Fed to back off from restrictive monetary policy.
The emergence of artificial intelligence as a new growth driver for technology companies has also represented a major tailwind for the market over the past year.
In this regard, FNGS has found itself at ground zero of market momentum with its group of stocks largely outperforming with NVDA up 244% over the past year, followed by META with a 154% return, and NFLX with a 104% gain. On the other hand, TSLA has been the outlier, as the only decliner with a 4% loss in this 1-year lookback period.
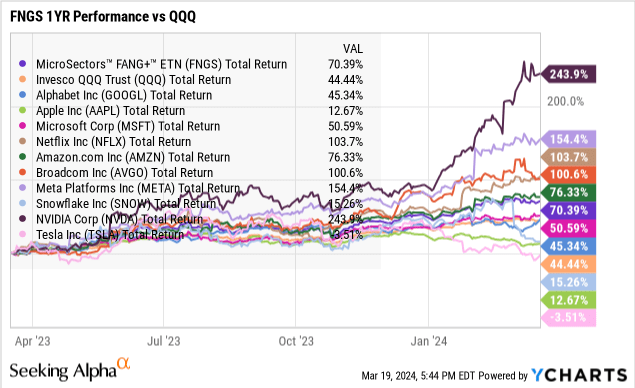
Impressively, FNGS has returned 247% since inception which is nearly double the 124% performance of the Invesco QQQ Trust ETF (QQQ). They say hindsight is 20/20, but it's clear FAANMG stocks have been the place to be with the right combination of growth and market momentum as a market force for the past decade.
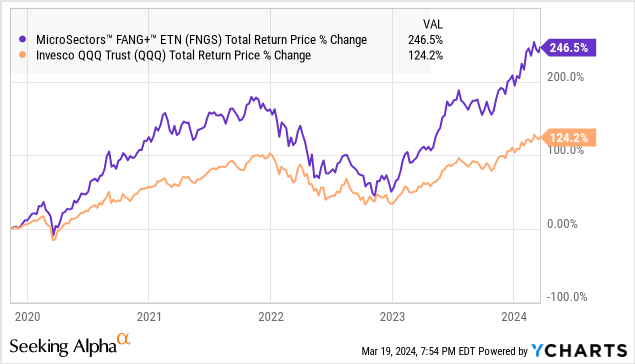
In many ways, FNGS can be seen as a high-beta version of QQQ, that focuses just on the top holdings recognizing that there is a significant overlap of exposure.
Except for SNOW, which is not a Nasdaq-listed stock, FNGS is a "QQQ Top Holdings ETF" where FNGS is essentially overweighting the same stocks that already represent 47% of QQQ. This strategy has worked out exceptionally well, but the question is whether that trend can continue.
source: Invesco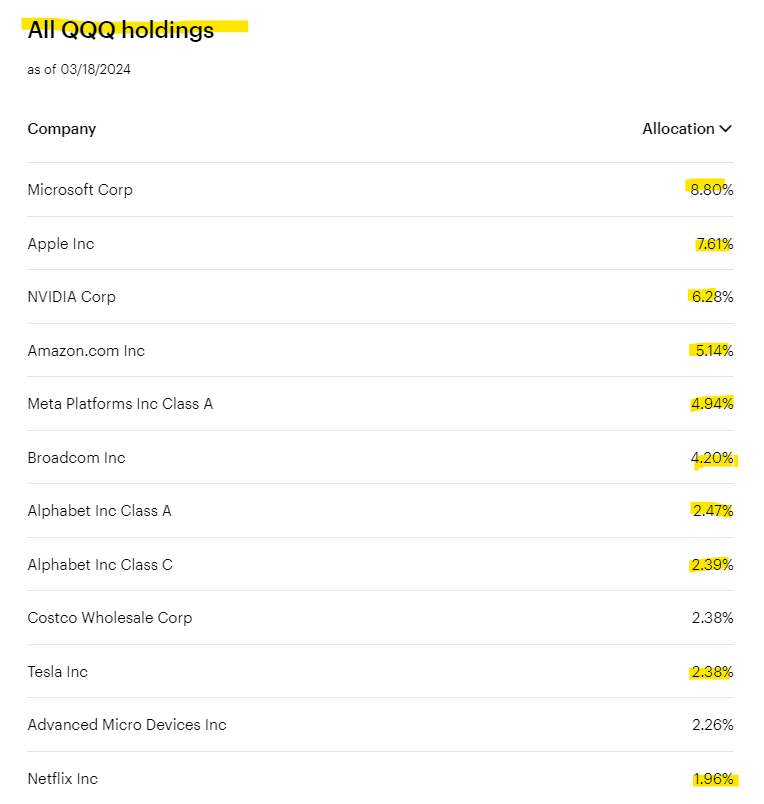
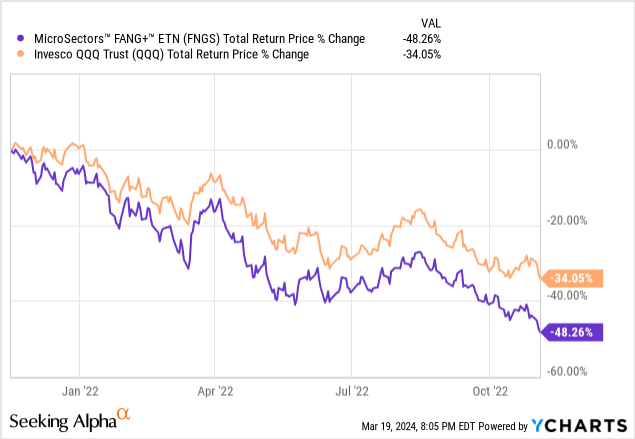
We bring this up because we have a good example of what can go wrong during the last major market correction. FNGS lost -48% between November 2021 and November 2022 as a max drawdown opening up a large spread compared to the -34% decline in QQQ over the same period.
The point here is to say that it's far from a sure thing that FNGS will always outperform or that today represents a great buying opportunity. Ultimately, we believe QQQ is a better all-around choice between these two options with the added diversification more resilient to different market environments.
It's hard to criticize or complain about what FNGS is doing given its spectacular performance. The comment we would make is that FNGS's aspect of tracking the performance of just 10 stocks nearly defeats the purpose of what an "ETF" should be.
There's nothing necessarily wrong about being bullish on FANG+ stocks, but if we have a strong conviction that a particular name like NVDA or META is set to significantly outperform, then buying those shares directly could make more sense. Even over the past year where FNGS has returned 70%, half of the components exceed that gain.
On the other hand, the worst-case scenario would be for one of the core six FAANMG stocks to begin structurally underperforming based on company-specific factors for any number of reasons.
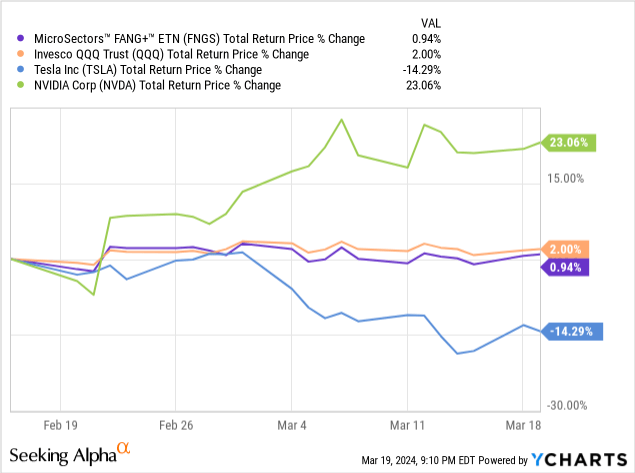
We have a preview of that with the action over the past month where FNGS with a 0.9% return has trailed the 2% gain in QQQ. This occurred even as NVDA climbed 23% while the ETN's performance was dragged down by a 14% selloff in TSLA.
In the context of the current environment, there are several paths where QQQ could outperform FNGS over any particular period going forward. That includes a market-wide selloff where FNGS would get hit through its more aggressive positioning while QQQ benefits from greater diversification.
To the upside, QQQ could outperform FNGS if there is a broader rotation where smaller stocks down the line of QQQ holdings lead higher while the FANG+ names consolidate recent gains.
FNGS is a unique investment vehicle that serves a very specific purpose by concentrating exposure into a small high-profile group of mega-cap tech stocks. With some reservations regarding the structure, FNGS can work to tactically add a high-beta tech component to an existing portfolio to take advantage of bullish market momentum.
At the current level, we suggest a more cautious approach with a sense the next stage in the market cycle could be defined by a rotation away from 2023 winners. Despite the strong performance history, FNGS remains exposed to wide swings of volatility.