
Khanchit Khirisutchalual
Khanchit Khirisutchalual
This monthly article series shows a dashboard with aggregate industry metrics in information technology. It may also serve as a top-down analysis of sector ETFs like Technology Select Sector SPDR Fund ETF (XLK) and First Trust Technology AlphaDEX® Fund ETF (NYSEARCA:FXL), whose holdings are used to calculate these metrics.
The next two paragraphs in italics describe the dashboard methodology. They are necessary for new readers to understand the metrics. If you are used to this series or if you are short of time, you can skip them and go to the charts.
I calculate the median value of five fundamental ratios for each industry: Earnings Yield ("EY"), Sales Yield ("SY"), Free Cash Flow Yield ("FY"), Return on Equity ("ROE"), and Gross Margin ("GM"). The reference universe includes large companies in the U.S. stock market. The five base metrics are calculated on trailing 12 months. For all of them, higher is better. EY, SY and FY are medians of the inverse of Price/Earnings, Price/Sales, and Price/Free Cash Flow. They are better for statistical studies than price-to-something ratios, which are unusable or non-available when the "something" is close to zero or negative (for example, companies with negative earnings). I also look at two momentum metrics for each group: the median monthly return (RetM) and the median annual return (RetY).
I prefer medians to averages because a median splits a set into a good half and a bad half. A capital-weighted average is skewed by extreme values and the largest companies. My metrics are designed for stock-picking rather than index investing.
I calculate historical baselines for all metrics. They are noted respectively EYh, SYh, FYh, ROEh, and GMh, and they are calculated as the averages on a look-back period of 11 years. For example, the value of EYh for hardware in the table below is the 11-year average of the median Earnings Yield in hardware companies.
The Value Score ("VS") is defined as the average difference in % between the three valuation ratios (EY, SY, FY) and their baselines (EYh, SYh, FYh). The same way, the Quality Score ("QS") is the average difference between the two quality ratios (ROE, GM) and their baselines (ROEh, GMh).
The scores are in percentage points. VS may be interpreted as the percentage of undervaluation or overvaluation relative to the baseline (positive is good, negative is bad). This interpretation must be taken with caution: the baseline is an arbitrary reference, not a supposed fair value. The formula assumes that the three valuation metrics are of equal importance.
The next table shows the metrics and scores as of writing. Columns stand for all the data named and defined above.
VS | QS | EY | SY | FY | ROE | GM | EYh | SYh | FYh | ROEh | GMh | RetM | RetY | |
Hardware | -47.19 | -36.08 | 0.0031 | 0.5498 | 0.0340 | 2.96 | 33.00 | 0.0344 | 0.9598 | 0.0369 | 6.28 | 40.84 | 9.87% | 71.67% |
Comm. Equip. | -8.87 | 10.98 | 0.0283 | 0.2839 | 0.0292 | 20.56 | 60.87 | 0.0312 | 0.2672 | 0.0382 | 16.42 | 62.88 | -3.21% | -15.75% |
Electronic Equip. | -13.44 | -12.72 | 0.0370 | 0.5564 | 0.0360 | 15.38 | 20.72 | 0.0401 | 0.7579 | 0.0383 | 13.35 | 34.93 | 1.04% | 12.70% |
Software | -25.52 | 11.26 | 0.0204 | 0.1051 | 0.0249 | 22.96 | 81.95 | 0.0249 | 0.1575 | 0.0333 | 18.10 | 85.65 | 0.69% | 22.10% |
Semiconductors | -34.72 | 1.30 | 0.0282 | 0.1537 | 0.0208 | 27.02 | 58.28 | 0.0441 | 0.2264 | 0.0325 | 24.73 | 62.45 | -0.20% | 6.20% |
IT Services | -32.31 | 9.43 | 0.0322 | 0.1630 | 0.0188 | 30.40 | 58.68 | 0.0366 | 0.3026 | 0.0307 | 27.01 | 55.20 | 1.45% | 15.80% |
The next chart plots the Value and Quality Scores by industry (higher is better).
Value and Quality in technology (chart: author; data: Portfolio123)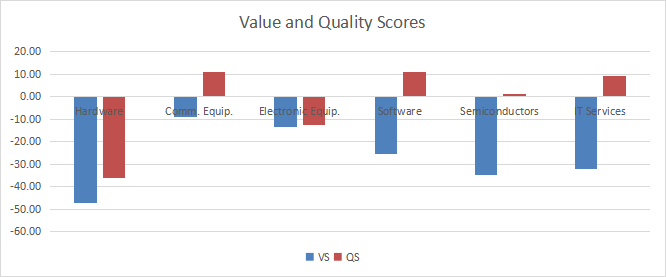
The value score has marginally improved in communication equipment and deteriorated in other industries. The quality score has improved a bit in software and deteriorated in hardware and semiconductors.
Score variations (chart: author; data: Portfolio123)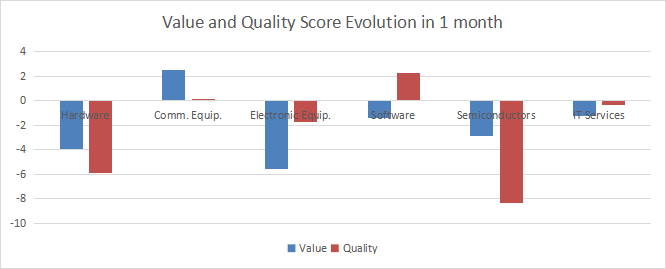
The next chart plots momentum scores based on median returns.
Momentum in technology (chart: author; data: Portfolio123)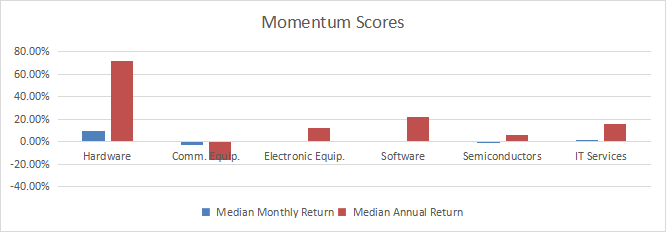
The information technology sector as a whole is overvalued by about 30% relative to 11-year averages according to my S&P 500 monthly dashboard. Nevertheless, the level of overvaluation varies across subsectors: less than 15% for communication equipment and electronic equipment, and more than 25% in other industries. Quality may partly offset overvaluation in communication equipment, and to a lesser extent in software and IT services. Hardware is the least attractive subsector, with both value and quality scores far below the historical baseline.
First Trust Technology AlphaDEX® Fund ETF started investing operations on 5/8/2007 and tracks the StrataQuant® Technology Index. It has 97 holdings and an expense ratio of 0.62%, whereas XLK has a 0.09% fee.
As described by First Trust, the index starts from the Russell 1000 Index. Constituents are given a growth score and a value score based on quantitative factors. Each company keeps only one score (growth or value) based on its style designation by Russell. Then, stocks in the technology sector are ranked according to their scores. The greater of the top 75% or 40 stocks is selected in the fund's underlying index. Constituents are divided into quintiles and the top-ranked quintiles get a higher weight. Stocks are equally weighted within each quintile. The index is reconstituted quarterly. In summary, FXL selects and overweight stocks looking attractive relative to their peers regarding either value or growth.
The next table lists the top 10 holdings with their weights and some fundamental ratios. Together, they represent 20.8% of asset value, and the largest position weighs 2.66%. Therefore, the portfolio is well-diversified and risks related to individual companies are much lower than for capital-weighted ETFs like XLK, where Apple Inc. (AAPL) and Microsoft Corp. (MSFT) together represent over 40% of asset value.
Ticker | Name | Weight% | EPS growth %TTM | P/E TTM | P/E fwd | Yield% |
Vertiv Holdings Co | 2.66% | 2597.67 | 63.04 | 32.43 | 0.13 | |
NVIDIA Corp. | 2.44% | 585.45 | 73.59 | 35.10 | 0.02 | |
Nutanix, Inc. | 2.28% | 83.57 | N/A | 58.99 | 0 | |
DoorDash, Inc. | 2.27% | 60.72 | N/A | 558.95 | 0 | |
CrowdStrike Holdings, Inc. | 2.13% | 146.22 | 869.56 | 80.34 | 0 | |
Salesforce, Inc. | 1.93% | 1938.34 | 69.99 | 30.08 | 0.54 | |
Cloudflare, Inc. | 1.89% | 6.87 | N/A | 156.67 | 0 | |
ServiceNow, Inc. | 1.81% | 425.71 | 88.39 | 56.52 | 0 | |
Datadog, Inc. | 1.71% | 180.56 | 928.45 | 83.43 | 0 | |
Hewlett Packard Enterprise Co. | 1.70% | 125.59 | 11.52 | 8.91 | 3.11 |
Data calculated with Portfolio123
Since its inception, FXL has underperformed XLK, and it is shortly behind the Invesco S&P 500® Equal Weight Technology ETF (RSPT).
FXL vs. XLK, RSPT, since May 2007 (Seeking Alpha)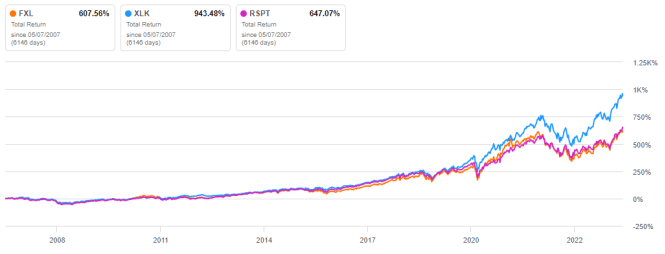
FXL has also been lagging both benchmarks over the last 12 months:
FXL vs. XLK, RSPT, 12-month return (Seeking Alpha)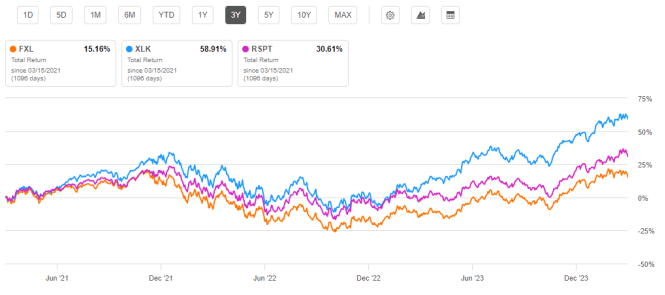
In summary, FXL is a well-diversified technology ETF favoring stocks with either growth or value characteristics. The idea looks great for investors willing to avoid the concentration in mega-caps of popular technology ETFs like XLK. Nevertheless, the strategy has failed to bring excess return since 2007.
I use the first table to calculate value and quality scores. It may also be used in a stock-picking process to check how companies stand among their peers. For example, the EY column tells us that an IT services company with an earnings yield above 0.0322 (or price/earnings below 31.06) is in the better half of the industry regarding this metric. A Dashboard List is sent every month to Quantitative Risk & Value subscribers with the most profitable companies standing in the better half among their peers regarding the three valuation metrics at the same time. The stocks below are part of the list sent to subscribers a few weeks ago based on data available at this time.
Extreme Networks, Inc. | |
Cars.com Inc. | |
TE Connectivity Ltd. | |
NXP Semiconductors N.V. | |
Gen Digital Inc. | |
InterDigital, Inc. |
It is a rotational model with a statistical bias toward excess returns in the long term, not the result of an analysis of each stock.