IFest/iStock via Getty Images
IFest/iStock via Getty Images
Investors on the lookout for low-cost access to mid-and-large-cap Brazilian stocks may consider looking at The Franklin FTSE Brazil ETF (NYSEARCA:FLBR). Granted, FLBR isn't as popular as the flagship Brazilian ETF -iShares MSCI Brazil ETF (EWZ) which has an AUM figure that is 36x that of FLBR's corresponding figure. However, do consider that the former only came to the bourses around 6 years back, whereas the latter has been in existence for well over 23 years now.
FLBR's biggest plus point is its cost-competitiveness; the expense ratio of 0.19%, is three times lower than the corresponding ratio of EWZ's (0.59%). That isn't all, the income angle too looks a lot more attractive, with FLBR's yield currently amounting to a whopping 9.38%, a good 335bps more than what EWZ has offered.
YCharts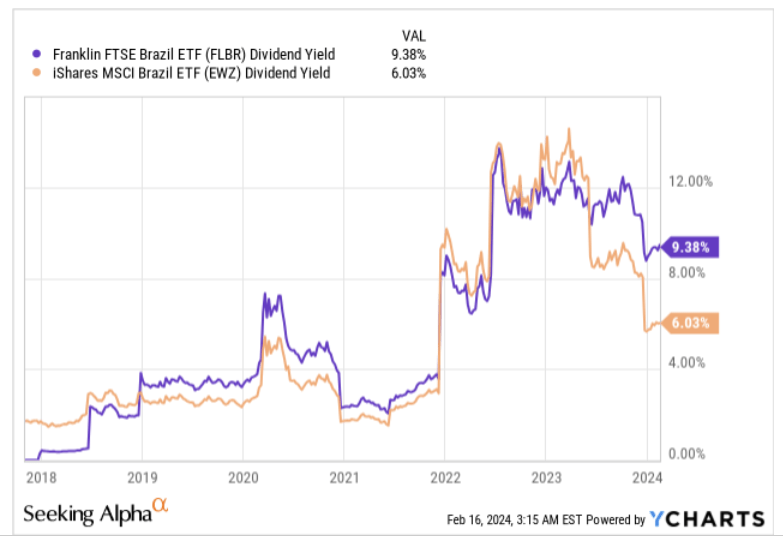
Whilst both ETFs had trimmed their dividends outlays last year, note that FLBR did it by a far lower margin (-11%); also in the year before last, FLBR was more generous with its annual dividend growth by 8%.
Seeking Alpha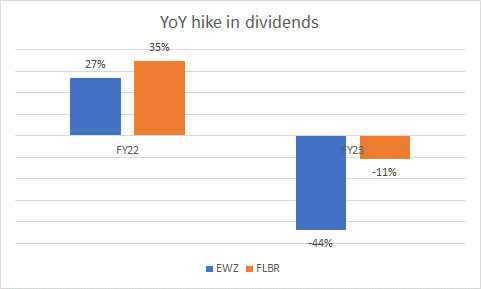
One drawback of FLBR that's worth highlighting is that it isn't a particularly stable portfolio. Based on the annual turnover ratios of FLBR and EWZ it looks like the former turns over well over 50% of its portfolio (it covers 88 stocks) on an annual basis, whereas the latter is more stable with an acceptable turnover ratio of just 22%.
Brazil's economic performance through much of last year had surprised a lot of its critics, but one does wonder if they can keep this up for too long.
Firstly, note that the services sector which contributes close to 60% of GDP is witnessing a loss in momentum after a resilient couple of years. The sector which had grown at an impressive pace of 8-10% p.a. over the preceding two years saw growth in volume last year slow sharply to 2.3%. Crucially the reading for the most recent month in December was a -2% decline in sales volume, the most pronounced drop since Jan 2021.
Investors should also note that the agricultural sector which saw bumper harvests last year, will likely see a 3% decline in volume, mainly on account of adverse weather conditions.
It would also pay to keep track of the medium-term drift of the Leading Economic Index, which is a forward-looking monthly gauge that can provide useful pivot points in a business cycle. Note that the latest reading for January only grew by 0.3%, a lot slower than the 1.1% increase seen in December.
Crucially, over a 6-month time frame through Jan 24, the index only grew by 2.5%, a lot slower than the 4.1% growth seen through the six months ending July 2023. This clearly highlights how conditions appear to be slowing.
Conference Board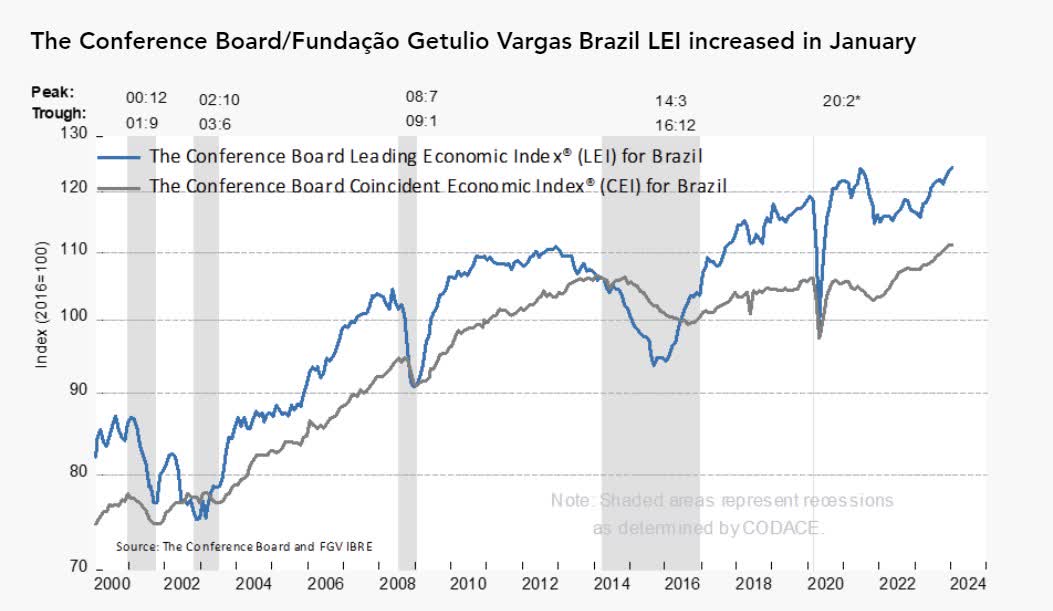
All in all, as per the IMF's forecasts, real GDP growth in Brazil this year will come off quite significantly, with an expected figure of only+1.7%. Note that amongst all the BRICS nations, Brazil will lead the drop off in the pace of GDP between FY23 and FY24 (South Africa is the only region that will witness a positive increase, but then again, it is still the slowest growing region in this cohort).
IMF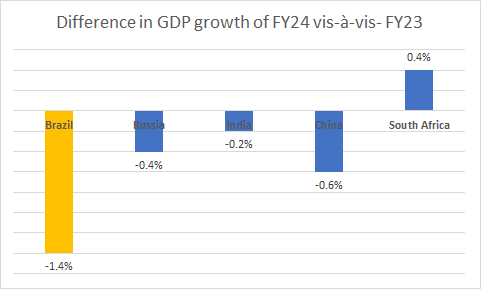
Investors should also be mindful of risks linked to the ongoing deterioration of the public finances in Brazil. The Lula administration has attempted to galvanize the economy by doubling down on state spending and keeping in place some of the pandemic-era benefits (real expenditure is up by a whopping 12.5%), but this has ended up driving the annual deficit to 2.1% of GDP, a stark contrast to the 0.5% surplus seen in the previous year. The finance minister of Brazil had previously sounded optimistic about eliminating the deficit in FY24, but that appears to be a tall order in light of Lula's tenuous commitment to the cause.
Bloomberg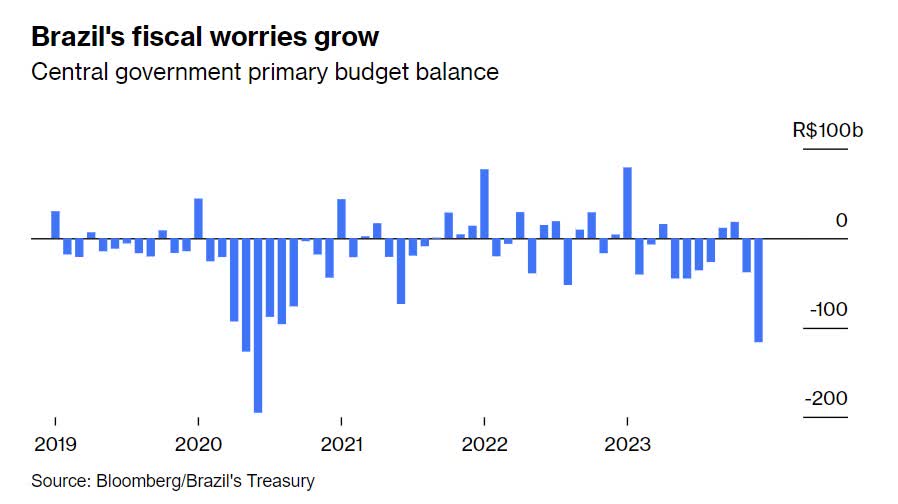
YCharts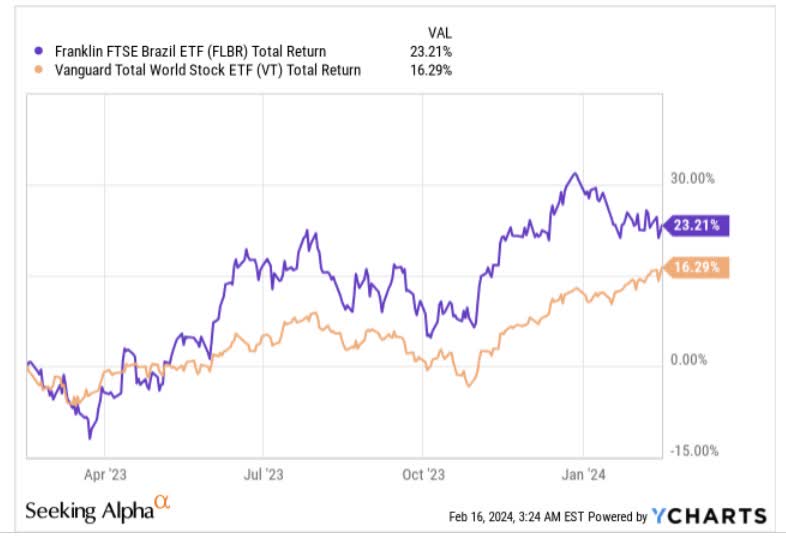
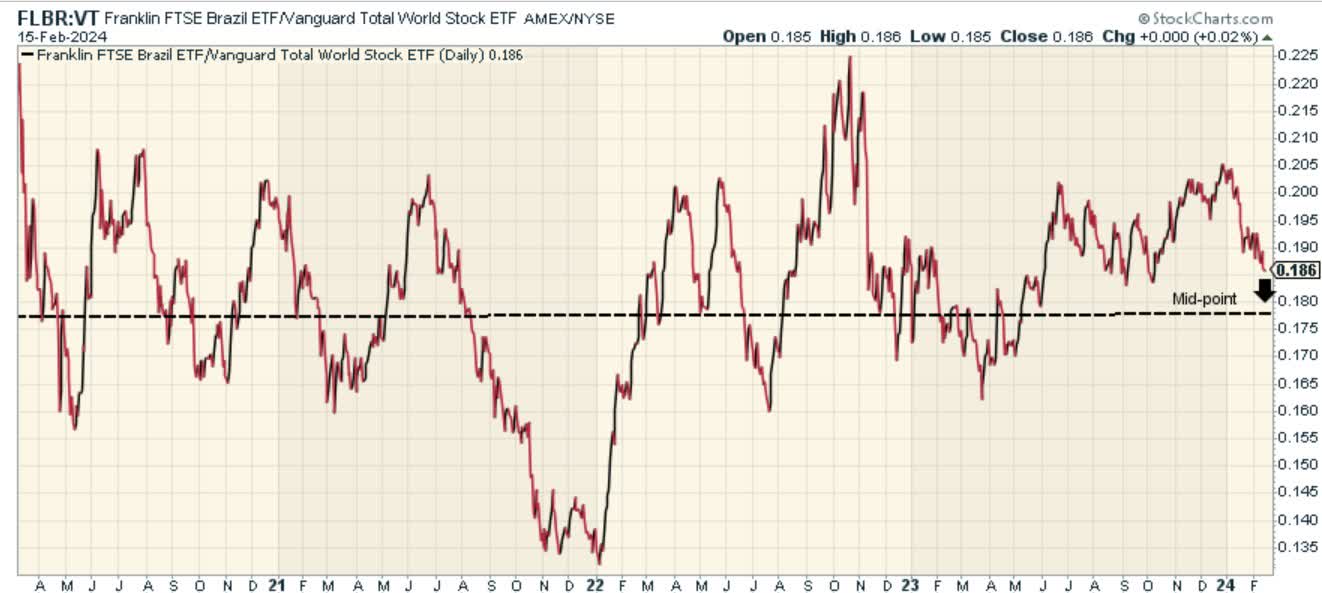
Over the past year, Brazilian stocks have done reasonably well, delivering positive returns of 23%, nearly 700bps more than their counterparts across the globe. Now after a healthy run-up, it is questionable if a fresh long position ought to be considered at this juncture given what the charts are suggesting.
Investing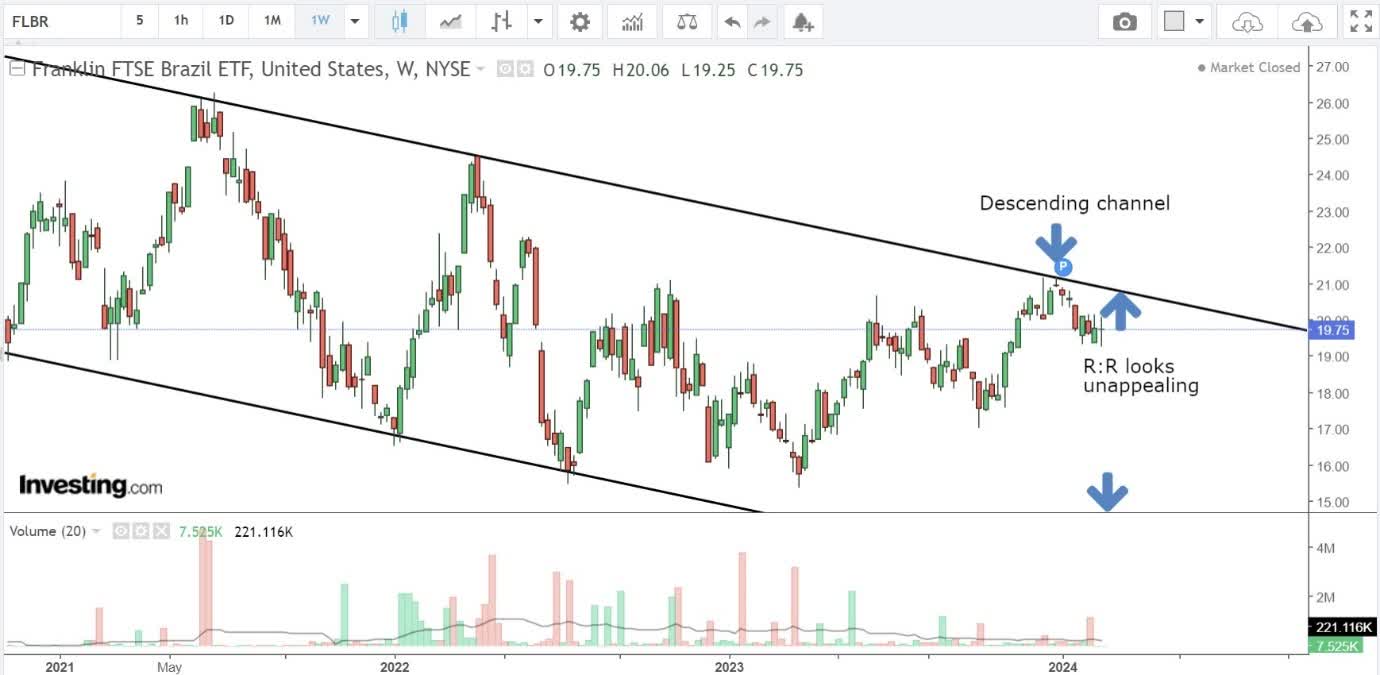
If one looks at FLBR's price imprints over the last three years, one can see that the price has oscillated within a certain descending channel (two black lines). The ideal time to buy this ETF is when the price is a lot closer to the lower boundary of the channel, not where it is now, which represents a potential upside of just 4-5%, and a substantial gap from the lower boundary.
Investors may also want to take note of the fact that after months of positive fund flows, we've recently seen quite elevated outflows in the current month, equating to roughly 13% of the ETF's total AUM. The quantum of outflow with still around half a month to go, should make one cautious about the prospect of outsized gains at these levels.
ETF.com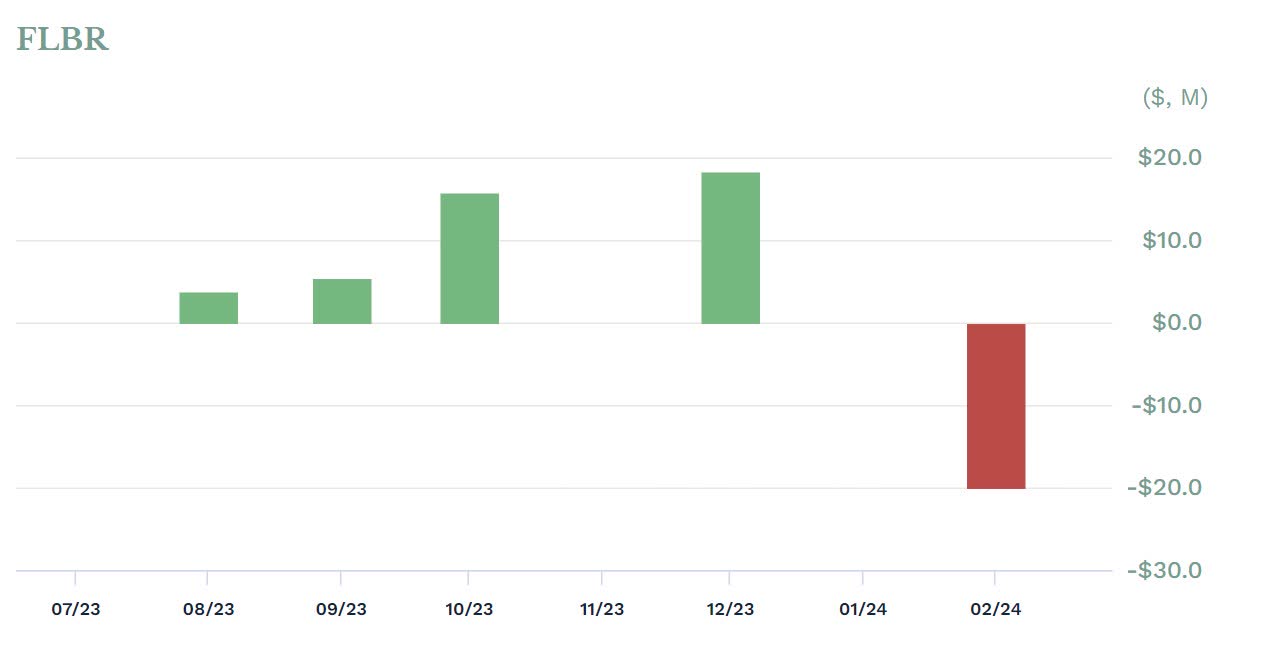
The long case is further dampened by the current relative strength of Brazilian stocks versus global stocks. Whilst this ratio certainly doesn't look overextended, it is still trading quite some way above the mid-point of the long-term range, and suggests that FLBR may not benefit from too much of bargain hunting interest from those who rotate across different pockets across the globe.
Stockcharts