
syahrir maulana
syahrir maulana
Vanguard S&P Small-Cap 600 Growth Index Fund ETF (NYSEARCA:VIOG) started investing operations on 09/07/2010 and tracks the S&P Mid-Cap 600 Growth Index, like iShares S&P Small-Cap 600 Growth ETF (IJT) and SPDR® S&P 600™ Small Cap Growth ETF (SLYG). VIOG has 342 holdings, a dividend yield of 1.20%, an expense ratio of 0.15%, and is also available as a mutual fund (VSGNX).
The methodology by S&P Dow Jones Indices ranks S&P 600 constituents in Value and Growth styles using three valuation ratios and three growth metrics. The valuation ratios are book value to price, earnings to price and sales to price. The growth metrics are sales growth, earnings growth, and momentum. By construction, 33% of the parent index constituents exclusively belong to each style, and 34% belongs to both styles. The growth style subset serves as S&P Small Cap 600 Growth Index and is rebalanced annually. It is capital-weighted, with an adjustment for constituents belonging to both styles. A company with a Value rank better than its Growth rank is given a larger weight in the Value Index than in the Growth Index. The fund’s turnover rate in the most recent fiscal year was 45%. I will use as a benchmark the parent index S&P Small Cap 600, represented by iShares Core S&P Small-Cap ETF (IJR).
The top 3 sectors are industrials (23.8% of asset value), consumer discretionary (18.4%) and technology (12.7%). Compared to the parent index, VIOG significantly overweights industrials, consumer discretionary and energy. It underweights mostly financials, real estate, and utilities.
VIOG sector breakdown (Chart: author; data: Vanguard, iShares)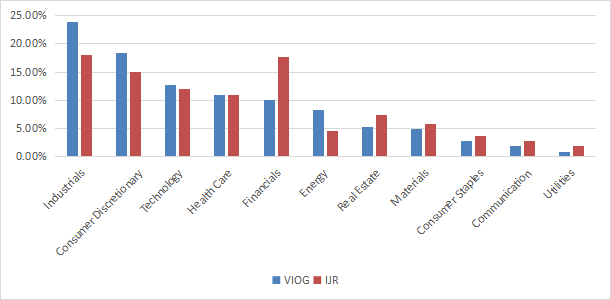
The top 10 holdings, listed in the next table with growth metrics, represent 10.8% of asset value. The largest position weighs 1.39%, so risks related to individual companies are low.
Ticker | Name | Weight% | EPS Growth %TTM | EPS Growth %5Y | Sales Growth %TTM | Sales Growth %5Y |
Fabrinet | 1.39% | 9.49 | 24.38 | 9.81 | 14.03 | |
Applied Industrial Technologies, Inc. | 1.22% | 22.38 | 19.62 | 7.15 | 7.50 | |
SPS Commerce, Inc. | 1.21% | 17.71 | 20.97 | 19.08 | 16.68 | |
The Ensign Group, Inc. | 1.14% | -8.04 | 16.56 | 24.49 | 15.87 | |
Meritage Homes Corp. | 1.09% | -25.52 | 28.99 | -2.45 | 11.71 | |
DoubleVerify Holdings, Inc. | 1.00% | 1.64 | N/A | 25.84 | N/A | |
Mueller Industries, Inc. | 0.98% | -8.75 | 42.19 | -14.11 | 6.40 | |
Boise Cascade Co. | 0.96% | -43.80 | 87.73 | -18.47 | 6.48 | |
ATI Inc. (Texas) | 0.93% | 187.91 | 11.74 | 8.80 | 0.62 | |
Abercrombie & Fitch Co. | 0.92% | 849.79 | -11.66 | 10.06 | 1.15 |
VIOG is more expensive than the benchmark regarding valuation ratios and has better growth metrics, in line with the underlying index description. As reported in the next table, the gap in cash flow growth is the most impressive, although this factor is not taken into account by the methodology.
VIOG | IJR | |
P/E TTM | 15.22 | 14.64 |
Price/Book | 2.45 | 1.67 |
Price/Sales | 1.51 | 0.92 |
Price/Cash Flow | 9.74 | 8.02 |
Earnings growth | 27.44% | 20.75% |
Sales growth % | 9.39% | 5.53% |
Cash flow growth % | 20.94% | 9.85% |
Data source: Fidelity
In my ETF reviews, risky stocks are companies with at least 2 red flags among: bad Piotroski score, negative ROA, unsustainable payout ratio, bad or dubious Altman Z-score, excluding financials and real estate where these metrics are unreliable. With this assumption, risky stocks weigh 12% of asset value. According to my calculation (reported below), aggregate quality metrics are superior to the small-cap benchmark.
VIOG | IJR | |
Altman Z-score | 5.10 | 3.67 |
Piotroski F-score | 5.72 | 5.64 |
ROA % TTM | 6.99 | 5.43 |
Since 10/1/2010 VIOG has outperformed IJR by 48 bps in annualized return, as reported in the next table. It also shows slightly lower risk metrics (drawdown and volatility).
Total Return | Annual.Return | Drawdown | Sharpe ratio | Volatility | |
VIOG | 356.63% | 12.00% | -41.73% | 0.63 | 18.45% |
IJR | 331.40% | 11.52% | -44.36% | 0.6 | 19.15% |
VIOG is ahead of IJR by about 5% over the last 12 months:
VIOG vs IJR, last 12 months (Seeking Alpha)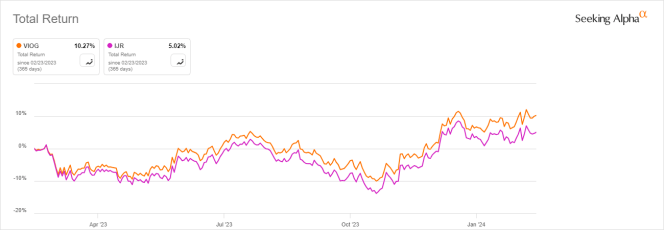
The next table compares characteristics of VIOG and five small-cap growth ETFs implementing other methodologies:
VIOG | VBK | IWO | ISCG | FYC | JSML | |
Inception | 9/7/2010 | 1/26/2004 | 7/24/2000 | 6/28/2004 | 4/19/2011 | 2/23/2016 |
Expense Ratio | 0.15% | 0.07% | 0.24% | 0.06% | 0.70% | 0.30% |
AUM | $714.10M | $31.38B | $11.07B | $533.01M | $259.86M | $206.20M |
Avg Daily Volume | $6.61M | $86.00M | $157.42M | $2.75M | $2.14M | $1.19M |
Holdings | 345 | 643 | 1071 | 1013 | 265 | 203 |
Top 10 | 10.85% | 8.18% | 8.45% | 5.05% | 8.34% | 25.85% |
Turnover | 45.00% | 24.00% | 35.00% | 52.00% | 140.00% | 105.00% |
The next chart compares their total returns, starting on 2/29/2016 to match all inception dates. VIOG is in the middle of the pack, less than 1% behind the best performer (JSML) regarding annualized return. It is also marginally behind VBK, another passively managed fund by Vanguard with a longer track record, a lower fee, a much better liquidity, a better diversification and a lower turnover. VBK tracks the CRSP US Small Cap Growth Index.
VIOG vs competitors, since 2/29/2016 (Seeking Alpha)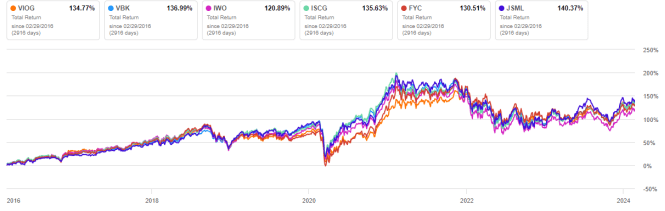
Over the last 12 months, VIOG is second to last:
VIOG vs competitors, trailing 12 months (Seeking Alpha)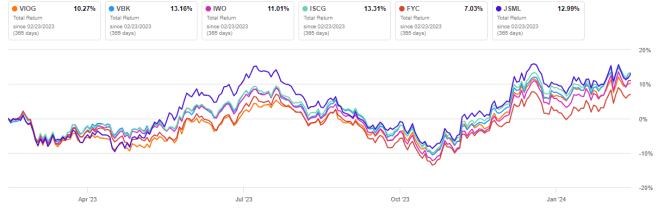
Vanguard S&P Small-Cap 600 Growth Index Fund ETF holds 300+ stocks of the S&P Small-Cap 600 Index with high growth metrics relative to peers. IJT and SLYG are direct competitors tracking the same index. The portfolio is well diversified across sectors and holdings, quality metrics are superior to the benchmark, and the fund has outperformed the S&P 600 benchmark since inception. On the downside, historical performance is average compared to peers. In particular, another small-cap growth fund by Vanguard (VBK) shows similar performance since 2016 for a lower fee and with higher trading volumes.