
KanawatTH
KanawatTH
iShares MSCI EAFE Growth ETF (BATS:EFG) started investing operations on 08/01/2005 and tracks the MSCI EAFE Growth Index. It has 397 holdings, a 30-day SEC yield of 1.25%, and a total expense ratio of 0.36%. Distributions are paid semi-annually.
As described in the prospectus by iShares, the underlying index is a subset of the MSCI EAFE Index (“parent index”), a developed market index excluding the U.S. and Canada. MSCI definition of value and growth styles has similarities with the methodology used by S&P. In both cases, a value score and a growth score are calculated for every company in the parent index, then value and growth subsets are defined based on these scores. These subsets are overlapping: when a company belongs to both styles, it is given a larger weight in the Growth Index than in the Value Index when the value score is greater than the growth score.
However, the metrics used by MSCI and S&P to calculate the scores are different. In particular, S&P uses only 3 factors including momentum in its growth score, whereas MSCI uses 5 factors exclusively based on fundamentals:
In summary, MSCI implements a growth strategy ignoring price momentum and more sophisticated regarding fundamentals. Ignoring momentum helps keep the fund’s turnover rate quite low: it was 19% in the most recent fiscal year. Funds tracking S&P growth indexes often show turnover rates over 40%.
This article will use as a benchmark the parent index, represented by iShares MSCI EAFE ETF (EFA).
The portfolio is mostly invested in large and mega-cap companies (about 90% of asset value.
The next chart lists the top 13 countries, representing over 96% of assets. Japan is the heaviest country by far, yet not overweight (22.7% of assets). The geographical allocation is very close to the parent index, but EFG overweights Northern Europe (Netherlands, Denmark, Sweden) and underweights the South (Italy and Spain).
Geographical allocation in % of asset value (Chart: author; data: iShares)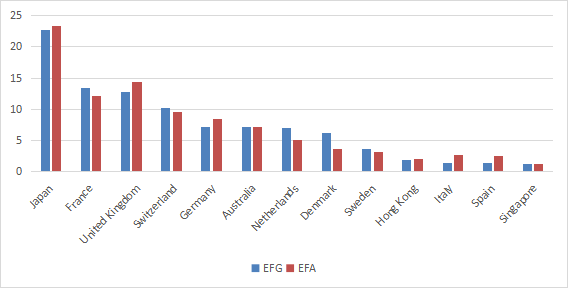
The top 4 sectors are well-balanced: industrials, consumer discretionary, technology and healthcare are between 15.5% and 18.6%. Consumer staples and financials are in a 10%-12% range, and other sectors are below 6%. Compared to the benchmark, EFG massively underweights financials and almost ignores real estate, utilities, and energy. Disregarding momentum is likely helping the better balance between the top sectors, as the strategy is mostly blind to sector trends.
Sector breakdown in % of asset value (Chart: author; data: iShares)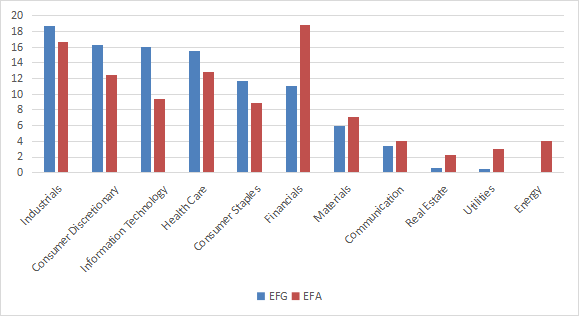
The top 10 holdings, listed in the next table, represent 25.4% of asset value, which is more than in EFA (15.5%). The top name (4.59%) is also materially heavier than in the benchmark (2.41%). The portfolio is more concentrated than the parent index. Nevertheless, the risks related to individual companies are moderate.
Name | Weight (%) | Sector | Exchange | Local Ticker* |
Novo Nordisk | 4.59 | Healthcare | Omx Copenhagen | NOVO B |
ASML Holding N.V. | 4.36 | Technology | Euronext Amsterdam | ASML |
Nestle S.A. | 3.28 | Staples | SIX Swiss Exchange | NESN |
LVMH | 2.89 | Discretionary | Euronext Paris | MC |
AstraZeneca PLC | 2.31 | Healthcare | London Stock Exchange | AZN |
SAP | 2.25 | Technology | Xetra | SAP |
Commonwealth Bank of Australia | 1.46 | Financials | ASX | CBA |
Toyota Motor Corporation | 1.44 | Discretionary | Tokyo Stock Exchange | 7203 |
Schneider Electric | 1.42 | Industrials | Euronext Paris | SU |
L'Oreal S.A. | 1.35 | Staples | Euronext Paris | OR |
*You can type or paste the company name in Seeking Alpha search box to find US tickers when available.
EFG is significantly more expensive than EFA regarding valuation ratios, as reported in the next table. Unexpectedly, the trailing 12-month earnings growth is not better than the benchmark. Sales growth and cash flow growth are higher, though.
EFG | EFA | |
P/E TTM | 22.36 | 14.15 |
Price/Book | 3.51 | 1.76 |
Price/Sales | 2.54 | 1.38 |
Price/Cash Flow | 17.95 | 9.8 |
Earnings growth TTM | 16.26% | 16.57% |
Sales growth % | 10.03% | 8.41% |
Cash flow growth % | 7.92% | 4.97% |
Data source: Fidelity.
Since its inception in 2005, EFG has outperformed the parent index, and also iShares MSCI EAFE Value ETF (EFV).
EFG vs EFA, EFV, total return since inception (Seeking Alpha)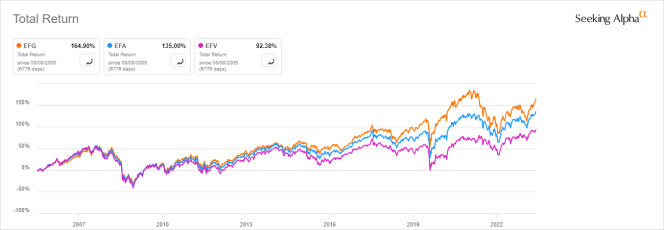
Nevertheless, it has not been constantly outperforming. It is lagging over a 3-year time frame:
EFG vs EFA, EFV, 3-year total return (Seeking Alpha)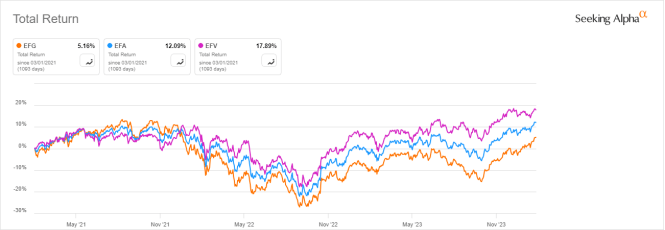
The next table compares characteristics of EFG and five factor-based ex-U.S. ETFs with at least 5 years of price history:
EFG | JIRE | TLTD | UIVM | IDMO | PIZ | |
Inception | 8/1/2005 | 10/28/1992 | 9/25/2012 | 10/24/2017 | 2/23/2012 | 12/28/2007 |
Expense Ratio | 0.36% | 0.24% | 0.39% | 0.35% | 0.25% | 0.80% |
AUM | $11.88B | $5.78B | $509.59M | $237.56M | $142.52M | $128.44M |
Avg Daily Volume | $75.29M | $31.75M | $807.51K | $796.41K | $1.58M | $651.17K |
Holdings | 417 | 206 | 2651 | 224 | 209 | 113 |
Top 10 | 25.33% | 20.38% | 8.14% | 8.98% | 27.45% | 26.45% |
Turnover | 19.00% | 16.00% | 22.00% | 105.00% | 131.00% | 144.00% |
EFG is the largest (in assets) and most liquid (in dollar volume) of this group. The next chart compares total returns since 1/1/2018. EFG is the second best performer, behind the momentum fund IDMO and shortly ahead of JIRE.
EFG vs competitors since 1/1/2018 (Seeking Alpha)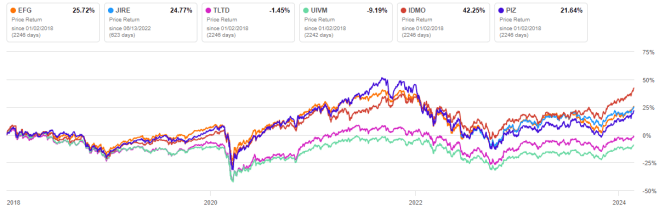
Over the last 12 months, IDMO is the winner again and EFG comes in third position close behind PIZ.
EFG vs competitors, last 12 months (Seeking Alpha)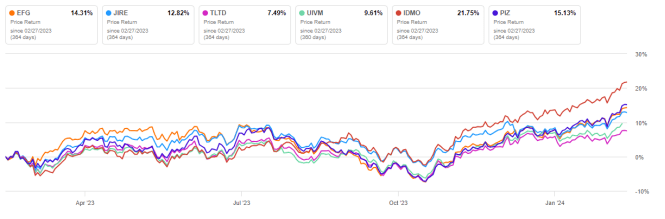
iShares MSCI EAFE Growth ETF is invested in almost 400 companies from ex-US developed markets based on a growth score including 5 fundamental metrics. Unlike other growth ETFs, it disregards momentum. EFG is quite heavy in Japanese companies, but well-diversified across countries, sectors and holdings. Unexpectedly, growth metrics are not overwhelming relative to the parent index. EFG has outperformed the benchmark since inception. Since 2018, EFG has outperformed a number of factor-based ETFs in the same stock universe, but it is behind Invesco S&P International Developed Momentum ETF (IDMO).