
Igor Kutyaev
Igor Kutyaev
Emerging markets ("EM") have lagged U.S. equities for years, but some analysts think they will outperform in the next decade. A number of exchange-traded funds, or ETFs, provide exposure to emerging countries, but all are not equals.
Schwab Fundamental Emerging Markets Large Company Index ETF (NYSEARCA:FNDE) started investing operations on 08/15/2013 and tracks the Russell RAFI™ Emerging Markets Large Company Index. The fund has 391 holdings, a trailing 12-month distribution yield of 5.16% and an expense ratio of 0.39%. Distributions are paid semi-annually.
As described in the prospectus by Charles Schwab Asset Management:
The index selects, ranks, and weights securities by fundamental measures of company size - adjusted sales, retained operating cash flow, and dividends plus buybacks (...) Securities are grouped in order of decreasing score and each company receives a weight based on its percentage of the total scores of the emerging markets companies within the parent index (…) The top 87.5% of the companies by cumulative fundamental score are included in the index.
The portfolio is split into four segments, which are reconstituted separately on an annual basis in four quarterly partial reconstitutions. The portfolio turnover rate was 28% in the most recent fiscal year.
The fund is mostly invested in large and mega-cap companies (almost 90% of asset value). China is by far the heaviest country with 34.4%, followed by Taiwan (19.4%), Brazil (12.4%) and India (11.7%). Other countries are below 5%. Asian countries together weigh over 70%. Exposure to geopolitical and regulatory risks related to China is very high: the aggregate weight of China and Taiwan is 53.7%. The next chart lists the top 10 countries, representing 94.1% of assets. Compared to the EM benchmark iShares MSCI Emerging Markets ETF (EEM), FNDE overweights China, Taiwan and Brazil. It underweights India and ignores South Korea.
FNDE country allocation (chart: author; data: Schwab, iShares.)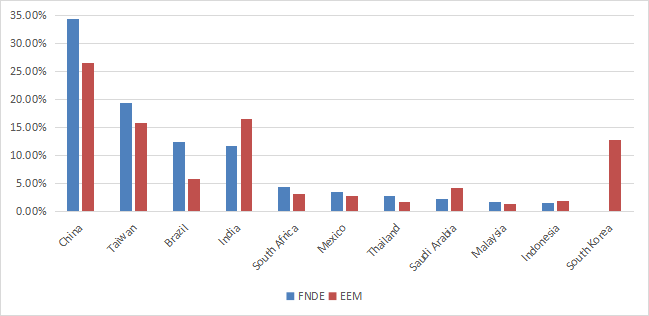
The heaviest sector is financials (26.7%), followed by technology (16.7%), energy (15%) and materials (11.7%). Compared to EEM, the fund overweights financials, energy and materials. It underweights mostly technology, consumer discretionary, industrials, and almost ignores healthcare.
FNDE sector breakdown (chart: author; data: Schwab, iShares)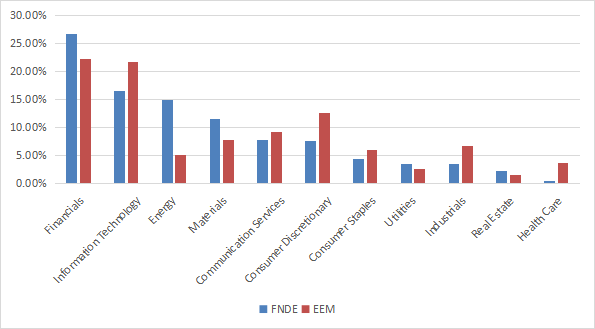
As reported in the next table, FNDE is much cheaper than the benchmark regarding valuation ratios.
FNDE | EEM | |
Price / Earnings TTM | 8.01 | 12.66 |
Price / Book | 0.9 | 1.55 |
Price / Sales | 0.54 | 1.31 |
Price / Cash Flow | 4.31 | 8.09 |
(data source: Fidelity.)
The top 10 holdings, listed below, represent 24.2% of asset value. The largest position weighs 4.05%, so risks related to individual companies are low to moderate.
Name | Weight% | Country | Sector |
TAIWAN SEMICONDUCTOR MANUFACTURING | 4.05 | TW | Information Technology |
CHINA CONSTRUCTION BANK CORP H | 3.32 | CN | Financials |
HON HAI PRECISION INDUSTRY LTD | 2.79 | TW | Information Technology |
VALE SA | 2.47 | BR | Materials |
PETROLEO BRASILEIRO PREF SA | 2.41 | BR | Energy |
TENCENT HOLDINGS LTD | 2.13 | CN | Communication Services |
INDUSTRIAL AND COMMERCIAL BANK OF | 1.95 | CN | Financials |
ALIBABA GROUP HOLDING LTD | 1.92 | CN | Consumer Discretionary |
PETROLEO BRASILEIRO SA | 1.71 | BR | Energy |
CHINA PETROLEUM AND CHEMICAL CORP | 1.50 | CN | Energy |
FNDE has outperformed EEM by 1.2% in annualized return since inception:
Total Return | Annual Return | Drawdown | Sharpe ratio | Volatility | |
FNDE | 44.44% | 3.62% | -43.55% | 0.22 | 18.99% |
EEM | 27.76% | 2.40% | -39.82% | 0.15 | 17.46% |
Calculations: Portfolio123.
It beats the benchmark by over 5% in 2023 to date:
FNDE vs EEM, year-to-date (Seeking Alpha)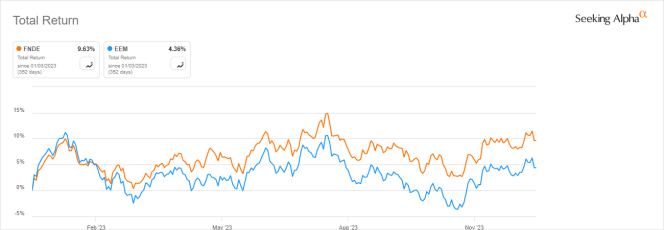
The next table compares characteristics of FNDE and five other emerging markets funds with various investing styles:
FNDE | AVES | DFAE | EEMV | DGRE | DGS | |
Inception | 8/15/2013 | 9/29/2021 | 12/1/2020 | 10/18/2011 | 8/1/2013 | 10/30/2007 |
Expense Ratio | 0.39% | 0.36% | 0.35% | 0.25% | 0.32% | 0.58% |
AUM | $5.35B | $330.46M | $3.30B | $4.22B | $117.48M | $3.02B |
Avg Daily Volume | $17.60M | $1.18M | $17.63M | $25.70M | $415.00K | $6.83M |
Dividend Yield | 5.16% | 4.13% | 2.52% | 2.86% | 1.68% | 4.39% |
FNDE is the largest in assets and the second most liquid in dollar volume. It has the highest yield and an above-average expense ratio.
The next chart compares the funds in recent market conditions (2-year total returns). FNDE is in the middle of the pack. The best performer is the small-cap fund DGS.
FNDE vs. Emerging Market ETFs, 2-year total return (Seeking Alpha)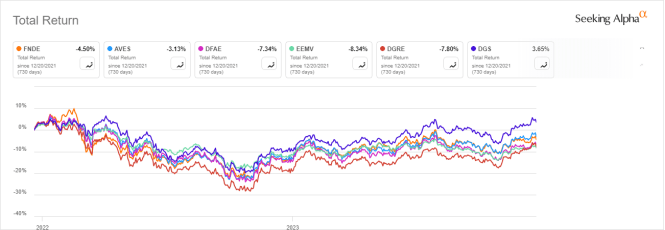
Schwab Fundamental Emerging Markets Large Company Index ETF is invested in almost 400 companies listed in emerging markets. Holdings are selected and weighted mostly based on sales, cash flow, dividend yield and buybacks. It is well diversified across holdings and shows attractive valuation metrics, but it is overweight in financials, and most importantly, in China (like many emerging markets funds). The aggregate weight of China and Taiwan is over 50%, pointing to a high geopolitical risk exposure. Some EM funds like iShares MSCI Emerging Markets ex China ETF (EMXC) and WisdomTree Emerging Markets Quality Dividend Growth Fund (DGRE) exclude Chinese stocks. Past return looks attractive relative to the benchmark EEM, but recent performance is average among competitors.
In conclusion, I don't find broad EM funds really attractive, and Schwab Fundamental Emerging Markets Large Company Index ETF is no exception. From a risk management perspective, it makes more sense to build an equal-weight portfolio of several country ETFs focused on Latin America and South Asia.