
jiefeng jiang
jiefeng jiang
For anyone but the most distracted observer, it's obvious that Chinese stocks have been under a lot of pressure. The Hang Seng, Hong Kong Stock Exchange's main index, now sits around the same levels first reached in 1997, 27 years ago.
Yahoo Finance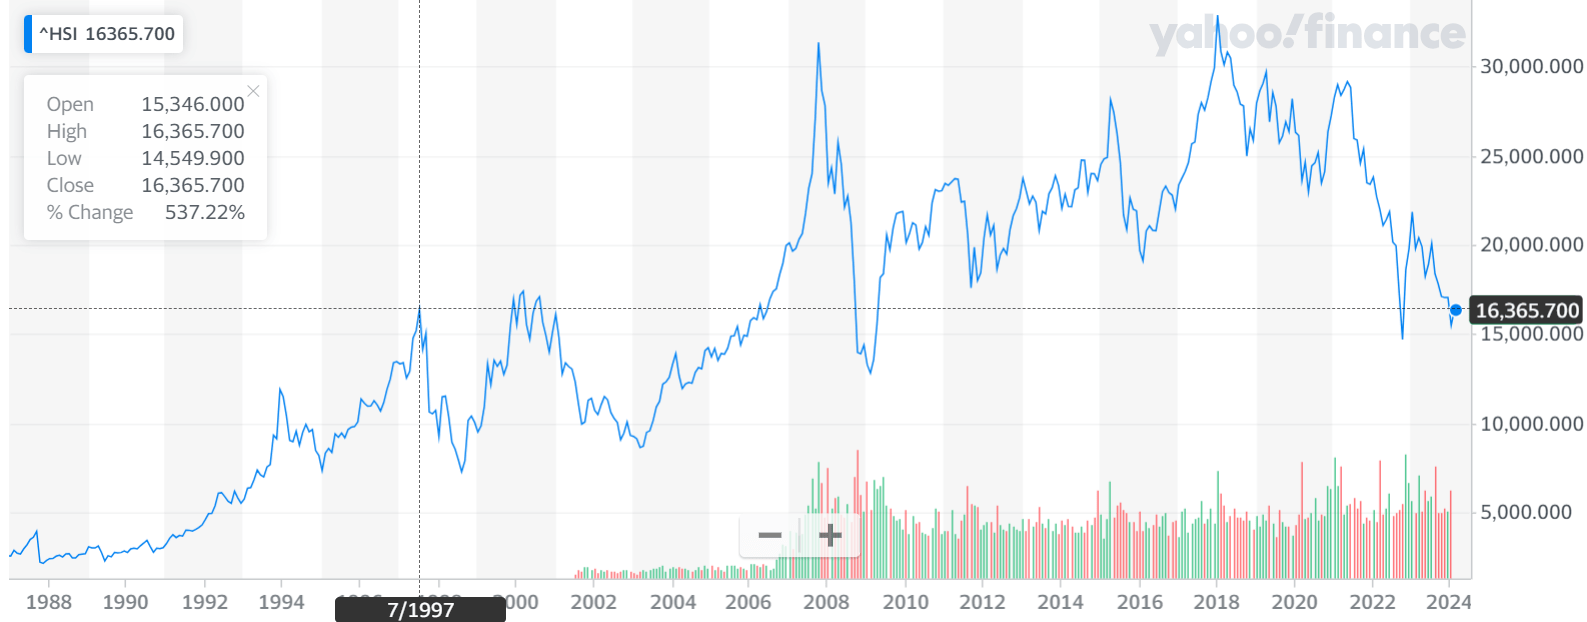
In large measure, this has happened as a result of extreme anti-China sentiment, which itself mostly exists because in December 2017, the United States decided to label China a strategic competitor. And soon after, actions taken by US authorities (trade war, stock delistings, Huawei blockade, semiconductor blockade, negative media messaging) created the most negative environment I've ever seen any country exposed to.
This sentiment has driven Chinese stocks lower, and above all, punished Hong Kong stocks -- which foreign investors have the most exposure to. It punished Hong Kong stocks so much, that when Chinese stocks have dual listings simultaneously in Shanghai and Hong Kong, the Shanghai equivalents are 53% more expensive (versus 57% days ago).
True, a large real estate bubble has existed in China, which started deflating already in 2021. Plus there was extreme disruption from COVID-19 shutdowns.
But still, by and large Chinese companies continued growing and conquering new markets. As well as generating cash and, often, paying dividends. So it's not like these companies truly lost intrinsic value.
This was how we arrived at the present, where it's my opinion that the iShares China Large-Cap ETF (NYSEARCA:FXI) (for larger capitalizations) or the iShares MSCI China Small-Cap ETF (NYSEARCA:ECNS) (for smaller capitalizations) represent good, diversified proxies for betting on a recovery of the Hong Kong market. ECNS trades at lower multiples (7.3x Price/Earnings) and has a higher yield (5.8%), mostly due to the worldwide trend towards indexation punishing smaller caps.
Furthermore, one can do even better. For instance, at my subscription service, we hold 16 different Hong Kong-listed names with EV/EBITDAs between deeply negative (indicating net cash + investments well in excess of market capitalization) and 3.3x. For comparison, the average EV/EBITDA for the US market is 16.5x. And these are profitable, mostly growing, stable, dividend paying stocks (with dividend yields ranging from 3.8% to 18.9%, all likely sustainable). Those are extraordinarily cheap -- irrational, even -- valuations.
There are many different negative arguments on China doing the rounds. In this section, I'll try to address a few such arguments, for those seeking answers for them.
One of the main arguments put forth to claim China overstates its GDP, is an old study (covering 1992-2006) which tries to measure countries’ GDP by looking at night luminosity. And it’s also often used to show autocracies lie more about their economic growth.
This seems like a decent argument until you consider that even the (old) study making this claim says that the effect is mostly present in 1992-1996 and disappears afterwards.
The purple line shows that real GDP growth is consistently overstated, particularly in the years before 1996. The green line (with the included growth trend) shows overstated growth before 1996; it also is much more volatile from year to year, moving more as one would expect real GDP growth to move. After 1996, however, the green line tracks the black line (the official growth rate) closely; this supports the other indexes’ conclusions that quarter-to-quarter fluctuations in Chinese real GDP growth are smoothed, but likely move in the correct direction.
At the same time, other articles can be found which claim there are inexactitudes with the method, applying China as their example and suggesting corrections which capture more of the underlying activity.
And indeed, the whole idea that China's GDP is overstated conflicts with the observation that China's power generation now sits 100% higher than the United States', even though the latter is supposed to have a higher GDP than the former, and the former is supposed to be overstated to boot.
Even further, just as there are articles claiming China’s GDP is overstated, there are also articles claiming exactly the opposite due to China’s archaic GDP calculation methodology actually understating GDP, mostly due to a severe undercounting of household services consumption. The following is an interesting quote from the article:
Or is it? China also accounts for over 30% of cars sold globally, over 20% of mobile phones, over 40% of televisions and 25% of furniture. Drill down in just about any consumer category, excluding firearms, and China will likely be consuming well over 20% of the global total.
Indeed, mere observation of reality would tell us China’s GDP is much more likely to be understated than overstated (at least when compared to US GDP). Looking at myriad markets on the consumption or production sides, be them housing, autos, smartphones, mobile telephony, food, clothing, all sorts of appliances, etc., it’s plain to see that China’s markets are often the world’s largest by a large margin. It’s then quite difficult to think that in spite of this, China’s economy would actually be smaller than the US economy.
This also brings us to the use of PPP (Purchasing Power Parity)-adjusted GDP, where China already emerges as the largest economy in the world. This is to be expected, as when adjusted by PPP, what counts is quantities, not the value of the goods and services, where often similar goods and services are delivered at vastly different prices depending on the country.
If one tries to despise PPP adjustments, an obvious problem immediately emerges. Why, within the same country, does one report GDP growth in real terms? It’s exactly to remove the effect of price changes on the value reported. If such adjustment is needed within the same country, then sure enough, to compare across countries a PPP adjustment is also fully necessary.
In short, the whole “GDP is overstated” mantra is mostly irrelevant. And indeed, for investors it’s much more relevant to look at the companies one invests in, than at these wild, hard to prove, macro mantras. Indeed, were the opposing camp to be right (and China’s GDP to be understated – even while not considering PPP adjustments), then a lot of the concerns about China would, themselves, be overstated, namely:
The issues don’t stop here. Consider that healthcare represents 17.5% of the US GDP, versus 7.0% in China. Yet, China’s life expectancy sits at 78 years, versus 76 years for the US. And China’s HALE (Healthy Life Expectancy) sits at 68.5 years, versus 66.1 years in the US. As a result, the extra 10.5% of GDP in healthcare spending in the US buys nothing. Arguably, there’s 10.5% of the US GDP there which isn’t materially much different from digging holes to plug them afterwards. Maybe one ought to worry about that instead?
Furthermore, people will also not know it, but a large component of GDP both in the US and China is represented by owner’s imputed rents, or the rents homeowners “pay themselves.” This represents 9.3% of the US GDP. In China, this is less than 4%. That’s more than 5% in comparative “fluff” GDP just there. To add to the 10.5% from healthcare. And these are just 2 out of many possible examples.
Finally, there’s a growing consensus that China’s GDP reporting has become better over time. And also, although China’s reporting might have been less unreliable, at the same time China has been less prone to use adjustments which reduce deflators and increase reported real growth, such as quality adjustments, substitution effects, etc.
Yes, China’s total debt/GDP already overshadows the US, and is seemingly quite high. However, here’s the problem:
In other words, the overall indebtedness problem is, itself, not as large as it would otherwise seem. And this is all without even taking into account that Chinese GDP might be understated, in which case all debt/GDP ratios will, themselves, be overstated.
This claim appears in many forms, namely due to websites like Numbeo.com having questionable data. Numbeo is:
“Numbeo is the world’s largest cost of living database. Numbeo is also a crowd-sourced global database of quality of life data: housing indicators, perceived crime rates, healthcare quality, transport quality, and other statistics.
9,158,505 prices in 11,582 cities entered by 787,278 contributors”
In other words, it’s a crowd-sourced database that’s not particularly populated and which follows no method to even collect or present data in a statistically meaningful way. And worse still, the website doesn’t even have a Chinese version. It’s likely Numbeo isn’t reliable even for US data (on housing prices and incomes), never mind China.
While, certainly, real estate being expensive of cheap will be a function both of local incomes, housing prices and interest rates, we can however try to generalize broadly to entire countries. And what happens if we do that?
In the United States, the average wage (salary) is $59,400. In China, the average wage is 114,000 RMB.
In the United States, the average home sales price is $495,000. In China, the average home price is 9,991 RMB/sqm and the average home is 60 sqm.
These statistics, which are naturally crude for a number of reasons, would indicate the US average home takes 8.3 years of the US average salary in the US to buy, and the average Chinese home now takes 5.3 years of the average Chinese wage to buy. Even a 90 sqm home, in China, 50% larger than the existing average home, would still "only" take 7.9 years of the average Chinese wage to buy. In short, Chinese residential real estate can hardly be called the most expensive in the world, and at times it doesn't even look bubblish anymore.
Additionally, in China new mortgages are presently set at a 4.20% interest rate. In the US, they’re at 6.30 (15y)-6.90% (30y) right now.
A disclaimer is warranted here, of course. The average home in the US is much larger. Average salaries and house prices can be less relevant for most than median salaries and median house prices (the median data is hard to find for China). Interest rates will affect affordability substantially (these are lower in China). And of course, home prices and wages vary massively according to location, be it in the US or China.
A cursory look would show China is the biggest consumer and producer for nearly all types of goods. Autos, TVs, smartphones, all kinds of appliances, etc. And the same would hold true for nearly all kinds of services which are reliant on population numbers. So, food, mobile phone service, clothing, etc. China’s economy can’t, by definition, be so reliant on real estate, and yet China be producing and consuming the most of nearly anything.
Also again, if the theory on China’s GDP being understated is true (due to understated consumption), then the size of the real estate industry is otherwise overstated, and the problem is smaller than it seems.
Still, one could say that estimates regarding the importance of real estate investment to China's economy are all over the place, ranging from 6% to 20% (though here, instead of "real estate investment", there's talk of "activity") of the economy. In any case, looking at IMF's own projections, a large part of the correction seems done already (notice the indication of a potential 45% drop is from 2022's level):
IMF.org
This stands in stark contrast with reality. The reality is that the Chinese government itself enacted several restrictive rules over 2 decades to slow down what it saw as a real estate bubble.
Even now, the reduction in those restrictions is to levels which one would otherwise continue to see as too restrictive.
Consider, for instance, that by law the minimum downpayment on a home in China is 20% for first homes, and 30% for second homes. And these are already the limits which were reduced recently (August 2023). And cities can (and do) set minimum thresholds above these.
For example, Beijing just recently lowered these limits to 30% (1st home) and 50% (second home), and Shanghai reduced these requirements to 30% and 40%, respectively. Imagine that: mandatory 30%-50% downpayments, depending on the case, and the opinion is that the real estate bubble is popping despite the CCP efforts…
It's easy to see that home buying policies are actually still extremely restrictive in China, and only now are those policies starting to be loosened to still-extremely restrictive levels!
Sure, China’s January 2024 CPI just printed at -0.8% yoy in January. But one should keep in mind that:
Some might think that holding H-Shares (Chinese stocks quoted in Hong Kong) is a problem. Far from this being a problem, this is an opportunity. There are many stocks which quote simultaneously in Shanghai and Hong Kong. In Shanghai these same stocks trade at a massive premium (57% as I wrote this) to themselves in Hong Kong. Which would you rather own?
Using past performance to say an asset is not worth investing in makes little sense, too. What one needs to look at is each company individually, or at least the overall market's valuations and prospects (which, for China, are for continued growth). And when one does that, one finds many, many examples of extreme, irrational even, valuations in Hong Kong.
These irrationally low valuations came to be, because in spite of the index having been punished extensively, companies continued to operate, to generate profits, to distribute profits and to accumulate cash.
At this point, when selecting individual equities, one can find many companies in Hong Kong trading for negative EVs (Enterprise Values), meaning they have more net cash plus investments than they’re worth in the market (market capitalization). That is, their businesses are valued at less than zero, even while these companies are often sustainably profitable, growth steadily, pay large dividends (and have done so for many years), etc. It’s actually quite incredible. This is even more evident in the smaller market capitalizations, but obviously even the large market capitalizations owned by FXI are broadly undervalued.
There’s also no reason to think foreigners are somehow treated worse for the same asset class – and that includes not just stocks but also debt instruments (including those of Evergrande and Country Garden). However, it would take a specialist – and not generic media reports, to explain why the structures which issued this debt, and these debt instruments, aren’t being treated unfairly, and always traded at higher yields because of their structurally higher risk versus other debt issued by the same entities under different conditions and by different places in the corporate structure.
I think when it comes to China, the extremely negative sentiment is leading people to see what they want to see, not what’s there. Indeed, if China was as hopeless as the media, and many investors, paint it to be, there would be zero need to contain it through the many anti-China measures and negative press coverage we’ve been seeing ever since China was officially labeled a strategic competitor by the US in December 2017.
Instead, even now, China is continuing to expand and conquer new sectors, such as it’s doing with EVs and auto exports in general. Also even now, China has continued to open more markets and sectors to further foreign investment, as shown by the continued decline in China's "negative list" items.
While China might still have some real estate and excess investment imbalances and problems, these don’t look nearly as extreme as they’re painted in media in general.
In my view, Chinese equities, whether be it through FXI, ECNS or by picking individual stocks, represent a unique, secular, investment opportunity.