
Dilok Klaisataporn
Dilok Klaisataporn
This article series aims at evaluating ETFs (exchange-traded funds) regarding past performance and portfolio metrics. Reviews with updated data are posted when necessary.
iShares Russell Mid-Cap Growth ETF (NYSEARCA:IWP) started investing operations on 07/17/2001 and tracks the Russell Midcap Growth Index. It has 333 holdings, a trailing 12-month yield of 0.54%, and an expense ratio of 0.23%.
As described by FTSE Russell, the underlying index starts from the Russell Midcap Index (parent index), then selects and weights constituents using a growth score based on three metrics:
The methodology is simpler than for S&P growth indexes, which use 3 valuation metrics and 3 growth metrics. The index is reconstituted annually and the fund's turnover rate was 26% in the most recent fiscal year. This article will use as a benchmark the parent index Russell Mid-Cap Index, represented by iShares Russell Mid-Cap ETF (IWR).
The portfolio is quite balanced in its top 3 sectors: information technology, industrials, and healthcare weigh between 18.3% and 23.7% of asset value. Then, come consumer discretionary (13.7%) and financials (10.8%). Other sectors are below 5%. Compared to the parent index, the fund mostly overweights technology and healthcare. It massively underweights real estate, materials, utilities, and, to a lesser extent, financials.
IWP sector breakdown (Chart: author; data: Vanguard, iShares)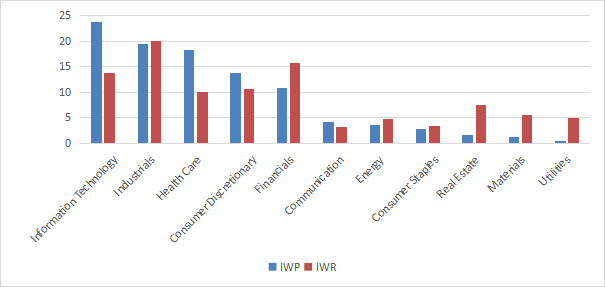
The portfolio is well diversified and risks related to individual companies are low. The top 10 holdings, listed in the next table with growth metrics, represent 15% of asset value, and the top name weighs only 2.1%.
Ticker | Name | Weight% | EPSgrowth %TTM | EPSgrowth %5Y | SalesGrowth %TTM | SalesGrowth %5Y |
CrowdStrike Holdings, Inc. | 2.1 | 146.22 | 20.32 | 36.33 | 65.00 | |
Apollo Global Management, Inc. | 1.7 | 250.65 | 96.49 | 382.21 | 95.45 | |
DexCom, Inc. | 1.55 | 60.29 | 41.21 | 24.49 | 28.56 | |
Palantir Technologies Inc. | 1.49 | 149.43 | 17.75 | 16.75 | 30.17 | |
Cintas Corporation | 1.44 | 12.19 | 13.11 | 9.76 | 6.36 | |
Copart, Inc. | 1.4 | 24.45 | 24.28 | 10.52 | 16.47 | |
Ross Stores, Inc. | 1.39 | 26.90 | 5.47 | 8.99 | 6.34 | |
IDEXX Laboratories, Inc. | 1.37 | 25.36 | 18.76 | 8.72 | 10.59 | |
W.W. Grainger, Inc. | 1.3 | 20.62 | 21.61 | 8.21 | 7.99 | |
IQVIA Holdings Inc. | 1.28 | 27.69 | 42.42 | 3.75 | 7.52 |
As expected from the methodology, IWP is more expensive than the benchmark regarding valuation ratios and has better growth metrics (reported in the next table). The largest gaps are in price/book (which is part of the strategy's growth score) and in cash flow growth (which is not).
IWP | IWR | |
P/E TTM | 26.73 | 19.72 |
Price/Book | 8.39 | 2.83 |
Price/Sales | 2.65 | 1.75 |
Price/Cash Flow | 20.03 | 13.11 |
Earnings growth | 21.11% | 17.81% |
Sales growth % | 12.68% | 7.65% |
Cash flow growth % | 22.14% | 11.76% |
Data source: Fidelity.
In my ETF reviews, risky stocks are companies with at least two red flags among bad Piotroski score, negative ROA, unsustainable payout ratio, and bad or dubious Altman Z-score, excluding financials and real estate where these metrics are unreliable. With this assumption, risky stocks weigh 15.5% of IWP asset value, which is not very good. However, according to my calculation of aggregate quality metrics (reported in the next table), the portfolio quality is significantly superior to the large and mid-cap index Russell 1000.
IWP | Russell 1000 | |
Altman Z-score | 9.47 | 3.74 |
Piotroski F-score | 6.41 | 5.91 |
ROA % TTM | 8.66 | 6.01 |
Since 08/01/2001 IWP has underperformed IWR. Nevertheless, there is not much difference in annualized return: 39 bps. As reported below, volatility (measured as the standard deviation of monthly returns) is a bit higher than for the benchmark.
Total Return | Annual Return | Drawdown | Sharpe ratio | Volatility | |
IWP | 613.82% | 9.09% | -56.92% | 0.5 | 18.73% |
IWR | 673.86% | 9.48% | -58.78% | 0.53 | 17.47% |
The growth ETF has outperformed by 7.7% over the last 12 months:
IWP vs IWR, last 12 months (Seeking Alpha)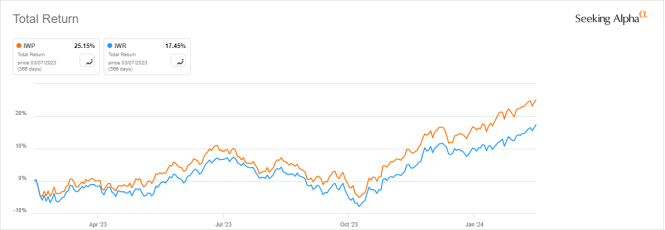
The next table compares the characteristics of IWP and four mid-cap growth ETFs with different methodologies:
IWP | IJK | VOT | IMCG | FNY | |
Inception | 7/17/2001 | 7/24/2000 | 8/17/2006 | 6/28/2004 | 4/19/2011 |
Expense Ratio | 0.23% | 0.17% | 0.07% | 0.06% | 0.70% |
AUM | $15.23B | $9.04B | $24.16B | $2.12B | $322.13M |
Avg Daily Volume | $95.36M | $32.46M | $39.83M | $12.27M | $1.03M |
Number of Holdings | 338 | 250 | 153 | 310 | 226 |
Assets in the Top 10 | 15.02% | 14.51% | 16.28% | 11.13% | 9.65% |
Turnover | 26.00% | 54.00% | 14.00% | 43.00% | 142.00% |
The next chart compares total returns, starting on 4/25/2011 to match all inception dates. IWP is the second best performer, shortly behind IMCG, which has a lower fee, but significantly lower trading volumes.
IWP vs competitors, since 4/25/2011 (Seeking Alpha)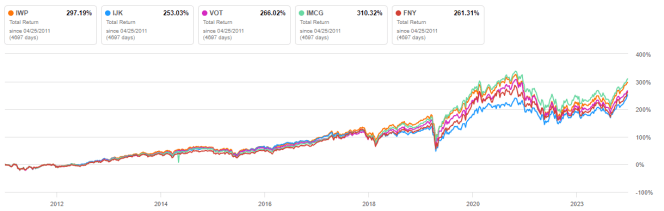
IWP has been the best performer over the last 12 months:
IWP vs competitors, 12-month total return (Seeking Alpha)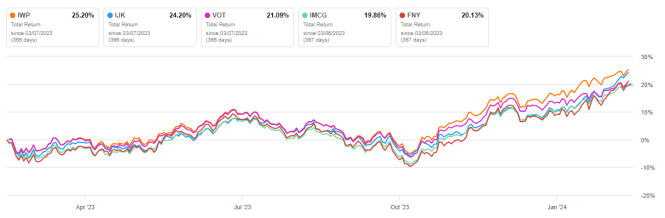
iShares Russell Mid-Cap Growth ETF uses price-to-book, projected earnings growth, and historical sales growth to select stocks in the Russell Mid-Cap Index. The portfolio is well-diversified across sectors and holdings. Not only growth metrics, but also quality metrics look good. Historical performance is shortly behind the benchmark, so the methodology has failed to bring excess return in 22 years.
However, IWP has outperformed a number of competitors in 13-year and 12-month time frames. Moreover, iShares Russell Mid-Cap Growth ETF has the highest average trading volume among mid-cap growth ETFs, which makes it a good instrument for swing trading and tactical allocation strategies switching between growth and value styles.