
MicroStockHub
MicroStockHub
This article continues my coverage of the Vanguard High Dividend Yield ETF (NYSEARCA:VYM), a fund with a 2.99% trailing dividend yield, 0.06% expense ratio, and $63 billion in assets under management. Three months ago, I rated VYM a solid "hold" for income and value investors but cautioned its 5.38% estimated earnings growth rate was shrinking fast, and that may not be enough to support adequate dividend growth moving forward. While this remains the case for nearly all large-cap value ETFs, and shareholders should also consider other complementary growth-focused funds, today's update highlights how VYM's growth rates have held up better than most in its category, which includes the popular Schwab U.S. Dividend Equity ETF (SCHD). VYM is your 3% yielding, well-diversified, and well-balanced dividend ETF, and I am comfortable upgrading my rating to a "buy" based on the limited options available to income investors.
VYM tracks a proprietary Index derived from the FSE Global Equity Index series, selecting U.S. securities across nearly the entire U.S. investable equity universe. One notable exception is the exclusion of REITs, thereby ensuring all distributed income is qualified for income tax purposes. You can confirm this by heading over to the Vanguard Tax Center and filtering for VYM:
Vanguard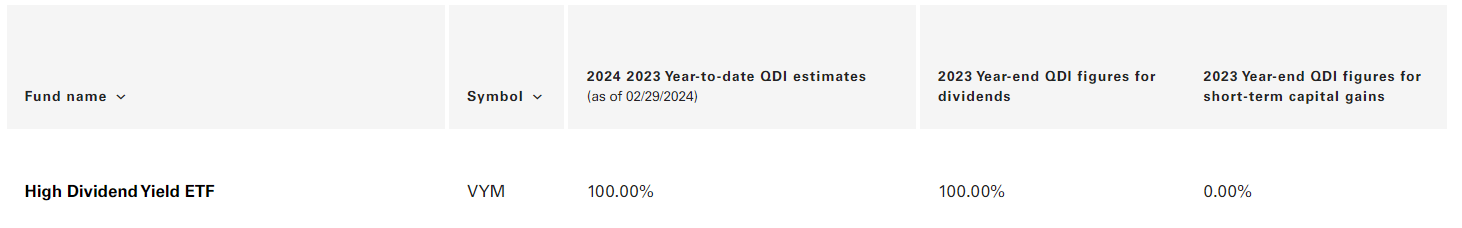
While the Index is proprietary, VYM's fact sheet indicates selections are based on forecasted dividend yields. Reconstitutions are annual and low turnover is prioritized, meaning the stocks held today are a reasonable representation of what they'll be next year. Over the last five fiscal years, portfolio turnover has ranged between 6% and 11%.
Vanguard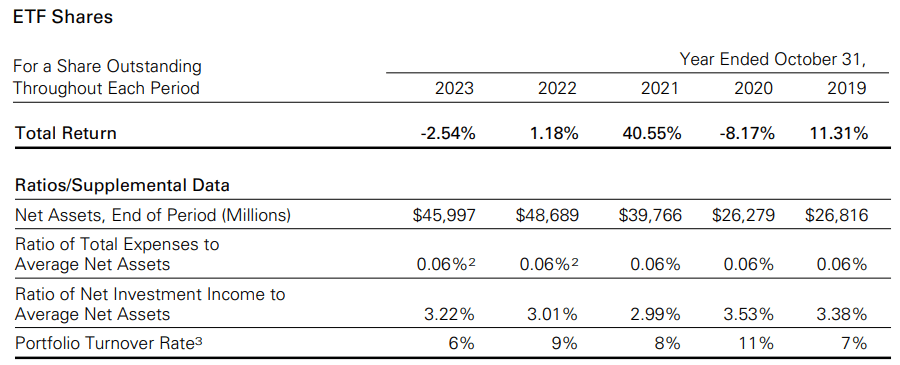
VYM holds 300+ securities, making it one of the best-diversified dividend funds on the market. Sector diversification is solid, too. Financials is the largest at 21.60%, followed by Consumer Staples (12.24%), Industrials (12.05%), and Health Care (12.02%).
Vanguard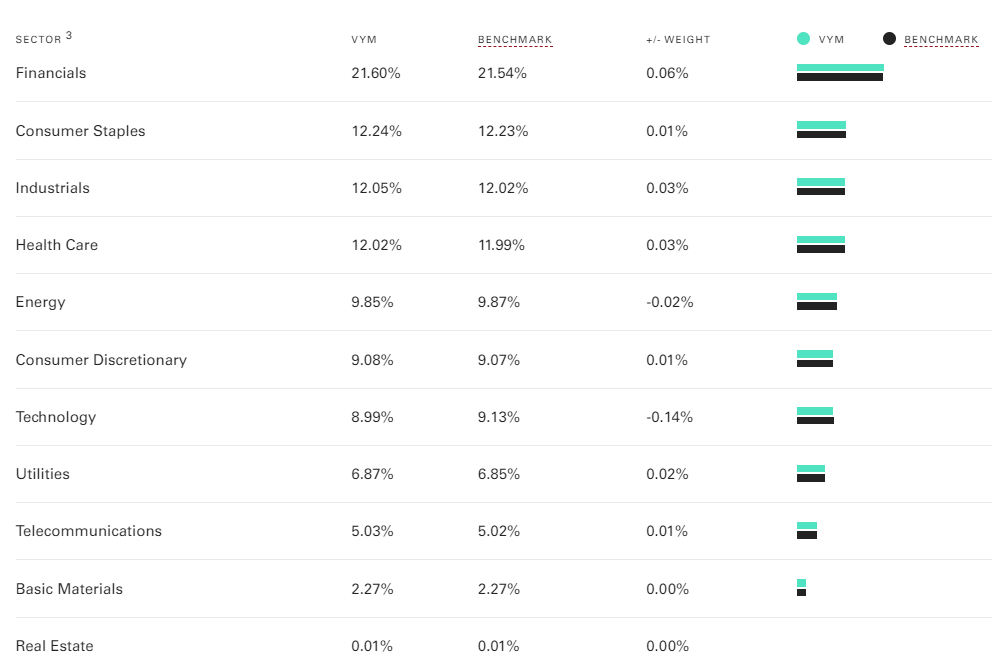
These sector allocations are as of January 31, 2024, so they are slightly outdated. However, after agreeing to Vanguard's terms and conditions, I viewed VYM's Portfolio Composition File and calculated the latest weights, which I will refer to for the remainder of the analysis. The most significant changes were an increase in Technology (8.99% to 11.29%) and a decrease in Consumer Discretionary (9.08% to 6.71%). Broadcom (AVGO) is now VYM's top holding with a 4.15% compared to 3.58% one month ago.
VYM is primarily a large-cap value ETF. Although size definitions vary across providers, its weighted average and average market caps are $189 billion and $35 billion, respectively. The difference between the two figures illustrates how size at least partially determines a security's weight in the Index. Also, Vanguard highlights how 71.7% of the portfolio by weight is in the "large" category, with market caps above $57.494 billion.
Vanguard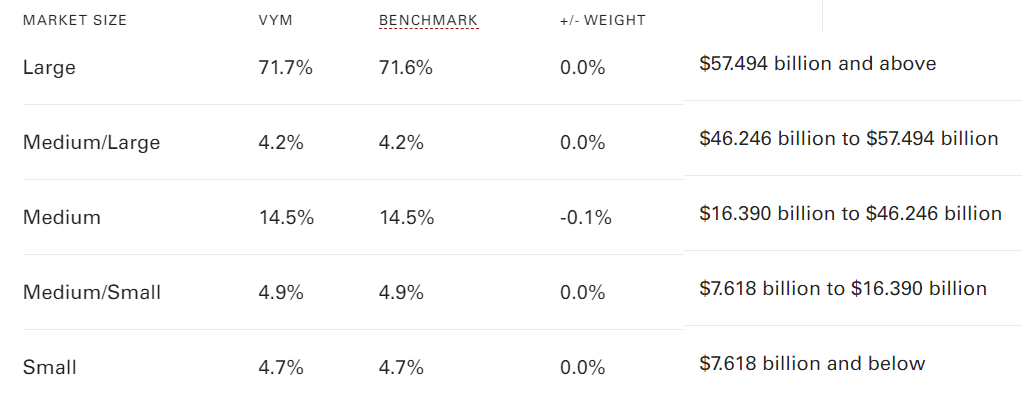
I track 97 large-cap value ETFs, but only 40 have a ten-year history. Over that period, VYM's 154.87% total return through February 2024 ranks #19/40, but only a select few have competitive dividend yields and total returns, including:
As shown below, VYM's 154.87% total return (9.81% annualized) is 1.52% less than SCHD's but 0.44% and 1.16% more than FDL and DVY. It's also performed relatively well in the last three months, the approximate date of my previous review.
Portfolio Visualizer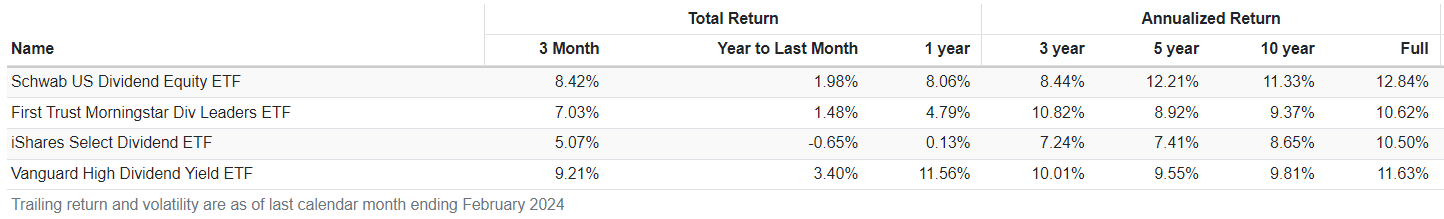
However, it's still concerning that despite these competitive results, plenty of other lower-yielding large-cap value ETFs have outperformed over the last decade. To check if yield investors indeed must trade total returns for higher income, I checked the annual returns of hypothetical portfolios published at the Ken French Data Library. The source data is here, and below is a chart summarizing the returns of various value-weighted portfolios formed by dividend yield over the last 20 years.
Chart Source: The Sunday Investor; Data Source: Ken French Data Library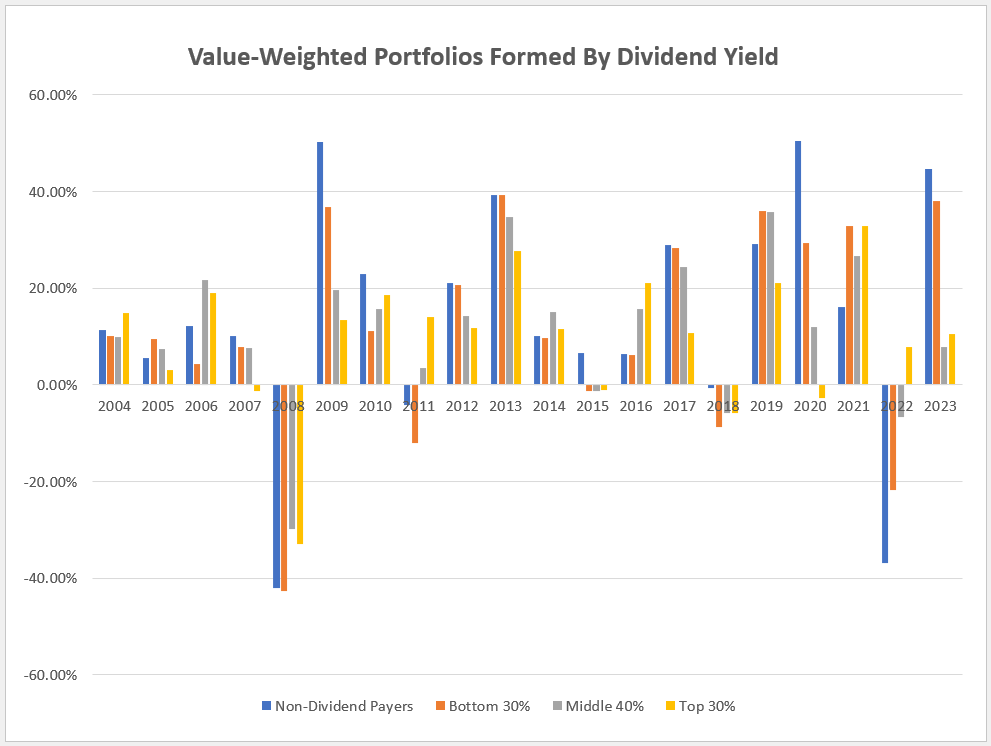
Here are a few summary statistics:
1. Between 2004 and 2023, the average annual returns for the top 30% portfolio were 9.71%. The non-dividend-payers performed best at 14.09%, followed by the bottom 30% and middle 40% group at 11.69% and 11.42%, respectively.
2. The decade from 2004 to 2013 was slightly better for dividend-paying stocks, but since only a handful of dividend ETFs were trading at that time, these results aren't visible to most investors. The top 30% averaged an 8.84% gain compared to 12.68%, 8.49%, and 10.46% for the non-dividend-payers, bottom 30%, and middle 40% groups, respectively.
3. Dividend-paying stocks produced a narrow range of returns compared to non-dividend-paying stocks. The top 30% portfolio's worst year was in 2008, when it declined by 32.93%, and its best year was its 32.78% gain in 2021, meaning the range of returns was 65.71%. As for the non-dividend-payers, these stocks declined by 42.04% in 2008 but rebounded by 50.29% in 2009 and did even better in 2020 with a 50.56% gain. This range is higher (92.60%), but the risk/reward ratio clearly favors non-dividend-paying stocks. Here are the annualized and total 20-year returns for each portfolio:
Given these results, dividend investors should be cautious about the category of dividend payers they select. This evidence indicates that buying high-yielding stocks is not a winning strategy, and a slightly "compromised" approach involving buying more low—or middle-paying dividend stocks should improve total returns.
Using the Vanguard Total Stock Market Index ETF (VTI) as a guide, I've determined that 54% of U.S. stocks (excluding REITs) do not pay a dividend. Since the average dividend yields for the top 30%, middle 40%, and bottom 30% are 4.90%, 2.21%, and 0.74%, VYM's 2.99% trailing yield puts it somewhere in the middle of the first two categories.
Since VYM selects partially from the middle category, it won't compete well on dividend yield with SCHD, FDL, and DVY. However, that might be a good thing. Consider the following fundamental metrics for VYM's top 25 holdings, totaling 45.81% of the portfolio. That makes it far better diversified than SCHD and FDL and only slightly less diversified than DVY.
The Sunday Investor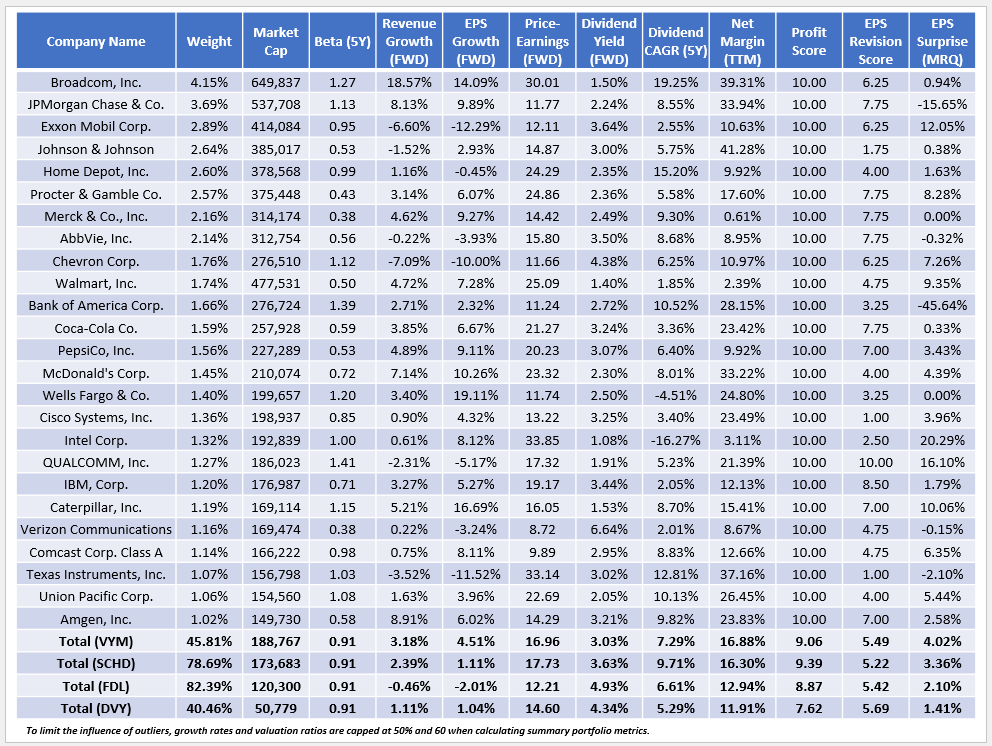
Here are five additional takeaways:
1. VYM's Index yield is 3.03%, and after deducting its 0.06% expense ratio, I expect shareholders to net 2.97% at current prices. This dividend yield is 0.60% less than SCHD and 1-1.5% less than FDL and DVY, so income investors have better options. Most of it has to do with how many stocks it selects. There are only so many high-dividend stocks available, and ETFs with fewer holdings have a lot easier time targeting a specific yield.
2. Remarkably, all four ETFs have the same 0.91 five-year beta, indicating a similar volatility level relative to the broader market. Broadcom (AVGO) and JPMorgan Chase (JPM) have betas above one, but there are enough stocks, particularly in the Consumer Staples and Health Care sectors, to offset it. The weights and weighted average five-year betas for each sector are as follows:
3. VYM and SCHD have acceptable profit scores of 9.06/10 and 9.39/10, which I calculated using individual Seeking Alpha Factor Grades. To support these scores, notice their high net margins of 16.88% and 16.30%, respectively. FDL's 8.87/10 score is about average for the large-cap value category (8.85/10), while DVY's 7.62/10 score is weak, offsetting the benefits of its superior diversification.
4. Growth estimates have declined almost across the board for most U.S. equity ETFs. Inevitably, this decline will impact future dividend growth rates, but I want to highlight how VYM has held up better than most. The estimated sales and revenue growth rates for the large-cap value category are 3.02% and 4.09%, respectively. Meanwhile, VYM's 3.18% and 4.51% growth rates are slightly above average, while growth rates for SCHD, FDL, and DVY are essentially flat. These findings indicate that VYM is better balanced and likely explains why it outperformed SCHD recently.
Portfolio Visualizer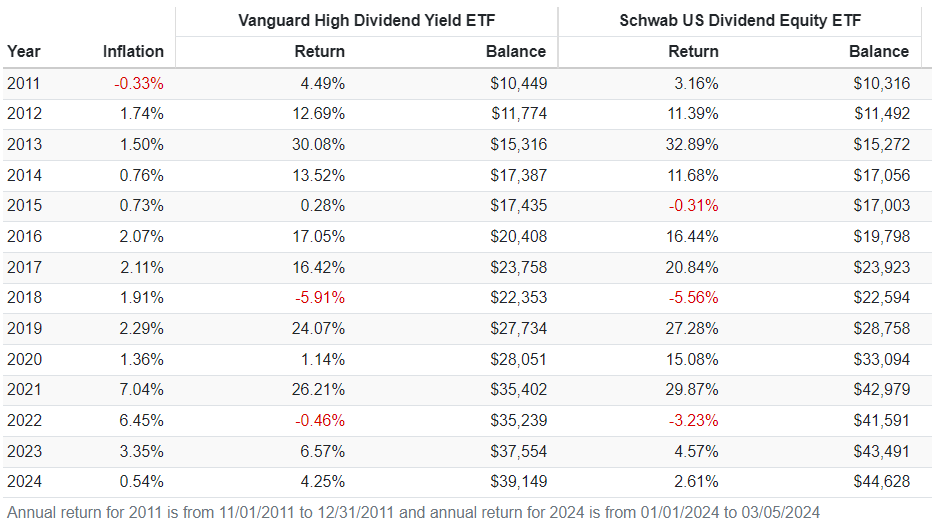
VYM's five-year return still looks poor in comparison, but that's only because of a weak 2020. I'm confident we can all agree that it was a unique year unlikely to repeat, so I encourage readers to give weight to VYM's current fundamentals, too. It is set up better than SCHD for a growth market.
5. VYM trades at 16.96x forward earnings using the simple weighted average method or 14.57x forward earnings using the harmonic weighted average method used by sites like Morningstar. Regardless of your calculation method, its valuation is relatively attractive. SCHD's valuation is about one point more, and while FDL and DVY offer significant discounts, you'll have to weigh that against even less growth and lower quality. While the dividend yields are attractive, I don't think it's worth the risk.
VYM is a well-diversified large-cap value ETF expected to yield approximately 3%. It trades at a reasonable 17x forward earnings and has estimated sales and earnings per share growth rates above average for its category. Notably, the growth rates for most other dividend ETFs, including SCHD, FDL, and DVY, are low. VYM has the advantage over SCHD despite its slightly inferior quality, and since its fundamentals have held up better, I believe it warrants an upgraded "buy" rating.
However, before you rush to buy shares, I recommend waiting until SCHD's reconstitution on March 18, 2024. SCHD is also a high-quality fund with many similarities, including volatility and valuation. However, I am disappointed with how quickly SCHD's growth rates have deteriorated, and I am counting on this reconstitution to produce a better-balanced portfolio. Please look out for this reconstitution update on or around that date, which will also include a comparison with VYM. Until then, thank you for taking the time to read this review of VYM, and I hope we can continue the discussion in the comments section below.