
champc
champc
Written by Nick Ackerman, co-produced by Stanford Chemist.
DoubleLine Income Solutions Fund (NYSE:DSL) provides an attractive monthly distribution to its investors. A double-digit yield is always exciting, but the distribution coverage is a bit lacking, and we saw the coverage slip last year. The slipping coverage was a reduction in net investment income due in part to rising borrowing costs on its leverage. That said, the fund could be set to see coverage head back in the positive direction, with the Fed expected to cut rates this year and into the next.
It has been around a year since we covered DSL, going back to our January 2023 article. However, we also touched on this fund mid-year 2023 when we looked at a recap of the DoubleLine trio. Since the DSL focus article, though, the fund's performance has been quite respectable on a total return basis.
DSL Performance Since Prior Update (Seeking Alpha)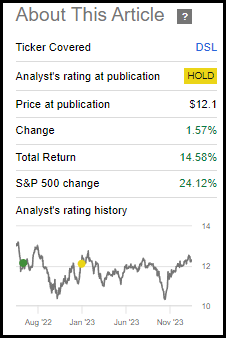
In both of the prior articles, the fund stood at a near parity with its underlying net asset value per share. That's what mostly kept it at a 'Hold/Neutral' rating. Today, that really hasn't changed, as the fund trades at a slight premium - which isn't too far out of line with the fund's historical range. However, we can look at the latest annual report for the fiscal year-end 2023, see what other changes the fund may have made in its portfolio more recently and look at where the fund's distribution coverage may go in the future.
DSL has an investment objective to "provide a high level of current income, and its secondary objective is to seek capital appreciation." The fund is invested "in a portfolio of investments selected for their potential to provide high current income, growth of capital, or both. The fund may invest in debt securities and other income-producing investments anywhere in the world, including in emerging markets."
The fund's leverage is rather moderate. However, any leverage is going to negatively impact the fund in a down market and positively impact it in a rising market. This increases the volatility of the fund, bringing higher risks but also potentially greater rewards.
One thing we saw with the other DoubleLine funds was that they were taking down leverage in the last year, and that was the same for DSL. This keeps the funds at a more moderate leverage level relative to some multi-sector fixed-income fund peers that often keep leverage ratios at 30 to 40%.
DSL Borrowings Outstanding (DoubleLine)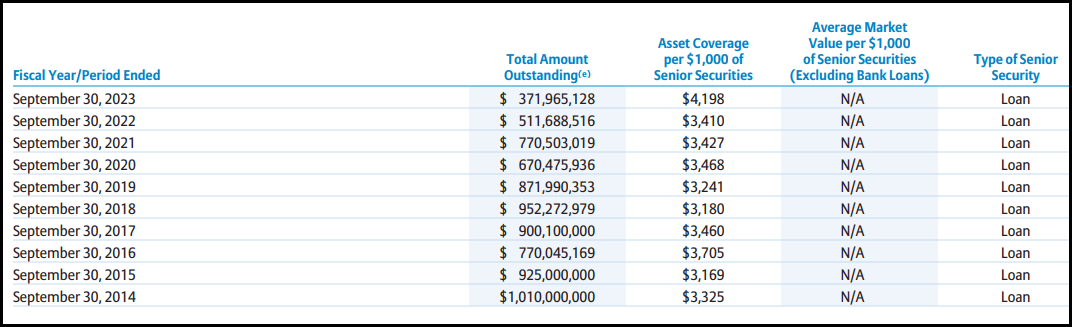
Another factor to consider for funds that employ leverage is the costs of those borrowings. DSL utilizes a credit facility that is based on a floating rate, which rose dramatically when the Fed raised rates aggressively. That caused the fund's total expense ratio to climb to 3.24% as of their latest annual report. That was up from the 2.17%.
The fund had a really strong performance in 2023, helping to erase some of the losses sustained in 2022. Of course, we know that 2022 was a tough year across the board for all equities and fixed-income alike. Over the longer term, annualized results for fixed-income-focused funds are still hurting, though.
Here are the results we see for DSL, and the table also includes some context by providing the results of the Bloomberg Global Aggregate Index as well.
DSL Annualized Performance (DoubleLine)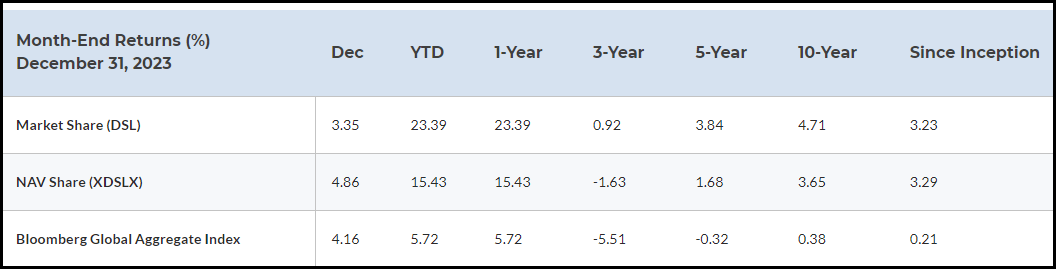
Certainly, these are not envious returns for DSL, but to be fair, the benchmark here also isn't showing anything to brag about either.
Given the fund's premium, one could come to the conclusion that the fund is a sell. That said, if we are at least basing this on the history of the fund's average discount/premium level - it looks much more like around a fair value than a sell.
Reflecting that would be that the fund's 1-year z-score comes in at 0.46. That essentially shows that the fund is trading at around the average of last year. If we look at the last five years, the fund's average discount came in at a rather shallow 2.14%.
Looking back even longer, one could argue that the price is a bit more rich. In the last decade, the fund has traded at a bit of a deeper discount relative to the current level. At the same time, thanks to flirting with a premium on several occasions, that helped average up the fund's average level.
Ycharts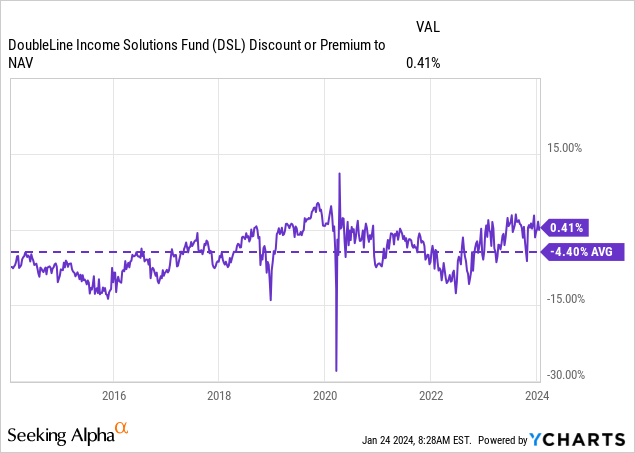
Based on the latest monthly distribution, the fund's sports an appealing 10.74% rate. This is quite similar to the fund's NAV rate due to trading at near parity with its NAV. The fund did cut its distribution once since its inception.
DSL Distribution History (CEFConnect)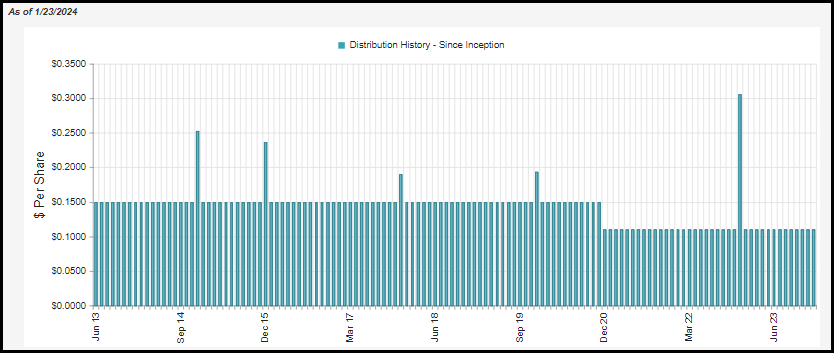
Besides borrowing costs rising for the fund due to higher rates, the fund's deleveraging in the last year also meant a reduction in total net investment income for the fund.
DSL Annual Report (DoubleLine)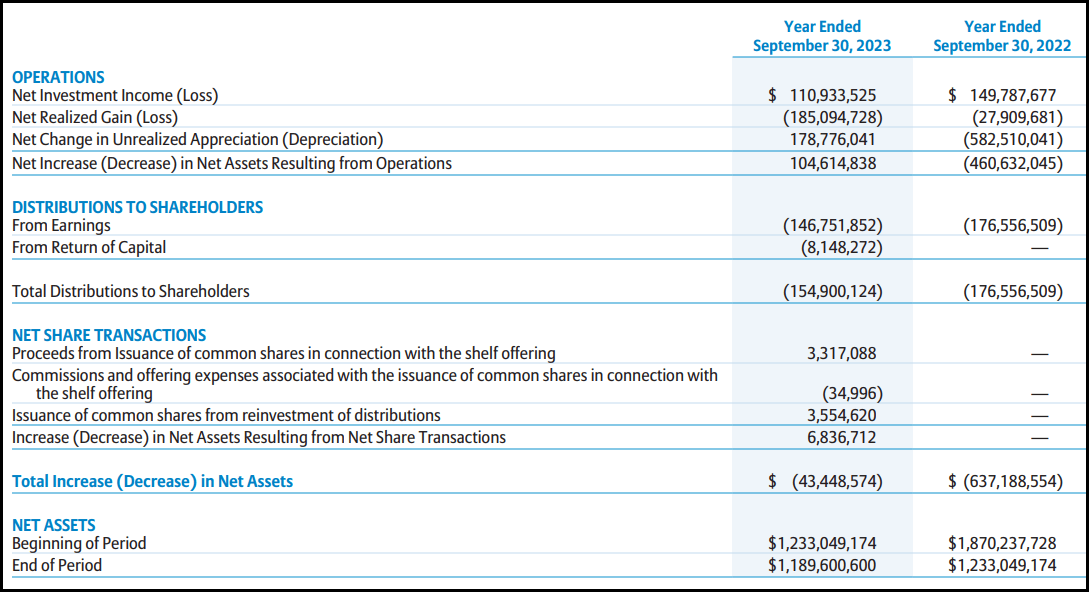
On a per-share basis, the fund's NII went to $1.09 from $1.47. That was also a reduction from the prior years, and it has been on a downward trend. Though the last year was the most significant decline of nearly 26% because of higher borrowing costs and deleveraging.
Some of the declining coverage throughout the years is because running a mostly high yield below investment grade portfolio means you will be accumulating losses. In an ideal world, you'd have NII coverage around 100%, and you'd have more winners than losers over the years. Of course, that's in a perfect world.
For DSL, they hadn't been able to manage that so far in the last five years of this fund. That's resulted in NAV declining over the years, and now the latest NII coverage is a bit weaker. The below total distribution comes out to $1.52. However, that's factoring in the special that the fund paid - the regular distribution for the fund comes to $1.32, and that puts NII coverage at a bit shy of 83%.
DSL Financial Stats (DoubleLine)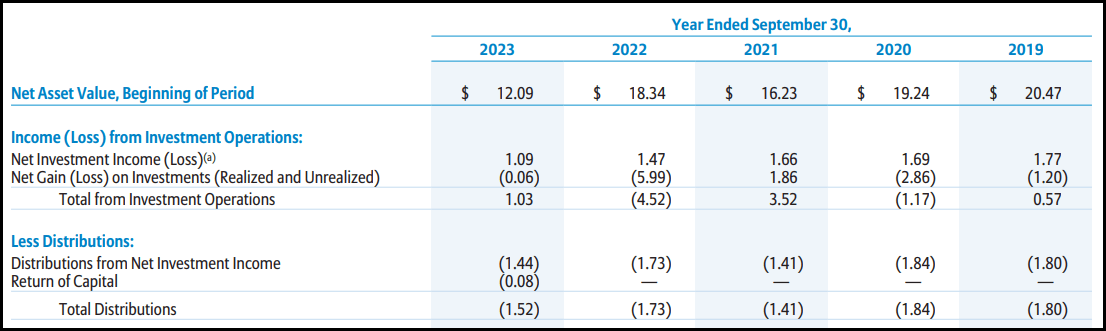
That said, that's the last five years and going forward can look much different. In fact, with lower rates expected, I believe that the chance to see DSL's coverage move higher once again is a really good possibility. This would be due to borrowing costs coming down as they pay at a rate of OBFR plus 1%. That saw the average interest rate rise to 5.59% in the last report.
In addition to lowered borrowing costs, the fund could be in a situation where it can once again leverage back up. This could be primarily driven by appreciation in the fund's underlying portfolio of debt instruments. As rates go down, the price of the bonds can rise. The average market price for DSL's portfolio at the end of 2023 came in at $70.95.
Now, to be clear, some of this trading below par is factoring in the credit risks and the realization that there will be losses in this segment of the market. Even considering that, with appreciation in the underlying portfolio, NAV can rise for DSL. The fund lists the duration of its portfolio at 5.65 years. That means for every 1% change in rates, they would expect their underlying portfolio to move 5.65%. Over the last couple of years, we saw that working against their portfolio. More recently, we also saw the significant positive impact it can provide as the fund bounced off the October 2023 lows that were driven by a collapse in risk-free rates.
All that said, appreciation in its underlying portfolio means more net assets for the fund. Thus, then allowing them some greater capacity to move their leverage amount up to around the 20% ratio that they linger around.
Clearly, there are a lot of moving parts here. This all also sort of depends on the Fed getting the soft landing that they are hoping for. A slowdown in the economy that is too deep could have meaningful negative consequences for a mostly below-investment-grade fund such as DSL.
That said, it is possible for coverage to improve going forward significantly. To put an exact figure on it would be hard due to the significant number of variables. Despite rates not expected to go back down to zero, at least in a soft landing scenario, I think that coverage could come in quite close or even achieve 100% based on the regular annualized payout of $1.32. Any shortfall in NII coverage could possibly be covered through capital gains in a scenario where they see appreciation in their portfolio as well.
A bit of a side note, but worthy to mention nonetheless, is that since the fund was trading at a premium, they were able to issue new shares. This would be through their at-the-market program and through the dividend reinvestment plan. This is a positive for investors, but the amounts were so marginal in the year that it didn't have any significant impact. At the very least, though, it is not a negative for the fund.
For tax purposes, the fund has listed primarily ordinary income in each of the last two years. This is something that we would expect to be the case going forward as a fixed-income-focused fund.
DSL Distribution Tax Classification (DoubleLine)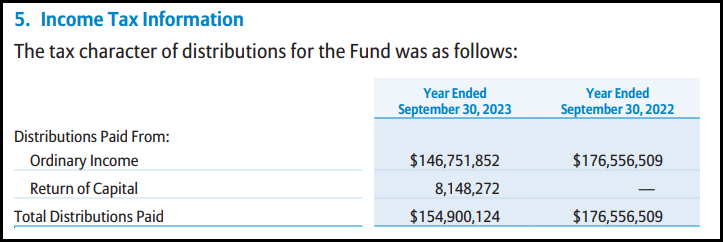
In the above distribution section, we already discussed a number of the important factors related to the fund's portfolio. The $70.95 average market price and the portfolio duration is 5.65 years. Those metrics are particularly important and relevant to the fund's distribution sustainability, as we discussed. That said, relative to our last update, the average market price is actually higher now, and the duration is also higher. Those came in at $65.80 and 4.48 years, respectively.
In the last year, the DSL management team was a bit less active than they had been in previous years. The portfolio turnover rate came in at 20%, down from 24% in the prior year. This was also below the average of the last five years at 33.6%. The fund could be described as a multi-sector fixed-income fund, which is how I'd categorize it. That said, it should be noted that it has a serious weighting to emerging markets. That's the largest slice of DSL's portfolio at nearly 40%.
DSL Sector Breakdown (DoubleLine)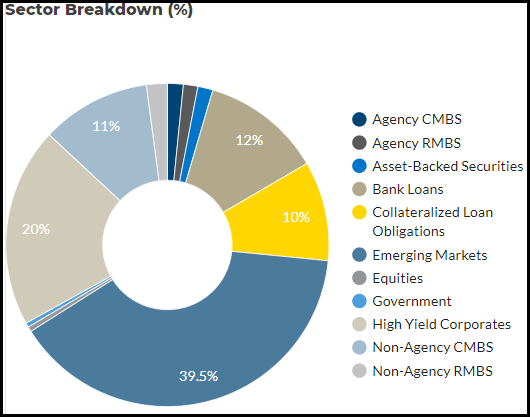
The other largest categories here are high-yield corporate bonds at 20%, 12% in bank loans, 11% in non-agency CMBS, and 10% in collateralized loan obligations or CLOs.
The fund carries some agency MBS, as we can see, but it is a fairly insignificant allocation for the fund overall. That's what pushes this fund more toward the junkier side, as below-investment-grade accounts for just over 75% of the fund's portfolio. That can be compared to the 13.32% in investment grade; agency comes in at a very thin 0.42% and government debts are just 1.6%.
DSL Credit Quality (DoubleLine)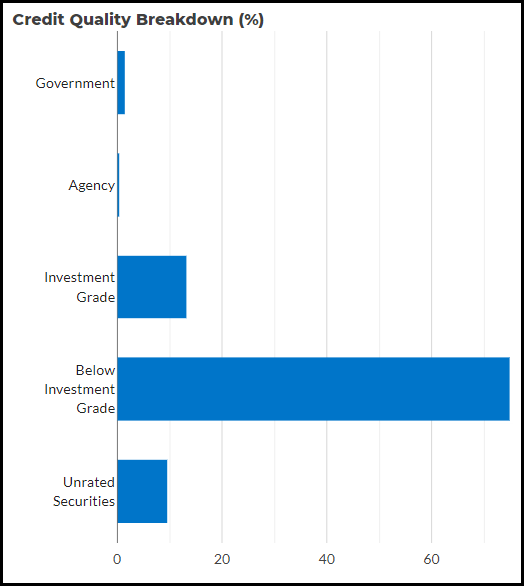
That means the portfolio should be relatively more sensitive to credit risks relative to interest rate risks. That's where we see the fund's average market price of the underlying portfolio being at such a significant discount. That reflects those additional risks that there will be defaults, and a slowing economy means there will be even more defaults.
None of these breakdowns have shifted dramatically since our prior update from around a year ago. That seems to reflect the relatively low turnover. Then again, even for funds that see significant turnover, there aren't always a lot of dramatic shifts in the overall construction of the portfolio.
One of the ways that junk funds often try to reduce risks is through significant diversification. DSL fits that category as CEFConnect listed that the fund holds 478 different holdings. That diversification to reduce risks is also present in the fund's top ten holdings list, with nothing holding a meaningful overweight portion of the assets. The top ten represent only around 12.52%.
DSL Top Ten Holdings (DoubleLine)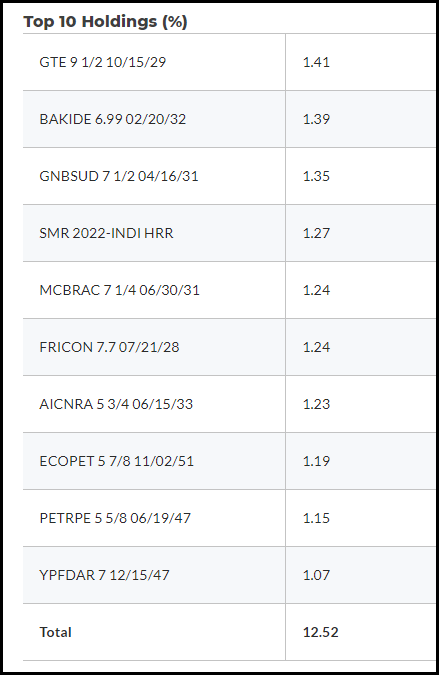
Even further, we know that the fund carries some CLO exposure, asset-backed securities and MBS exposure. These are securitized assets that pool together underlying loans, meaning even more spread-out exposure and less individual entity risk.
The fund's past performance also might not be something to brag about, but it is in a position where it could benefit from rate cuts in the future. That should see easing pressure on the fund's borrowing costs and also benefit the fund's underlying portfolio. At the very least, stabilizing rates should also help the fund too, as things should start to balance out. As its portfolio starts to mature or they start to trade around, that could see them shifting their portfolio into higher-yielding instruments these days - which could also be a benefit over the longer term.
Overall, I believe the fund is still trading at a fair valuation that isn't too extreme. I wouldn't necessarily be a buyer here, but I could see a reasonable argument for those who are to remain invested in the fund.