
Javier Ghersi/Moment via Getty Images
Javier Ghersi/Moment via Getty Images
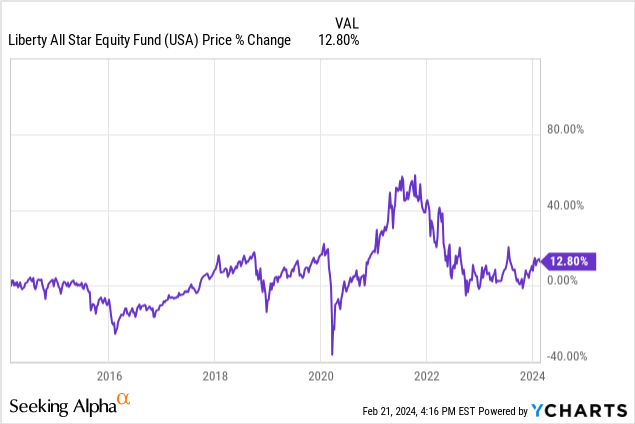
Closed-End Funds are still investment vehicles that don't get a lot of attention. This is understandable though as a lot of them are structured more complexly than tradition types of funds like ETFs. In addition, a lot of their price charts look scary so I imagine a lot of investor dismiss these types of funds almost instantly. For example, take a look at the price chart of this Liberty All-Star Equity CEF (NYSE:USA) starting from 2015. A 12.80% price return isn't exactly anything to get excited about.
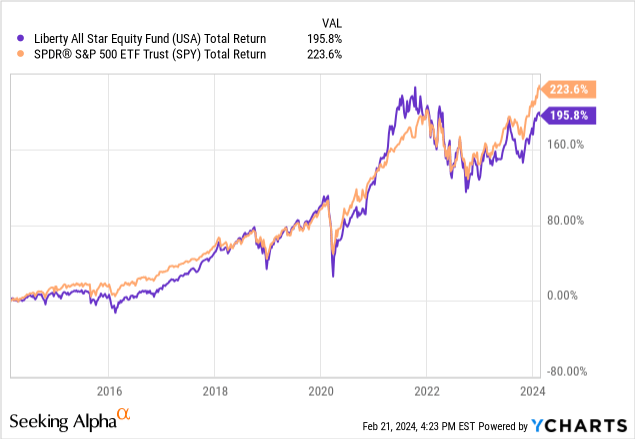
However, the picture starts to change when we look at the total return for this type of fund. CEFs typically have much larger distribution yields as they are structured to prioritize providing a sustainable stream of income. Over the last 5 years, USA has averaged a dividend yield of about 10%. As a result, this high distribution has helped contribute to the total return nearing 200%. Not to mention, the total return almost matches that of the S&P 500 (SPY). While total return is a nice result of the fund, I think a fund like USA is better valued by the investor that prioritizes income over anything else.
As a quick summary, the Liberty All-Star Fund (USA) focuses their portfolio on US equity markets. The fund's objective is to invest across several different sectors while pursuing value & growth stocks that are large caps. The fund aims for long term capital appreciation and aims to provide steady income for shareholders. While the capital appreciation goal has been very mild since inception, the income aspect is where the fund shined.
USA is a great fund for those depending on income, such as retirees. USA is also a great fund if you want to take a bet on the United States growing over the next decade. This is because the fund has exposure to many of the best US based companies in the world.
All Star Funds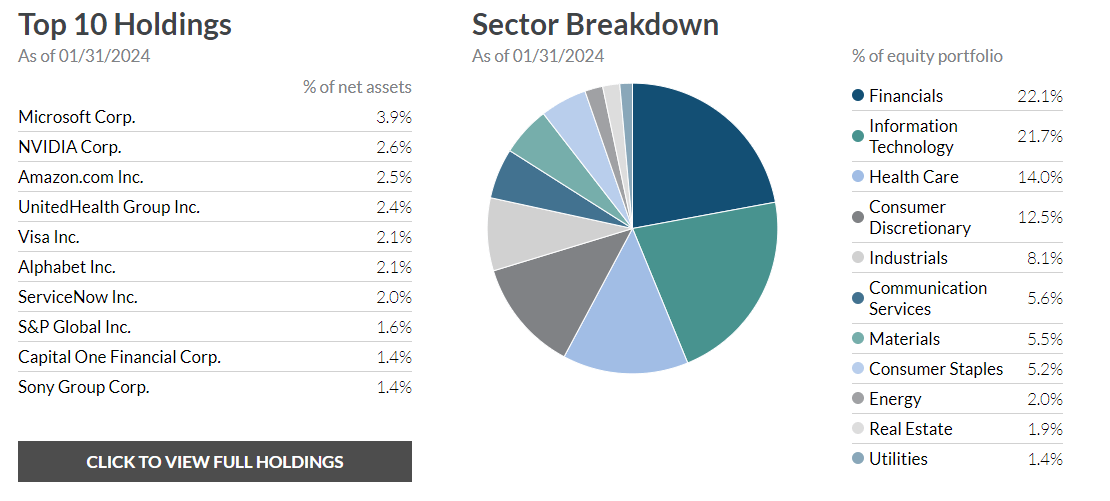
The fund's top holdings consists of top tier companies like Microsoft (MSFT), which I recently rated as a Strong Buy, NVIDIA Corp. (NVDA), and Amazon (AMZN). The portfolio is most weighted in financials at 22.1% and Tech at 21.7%. The portfolio itself is diverse in nature as it has exposure to most industries. However, the real diversity comes from how the strategy is implemented and how the fund is managed itself.
This is because USA's management is divided among five distinct manager. They each specialize in different areas and focus exclusively on that. Therefore, the fund's performance is a result of a joint effort from the following.
The firms that are focused on value have the job of identifying promising opportunities from a pool of high-quality companies. These companies should have catalysts for positive change while simultaneously priced at low valuations. On the flip side, the growth focused managers target companies with a predictable earnings and cash flow growth trajectory. I think this is pretty unique as they are joining forces and expertise to our benefit. They do so at an expense ratio of only 0.93%.
Some recent changes of the fund include the addition of two new companies and the liquidation of one company. The two new additions are CVS Health Corp (CVS) & Quest Diagnostics (DGX). The company that has been disregarded is SAP SE (SAP).
The latest declared quarterly dividend as of January 2024, of $0.17/share represents a recent 13.3% raise over the prior dividend of $0.15/share. Management states that the plan is to pay out around 10% of the fund's total value. Unlike high yielding BDCs (Business Development Companies) such as Blue Owl Capital (OBDC) that offer yields near 10%, the fund doesn't depend on factors like NII (net investment income).
Speaking of BDCs, lets quickly compare how the distribution and total return fare against USA. Even though business strategy, structure, and objectives differ, I think this is a reasonable comparison to make since they both offer double digit yields and a high total return.
The comparison between CEFs and BDCs can go deeper depending on which fund we look at, but I ultimately want to convey that there are different high yielding asset classes to choose from. We will compare USA's distribution and performance against the previously mentioned OBDC, popular Main Street Capital (MAIN), and Cornerstone Total Return Fund (CRF).
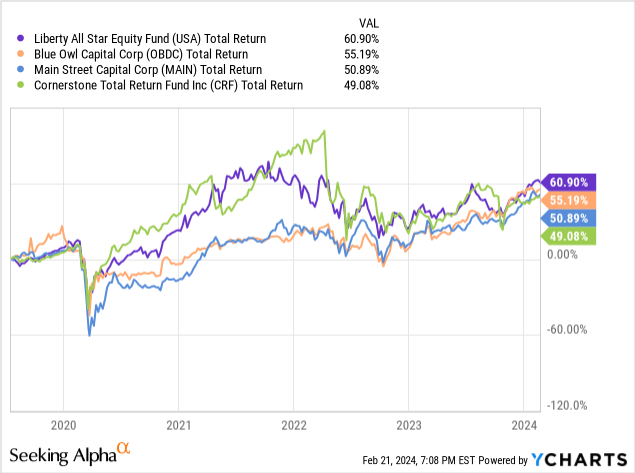
Over the last 4 years, USA has actually outperformed this group in total return. Although the outperformance is very marginal, USA gets the win here and that's likely attributed to strong growth of both tech and financials. In terms of dividend growth, it seems that the BDCs are a better choice however, especially in the high interest rate environment where cash flows from debt are strong.
Meanwhile, CRF's dividend has been trending downward for the last decade. Meanwhile the dividend of OBDC has recently been raised by 5.7% and as regularly distributed supplementals. Likewise, MAIN's dividend was also recently increased and supplemental dividends have been consistently issued. Over the last 5 years, USA's dividend has remained in the range of $0.15 - $0.21/share.
USA Tax Distribution Information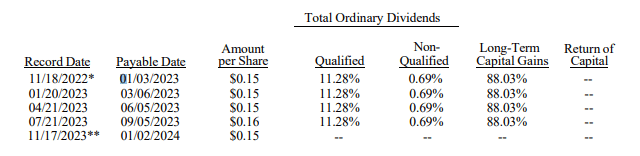
Lastly, the way that USA is structured means that these distributions are likely to be taxed as ordinary income depending on how much the fund has earned. The fund has yet to release their tax information but there is a transparent history here that we can reference. We can see that last distribution was primarily classified as long term capital gains.
I believe this is a great time to initiate a position into USA due to the current price trading at a discount to NAV (Net Asset Value). The current discount to NAV sits at about 4%. For reference, the price traded at an average premium to NAV of 1.93% over the last 3-year period. We saw the premium reach as high as 15% when the price spiked in 2021 and the discount reach as low as -15% for a brief moment after the drop in 2020.
CEF Data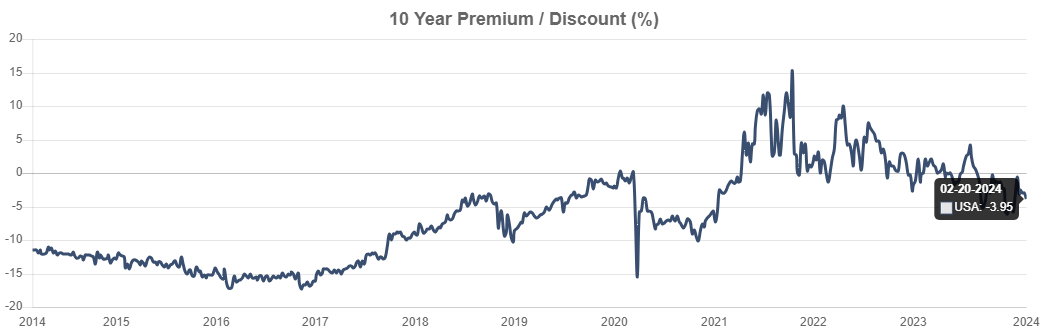
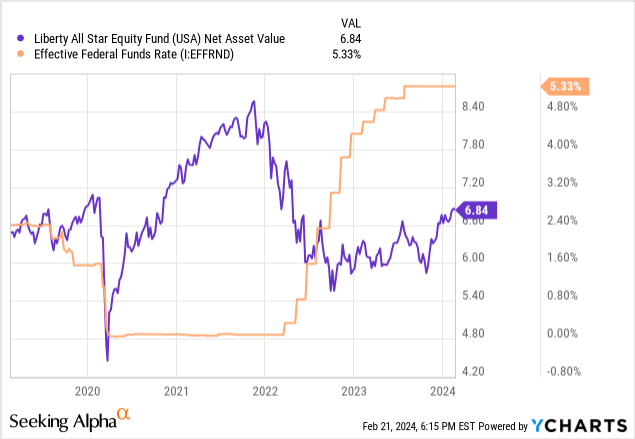
However, diving deeper shows us that the NAV slowly decreased as rates began to get increased starting 2022. Taking a look at the graph below, we can see the inverse relationship. Interest rates are anticipated to get cut by the mid-point of this year. I believe that once that happens, we will likely see the NAV and share price increase over time as well. Therefore, entry here is attractive as we are likely to experience upside in addition to the high stream of dividend income.
The main downfall here is underperformance to the greater indexes. I imagine that holding an income focused investment like USA means that over time, the margin of outperformance against the S&P 500 is bound to widen. However, this may not be a big deal if you only care for the income to fund your life. However, if you also value price appreciation there are better options out there.
In conclusion, Liberty All-Star Fund offers a unique opportunity for a high distribution and total return. The share price has not had much movement since inception but that isn't necessarily a bad thing since it means you can collect a steady income while having some of your principal intact. The dividend yield is over 10% and was just recently raised.
The portfolio is diverse and leans more weighted towards financials and tech. Overall, USA is a great choice to fund your retirement and collect a high level of income while gaining exposure to some of the best companies in the world. The price currently sits below the average discount / premium to NAV so entry here is ideal. However, I plan to observe how the future interest rate cuts will affect the price movement.