
Dilok Klaisataporn
Dilok Klaisataporn
The holdings for the Vanguard Dividend Appreciation Index Fund ETF Shares (NYSEARCA:VIG) changed effective Wednesday, March 20, as the S&P U.S. Dividend Growers Index completed its three-day scheduled reconstitution process. This year's reconstitution saw 45 securities added and 20 deleted, improving the portfolio's diversification, value, and dividend yield features while maintaining high quality.
To be sure, most readers will find these changes negligible, but now that several dividend ETFs have completed their annual reconstitutions, I thought it was an excellent time to provide a fundamentals-based analysis comparing VIG and three solid alternatives. I look forward to taking you through the latest numbers below and answering your questions in the comments section afterward.
VIG tracks the S&P U.S. Dividend Growers Index, selecting U.S. securities with at least ten consecutive years of dividend increases. Please note that dividend growth is required, whereas the Index tracked by the Schwab U.S. Dividend Equity ETF (SCHD) only requires ten consecutive years of dividend payments. While SCHD's Index incorporates dividend growth into its composite scoring system, it's front-and-center with VIG and, as such, should be a more attractive product for long-term dividend growth investors.
The graphic below briefly overviews the criteria compared to the previous Index used. I want to highlight how the current Index explicitly excludes REITs and the top 25% of eligible stocks (15% for current constituents) as ranked by indicated yield.
Morningstar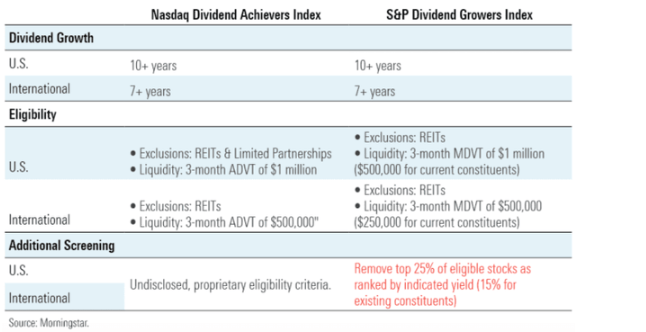
Many year-to-year changes relate to this screen for yield traps. In practice, the relevant figure is 15%, as it's exceedingly rare for companies to pause their dividend growth streaks unless they're experiencing financial hardship. This year was no exception, as the Index added 45 new companies while deleting 20, many due to this screen.
The Index is market-cap-weighted with 4% limits on the largest companies at each quarterly rebalancing. Unlike SCHD, there is no fixed number of selections, so VIG becomes better diversified as more companies get added. Unfortunately, this also dilutes the dividend yield. VIG's trailing dividend yield is only 1.78%, and according to my calculations, the annual reconstitution only improved that figure marginally. Therefore, VIG should be considered for its dividend growth and diversification features compared to broad-based index funds like the SPDR® S&P 500 ETF Trust (SPY), but look elsewhere for income.
VIG has several competitors, including the iShares Core Dividend Growth ETF (DGRO) and the WisdomTree U.S. Quality Dividend Growth ETF (DGRW), which offer similar yields. Since DGRO's launch in June 2014, VIG has delivered a solid 11.15% annualized gain but has lagged DGRO, DGRW, and SPY.
Portfolio Visualizer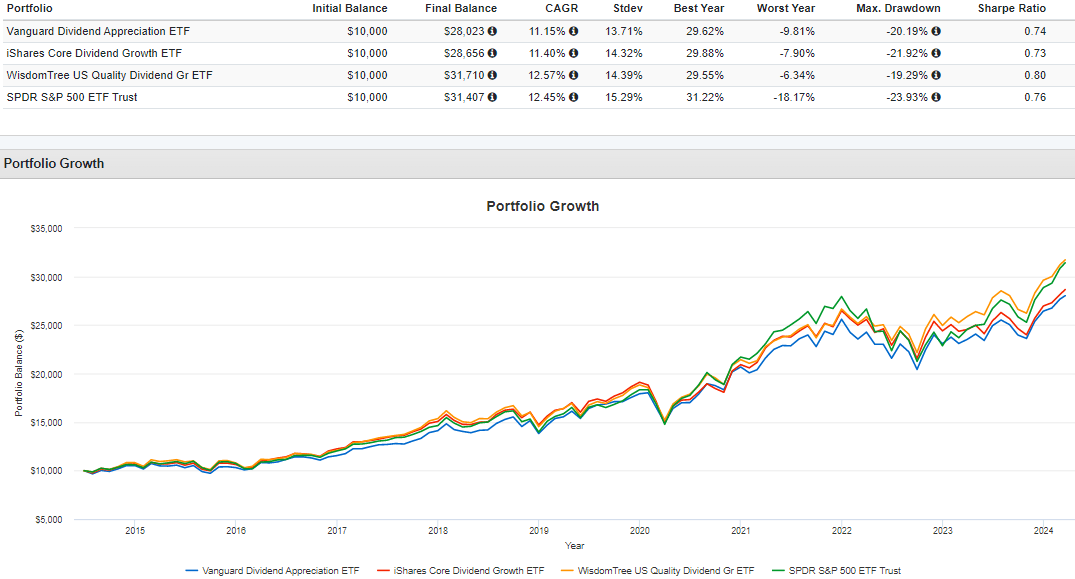
VIG's long-term dividend growth hasn't been as impressive as its competitors. The graph below shows portfolio income generated on a $10,000 investment beginning on January 1, 2015, for VIG, DGRO, and DGRW, assuming reinvested dividends. VIG's portfolio income grew from $226 in 2015 to $467 in 2023, or an annualized 9.50%. This income growth is close to, but still lower than, the 11.93% and 10.33% figures for DGRO and DGRW.
Portfolio Visualizer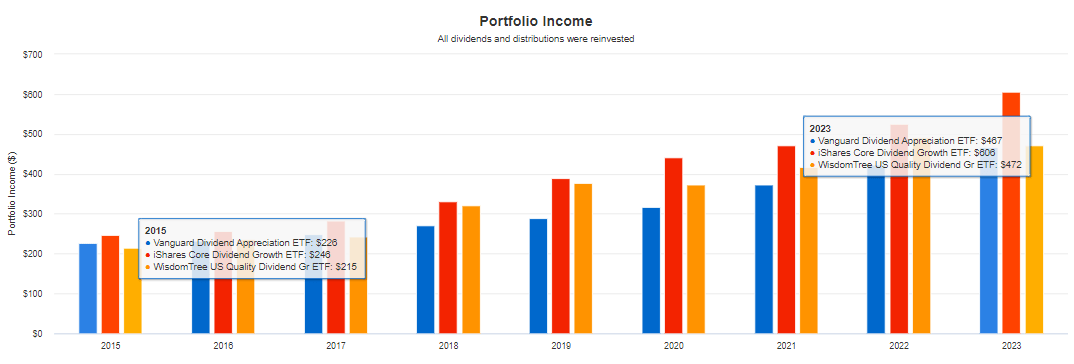
However, VIG's portfolio income growth over the last three years was more impressive: 13.91% compared to 11.09% and 8.16% for DGRO and DGRW. This more recent data might be more relevant, especially with recent additions like Apple (AAPL), which has plenty of room to grow due to its low payout ratio.
The S&P U.S. Dividend Growers Index completed its three-day reconstitution after Tuesday's close, and the new portfolio is available when clicking on the "Portfolio Composition File" tab on the Vanguard website. Please accept Vanguard's terms and conditions before viewing this file. With the reconstitution, there were 45 additions, as follows:
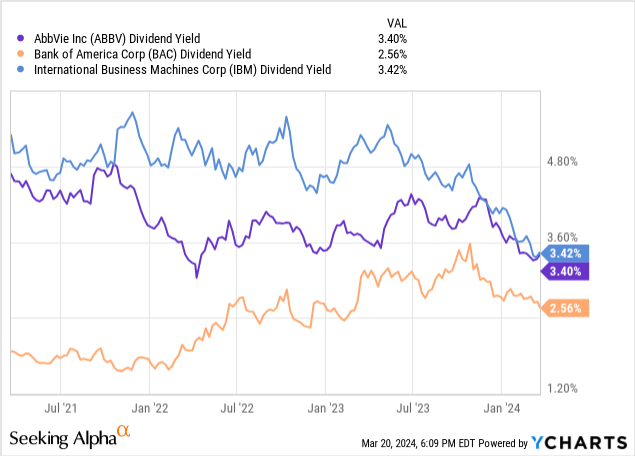
As shown in the chart below, the trailing dividend yields for AbbVie and IBM have steadily declined over the last three years, indicating that they were added this year because they are no longer considered yield traps. Meanwhile, Bank of America was added because 2024 marks the company's tenth consecutive year of dividend growth, as noted on its ticker page.
The Index deleted 20 stocks, as follows:
Recall Bristol-Myers Squibb was a key addition for SCHD this year, but its 4.63% dividend yield was considered too high for VIG. This example illustrates a significant difference between the two strategies. While VIG takes steps to avoid high-yielding stocks, SCHD seeks them out by only considering stocks in the top 50% by dividend yield after first screening for ten consecutive years of dividend payments.
VIG looks similar after considering the additions and deletions, though Health Care exposure is 2.06% higher. The offset was in Technology, which decreased by 1.34%. However, this decrease is related to Microsoft (MSFT). Previously, it had a 5.71% weighting, but the rebalancing reduced its exposure to the maximum 4.00% target weighting.
The Sunday Investor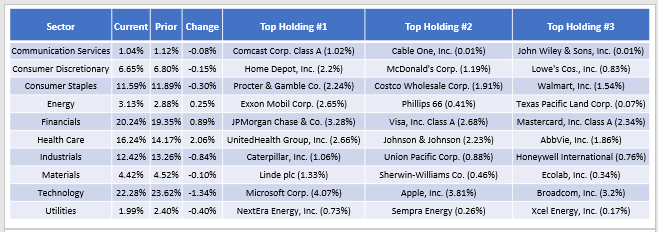
The following table highlights selected fundamental metrics for VIG's top 25 holdings, which total 51.21% of the portfolio. I've also included summary metrics for DGRO, DGRW, and the Capital Group Dividend Value ETF (CGDV), an actively managed choice with a similar expected dividend yield.
The Sunday Investor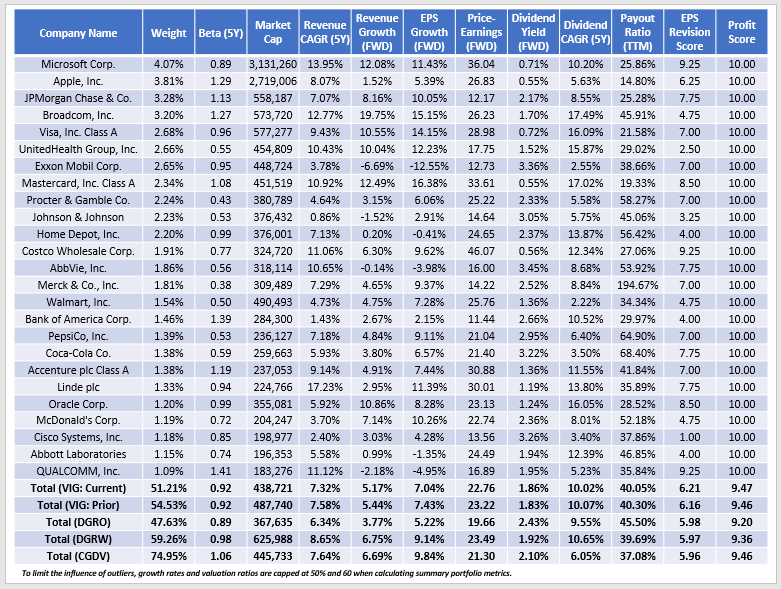
Here are five takeaways from this table:
1. VIG and DGRO have similar five-year betas, while DGRW and CGDV's higher betas indicate they likely won't provide as much downside protection in a market downturn. The beta did not change with this year's reconstitution, though VIG did become better diversified with about 3% less concentration in these top 25 holdings. This change relates to a larger number of net holdings and the rebalancing involving Microsoft.
2. VIG has a 5.17% and 7.04% estimated sales and earnings per share growth rate, about 1-2% more than DGRO and 1-2% less than DGRW. VIG trades at 22.76x forward earnings (19.67x harmonic weighted average) between the two. CGDV has the best combination of earnings per share growth and forward P/E (9.84% and 21.30x), but it's also the least well-diversified by far, with 74.95% allocation to its top 25 holdings. Analysts often overlook this statistic but remember that it's far easier to create a fundamentally strong portfolio with fewer stocks. You might consider CGDV for a small portion of your portfolio, but VIG is a much better "core" holding.
3. VIG's Index yield is 1.86%, and after deducting the ETF's 0.06% expense ratio, shareholders should net 1.80%. DGRO has a 2.35% expected net yield, so while it might suit income investors more, the chances of higher dividend growth are lower because of its lower estimated earnings per share growth rate. I calculated the following Dividend Growth scores using Seeking Alpha Factor Grades:
One downside of DGRW is its 0.28% expense ratio, which drives its expected dividend yield down to 1.64%. It's counterproductive for income investors to buy funds with high expense ratios, even if they are higher-quality funds that can deliver better total returns over the long run.
4. All four ETFs have terrific profit scores, which, again, I derived using Seeking Alpha Factor Grades. There shouldn't be any quality issues, and VIG's 9.47/10 profit score is backed by 19.73% net income margins and 16.47% free cash flow margins. Here are the margins for the three others:
Again, we find VIG in second place on margins behind DGRW, but I believe it has the edge on dividend growth given the three-year portfolio income growth discussed earlier. This history, which indicates VIG's constituents have shown more willingness to increase dividends, blends well with VIG's current ability to increase dividends, so it is one of the better options available to DGI investors.
5. VIG's 6.21/10 EPS Revision Score is the strongest. In addition, VIG's last quarter weighted average sales and earnings surprises were 0.49% and 3.57%, respectively. These surprises are below the long-term trend of 1-2% and 5-7%, so caution is warranted. As market sentiment peaks, it's prudent to take some risk off the table by moving toward lower-priced, less-volatile options. VIG does this moderately well, but if value stocks become favored again, I expect high-quality, high-dividend ETFs like SCHD to outperform.
VIG's annual reconstitution added 45 securities and deleted 20, with several moves driven by changes in dividend yield over the last year. The Index screens out stocks with excessive yields, and while not beneficial for income investors, it is prudent for total return investors focused more on capital appreciation. At the very least, VIG's 0.06% expense ratio is minimal, meaning the ETF's yield should always be close to the Index yield.
VIG is a solid "compromise" ETF between the large-cap value and large-cap blend spectrum. It has some exposure to high-growth Magnificent Seven stocks with high earnings and dividend growth potential, but the exposure is capped at 4% at each rebalancing, so investors will always get a well-diversified portfolio. Its constituents have demonstrated a strong willingness and ability to increase dividends, and I expect it to continue its current ten-year dividend growth streak and outpace other ETFs like DGRW, DGRO, CGDV, and SCHD on that metric moving forward. Therefore, I've decided to reiterate my buy rating on VIG. Thank you for reading, and if you enjoyed this article, please feel free to read other recent reviews and to leave a comment below.