
DrPixel/Moment via Getty Images
DrPixel/Moment via Getty Images
Written by Nick Ackerman, co-produced by Stanford Chemist.
The discount for Flaherty & Crumrine Total Return Fund (FLC) is off the deep levels of our prior update. That said, the fund's discount to its net asset value still remains material. Given the recent distribution boost, it is a good reminder that things are starting to stabilize and settle on the rate front.
Of course, this fund is still impacted significantly by risk-free Treasury Rates in terms of its underlying value. It isn't just all about the short-term rates that the Fed has control over, and that wreaked havoc on the fund's borrowing costs.
Our last update on FLC happened to be right near last October's low point in terms of peak risk-free Treasury Rates and negative sentiment in the overall market. Equities even briefly touched correction territory last October, and those risk-free rates meant significant pressure on interest-rate sensitive spaces such as the preferred and income space that FLC is tilted towards.
With that, the rebound since our last update on this fund was significant and swift as risk-free rates headed lower.
FLC Performance Since Prior Update (Seeking Alpha)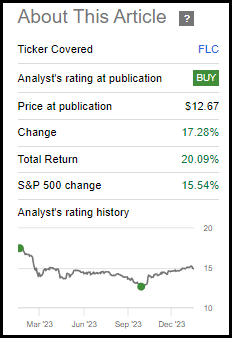
There has once again been more pressure on the fund as Treasury Rates started to head higher once again. This was on the back of the market expecting a more aggressive rate-cutting cycle from the Fed, which Powell has continually reiterated that they'll be data-dependent. Given the expectation that rate cuts are still projected to happen - but not as swiftly or as aggressively as the market would like due to strong economic data remaining - FLC can remain an attractive place to invest at this time.
I recently swapped my Flaherty & Crumrine Dynamic Preferred and Income Fund (DFP) position for FLC. However, all the F&C funds are quite similar and have a high correlation as their investment policies are all identical. This was simply a move that FLC was showing a slightly better discount at the time of the swap.
FLC's objective is quite simple, "provide its common shareholders with high current income." They also have a secondary investment objective of "capital appreciation," though preferreds and preferred funds typically fall short of this secondary goal.
To achieve the fund's objective, it will "normally invest at least 80% of its total assets in a diversified portfolio of preferred securities and other income-producing securities, consisting of various debt securities." They continue with, "normally invest at least 50% of its total assets in preferred securities."
Along with preferred securities in its portfolio, the fund is also invested in contingent capital securities (aka CoCos or AT1 bonds.) These became infamous in the banking crisis last year, when Credit Suisse saw theirs completely wiped out.
Flaherty & Crumrine chose not to hedge against interest rates with their funds. The logic is pretty simple: hedging comes with costs, and those costs don't always pay off. It is only in hindsight that you learn whether these costs pay off or not, and in this case, they lost the bet as the Fed raised rates materially.
This pushed up the fund's latest total expenses, including leverage, to 5.45% in fiscal year 2023. That was up from 2.60% for FY 2022 and 1.66% in FY 2021. In 2021, the market was enjoying a zero-rate environment. This reflects the cost of their borrowings exploding higher, as they pay based on SOFR plus 0.90%. That currently puts their borrowing costs at around 6.2%.
Then, you consider that the fund's operating expense ratio is 1.41% on top of those borrowings. That makes the average coupon on this fund, which comes in at 6.97%, have a negative spread. This means that, on average, the fund's leverage and operating expenses cost more than the fund can earn (i.e., it has a negative spread).
FLC Monthly Portfolio Data (Flaherty & Crumrine)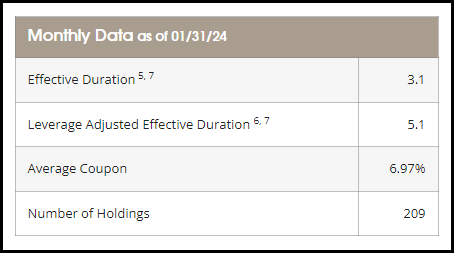
This average coupon is a bit higher than the 6.87% stated in our prior coverage. This is also higher than the 6.73% average coupon listed at the time of our early 2023 update. The coupon is edging up higher, slowly but surely. This is through portfolio turnover, but it should also be reflecting some fixed-to-float investments finally hitting their floating period. While these instruments are often redeemed fairly quickly, it doesn't always make sense necessarily to do so if a company can't refinance it at a lower rate. Therefore, allowing for some instruments to start floating could be the better course of action.
Simultaneously, throughout 2023, the Fed was much less aggressive and only hiked during the first half of the year modestly relative to their 2022 pace.
Ycharts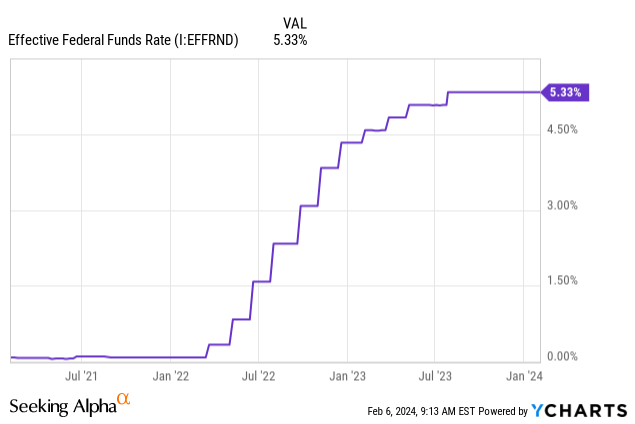
This helped to stabilize the F&C suite of funds, where they were able to raise their distribution more recently. This was after many times slashing it over the last couple of years.
FLC Distribution History (CEFConnect)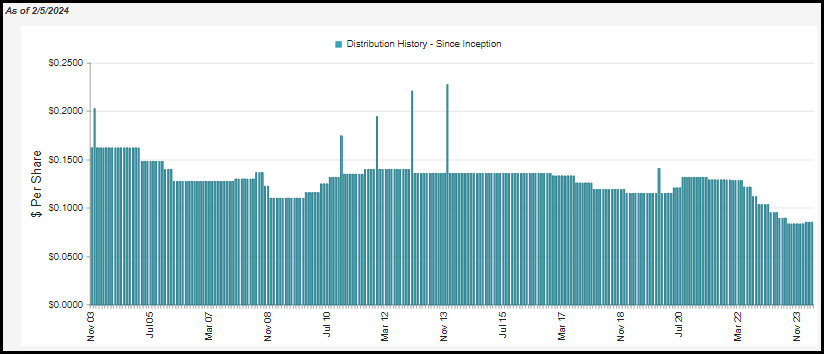
This is potentially set to help the fund in the future, too. Projections are for rate cuts, and any cut that happens from the Fed should have a swift and positive impact on the net investment income that FLC can generate. Their latest report showed that they didn't actually cover their distribution entirely, even after all the cuts.
They've historically focused on covering their distributions with income only and paying out year-end capital gains if necessary. Therefore, I suspect that they are already seeing or expecting to see a higher NII generation going forward, where coverage is improving, and that's why we've seen the distribution increases.
FLC Annual Report (Flaherty & Crumrine)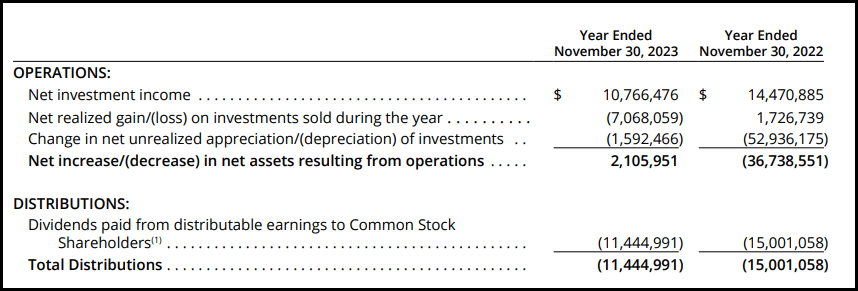
One of the reasons that the fall of FLC felt so much more dramatic was that this fund had fairly regularly traded at meaningfully lower discounts in most of the last decade. In fact, the fund even traded at premiums fairly often. When comparing total return results between FLC and Cohen & Steers Tax-Advantaged Preferred Securities & Income (PTA) and iShares Preferred and Income Securities ETF (PFF) in the last three years, we can see this playing out. The drop in terms of total share price results was much deeper than what the underlying portfolio actually saw for declines in this period.
Ycharts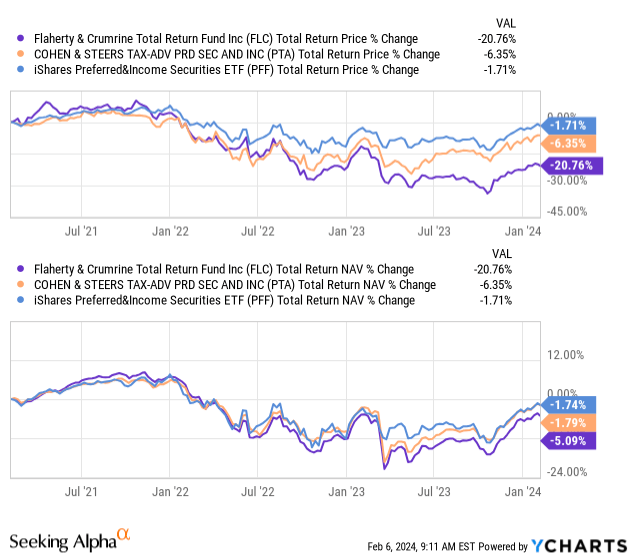
PTA was hedged in terms of its borrowing costs, which seemed to help the fund a little bit. PFF is also a non-leveraged ETF that provides for a better overall context of the preferred performance during this time. It's actually quite impressive that despite not being hedged and carrying significant amounts of leverage, FLC didn't perform even worse.
Given that being the case, here is what the fund's long-term discount/premium chart is and where the fund has averaged in terms of valuation in the last decade.
Ycharts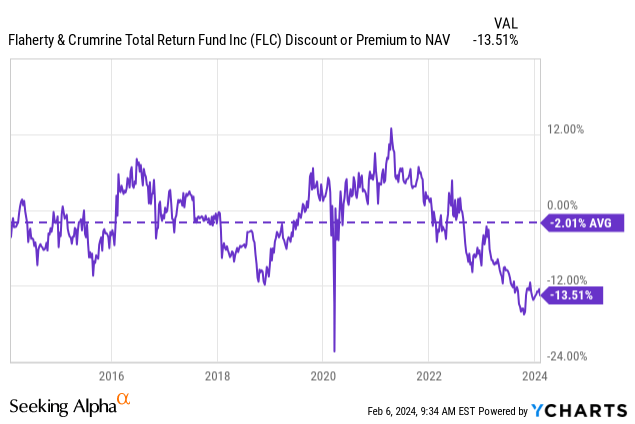
We know that the current environment has changed due to the higher rates, making leverage utilized by the fund a negative. That said, with the environment set to go from a rate hiking period to one that is expecting cuts in the next year or two, a headwind could turn into a tailwind. Picking up shares while they are beaten down during this more unfavorable period could prove to be rewarding for investors over the coming years - before the discount starts to narrow, reflecting other investors piling in.
While the Fed's lowering rates would have a nearly immediate impact on the fund in a positive way due to its tie to the fund's borrowings, the fund is also sensitive to risk-free Treasury Rates - which we've clearly seen play out.
Ycharts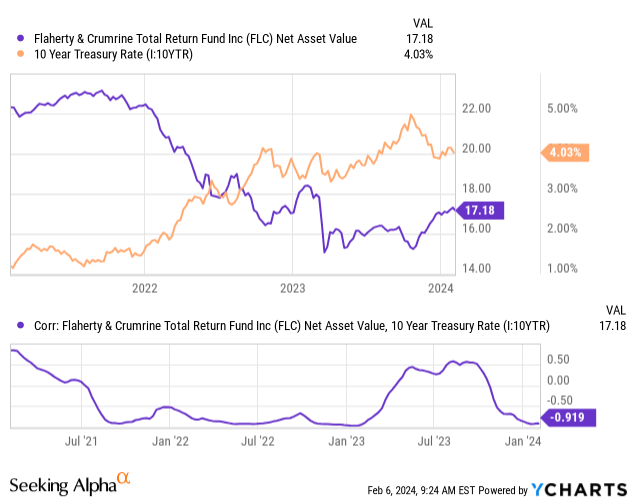
The fund's leverage-adjusted effective duration of 5.1 years means that should longer-term risk-free rates decline, the underlying portfolio value of FLC should head higher. There will always be gyrations on the rate, but assuming we don't start making new decade highs as we saw last October, then at the very least, most of the damage could be in on this front.
The fund's turnover rate comes to 8.7%, meaning the portfolio changes very little from year to year or from each of our updates to the next. For the most part, the fund is carrying non-cumulative perpetual preferred from the banking and insurance industries. These are by far the largest allocations of the fund. So, there is very little in terms of underlying holdings that are maturing, given the perpetual nature leading further to the fairly static portfolio of holdings.
FLC Sector Allocation (Flaherty & Crumrine)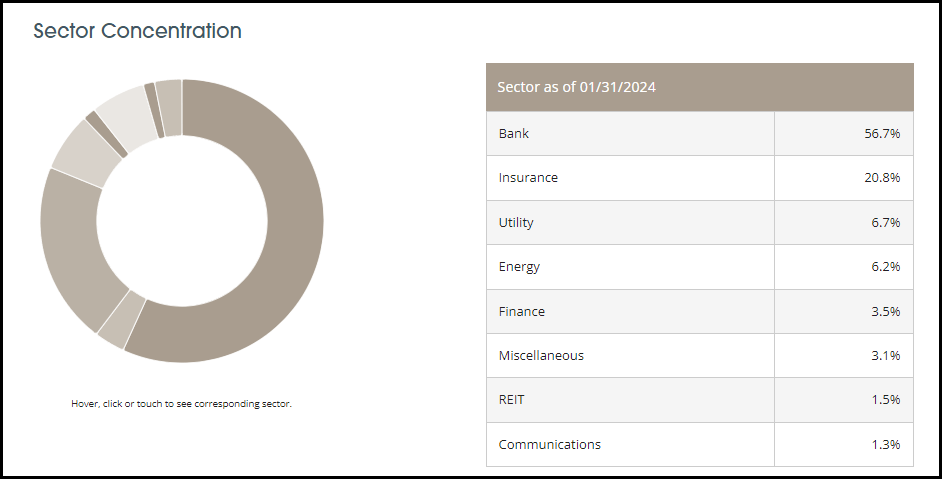
This isn't necessarily a negative for the fund. There is a bit less to keep track of for this fund as the top holdings remain pretty consistent, with most changes in weightings being normal market gyrations.
FLC Top 25 Holdings (Flaherty & Crumrine)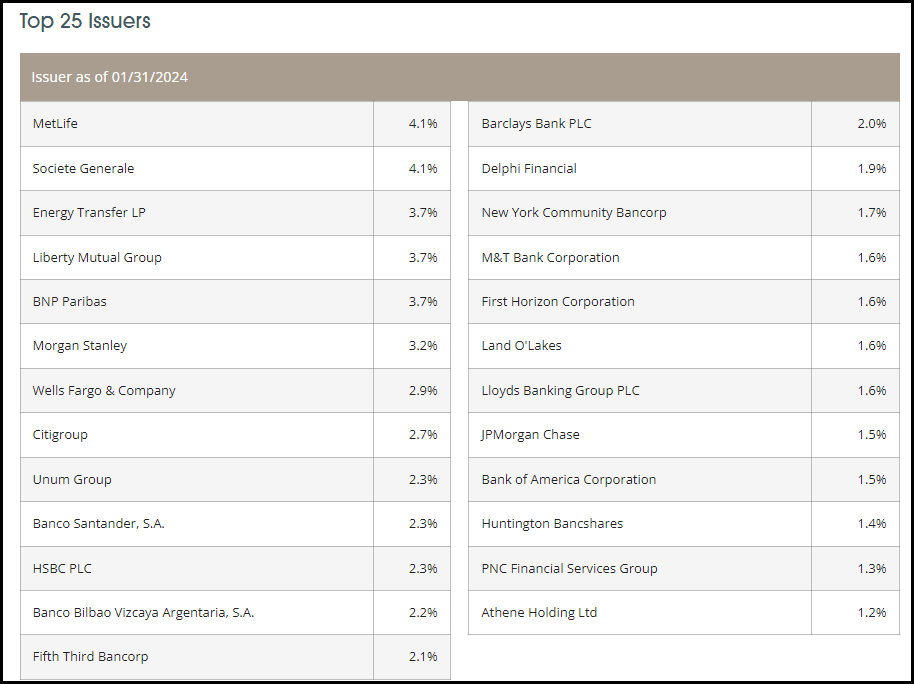
One name in particular here, New York Community Bancorp (NYCB), is of particular interest more recently. This is the latest bank to look relatively weak in terms of being able to survive, reflected in the share price collapse after their last earnings. They slashed their dividend to strengthen their balance sheet, and it doesn't appear to be running into the same issues as the banks that collapsed last March 2023. That is, those banks experienced a run on the bank with depositors moving their money out, but NYCB noted that they saw deposits increase in the bank as well as expanding deposit insurance for customers.
So, while the bank's common shareholders have taken it on the chin, the bank doesn't appear to be in as precarious of a position as the banks that collapsed last year.
Further, NYCB's preferreds account for 1.7% of exposure to FLC. Even under a worst-case scenario of complete collapse and wipe out, the damage to FLC can be relatively limited.
Most of the portfolio is invested in investment-grade-rated issues. However, this is only just into the first rung of investment-grade quality, as it is primarily allocated to BBB rated issuances.
FLC Portfolio Credit Quality (Flaherty & Crumrine)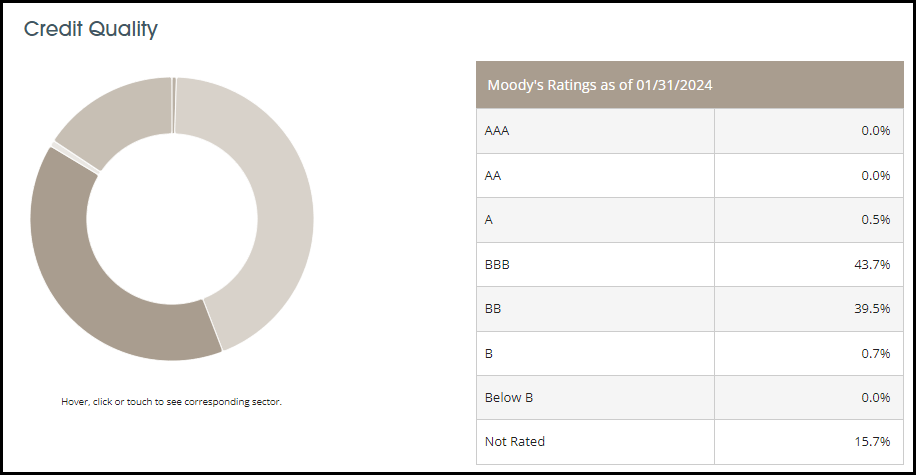
FLC is trading at a substantial discount, which makes it an appealing time to consider this fund. The discount seems warranted in the fact that the interest rate environment has changed completely from where we were in most of the last decade. That saw significant distribution cuts and a decline in the fund's underlying portfolio value. On the other hand, we are looking like we have already seen peak rates this cycle. As we look set to shift into the Fed easing in the coming years, that should bode well for FLC.
FLC could see some of its distribution recover - as we already saw a glimmer of hope on that front with the latest increase. We should expect to see some recovery in the underlying portfolio as well if risk-free rates head lower, which could spur a share price recovery. At least, assuming that the share price recovers along with the NAV to some degree and doesn't simply see the fund's discount widen even further. Further, a return to a better operating environment for FLC could see its discount shrink as another potential catalyst for better total return results going forward.