
Khanchit Khirisutchalual
Khanchit Khirisutchalual
Calamos Strategic Total Return Fund (NASDAQ:CSQ) is a closed-end fund, or CEF, that was incepted nearly 20 years ago in March 2004. The fund is a hybrid fund that primarily invests in a diversified portfolio of equity of common stocks, convertibles, corporate bonds, and preferred securities, with an emphasis on high-growth stocks. The fund seeks to provide a high total return by way of income and capital gains. The fund is managed by Calamos Investments group, which has nearly $35 Billion of AUM (assets under management) and specializes in convertibles, alternatives, multi-asset class, and other strategies.
As per the fund's literature:
"The Fund seeks total return through a combination of capital appreciation and current income by investing in a diversified portfolio of equities, convertible securities, and high-yield corporate bonds. The Fund seeks to offer investors an attractive monthly distribution while offering equity participation. The Fund invests in a diversified portfolio of primarily US equities, in addition to convertible securities and high-yield securities. The allocation to each asset class is dynamic and reflects management's view of the economic landscape and the potential of individual securities. By combining these asset classes, the management believes that the fund is well positioned to generate capital gains and income over the long term."
Other salient features of this fund are as follows:
Let's look at the Fund's Financial health and performance. The most recent detailed report that is available to investors is the annual report for the period of Nov. 2022 – Oct. 31. 2023.
Net Investment Income:
The net investment income (or NII in short) is the net income that a fund earns from its investment in the form of dividends, distributions, and interests or derivatives like options, minus all of the fund's expenses, including management fees, operating expenses, commissions, and interest on leverage. For equity-based funds, especially in high-growth sectors like technology, the NII is not very relevant. However, for fixed-income or bond funds, it is very relevant. This fund is 2/3rd equity and 1/3rd fixed income securities, so as such, it generates significant income, but it is nowhere close to meeting the distributions and all the expenses.
In fact, as we will see in the table below, the fund generated net income that was nearly 40% of the distribution amount, but due to high interest and other expenses, all of that income was consumed by fees and expenses. So, most of the distributions had to come from capital gains.
Here is what it looks like in terms of NII, Distributions, and Net Assets at the beginning and end of the statement period.
(all amounts are in US $ (except Shares Outstanding) for the 12-month period; negative amounts are shown inside parentheses, per the annual report, 12 months ending Oct.31, 2023. We also provide the data for the year 2022 for comparison.
Table-1:
Author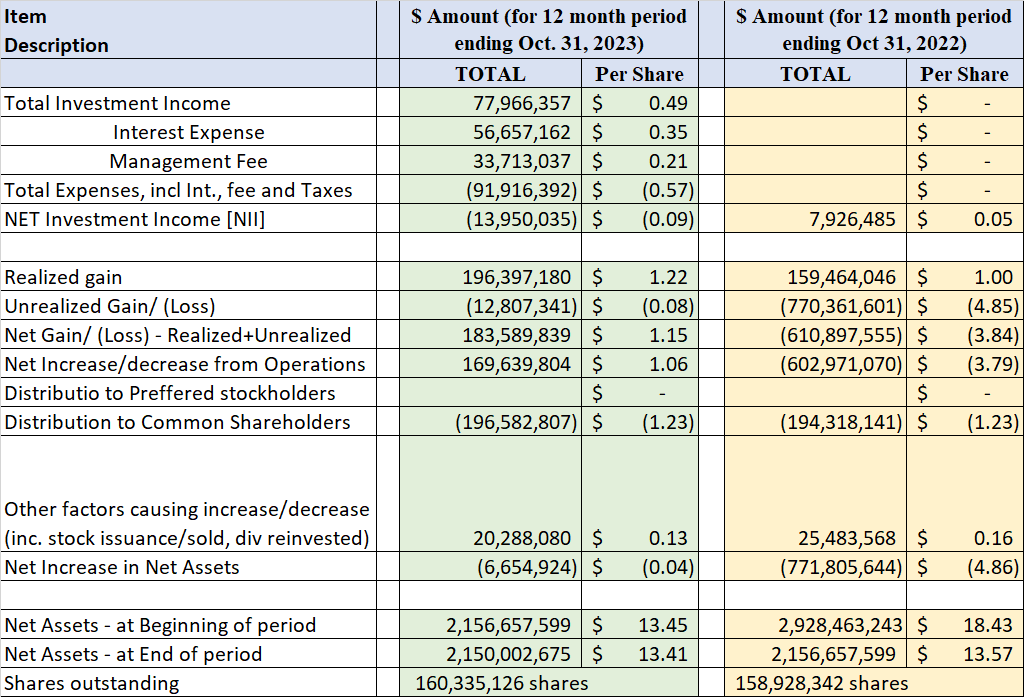
Data source: CSQ's 2023 annual report.
CSQ provides a monthly distribution of $0.1025 per share, which comes out to be a yield of 7.92% on market price and 7.75% on the NAV (as of Feb. 13, 2024). The fund follows a "managed" distribution policy. That means it tries to keep the distribution rate fairly consistent. The fund increased the distribution by 10.8% in early 2021, and since then, it has kept the same distribution. However, it may be noted that it did reduce the distribution amount during the 2008-2009 financial crisis.
So, is the distribution covered?
Table-2: Distribution (from 2020-2023)
Author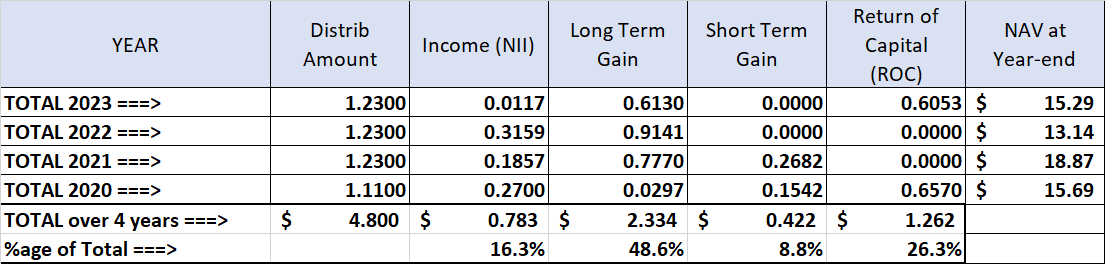
Data source: Fund's Literature.
The regular distribution amount is $1.23 a share for the year ($0.1025 a month). We checked the distribution record for the last four years, and as presented in the table above, a quarter of the distribution was paid as ROC (return of capital). But there is a kind of unevenness. It paid ROC in the years 2020 and 2023, while in 2021 and 2022, it was zero. Since the fund is 2/3rd equity, it generates large amounts of capital gain in the good years, but the reverse is true in the bad years. So, in years when it does not have sufficient amount from income and capital gains, it pays the distribution as ROC (thereby reducing the NAV). However, we also see in the table that the NAV has gone up and down but has remained at reasonable levels. Please note that NAV is calculated after paying all of the expenses and distributions. It went up significantly in 2021, but it was a bit excessive on the upside. In 2022, it dipped big, this time a bit extreme on the downside. But it recovered some in 2023, and the trend continues in 2024. The current NAV of $15.86 is 11% higher than the inception NAV of $14.31 while paying a cumulative distribution amount of $19.71 over the last 20 years. As long as the down cycles are not multi-year prolonged ones, this fund should do just fine.
The fund is going to complete 20 years next month. It has gone through many different market conditions and some deep corrections. As stated earlier, they did cut the distributions in the 2008-2009 cycle, but other than that, they have a pretty good record. We would rate the dividend reliability as above-average (out of Excellent, Above Avg., Avg., Below Avg., Unreliable).
The fund is currently trading at a small discount (-2.09%) to its NAV. But if you look at its 3-year history, it has traded at almost par with its NAV, on average. But that is just the average. If we look at the chart below, we can see that the price regularly overshoots the NAV and vice versa. But it has mostly stayed in the +4% to -4% band. However, we should always look at both the premium/discount and the overall valuation of the fund within its sector. Right now, stocks are quite expensive, representing 66% of the fund, while other assets like bonds or preferreds are cheaper and likely to recover from here.
Chart-1: CSQ – Premium/Discount Chart
CEFConnect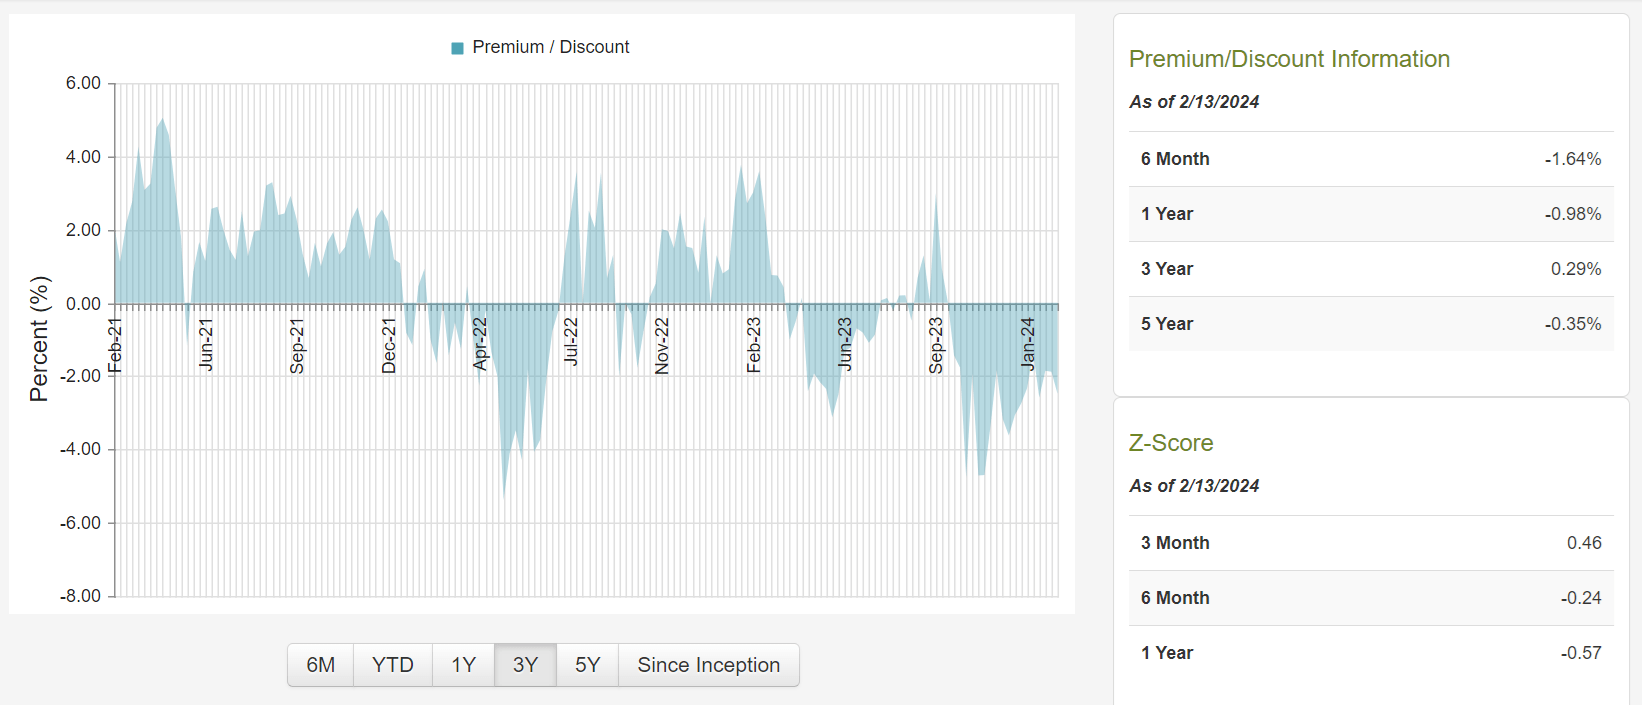
The fund is fairly diverse and had 832 positions/securities as of Dec.31, 2023. By the latest counts, it holds roughly 125 equity positions and the rest in bonds, convertibles, and preferred securities. The top 10 holdings, which are mostly equity positions, make up about 25% of the total assets. Some of the top holdings are Microsoft (MSFT), Apple (AAPL), Amazon (AMZN), Nvidia (NVDA), Meta (META), and Visa (V), among others. The top holdings and asset composition as of Dec.31, 2023, are presented below.
Table-3: Holdings as of 12/31/2023
SeekingAlpha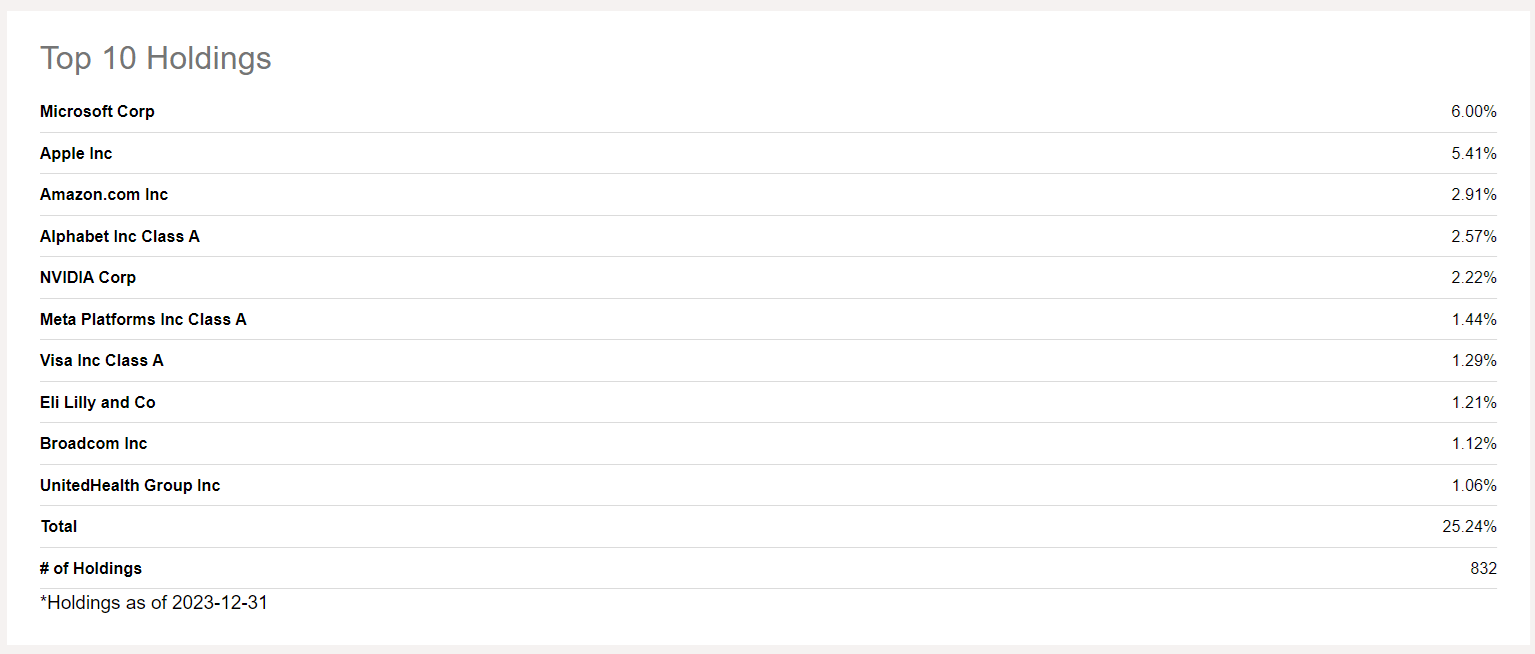
Chart-2: Sector allocation as of 12/31/2023
SeekingAlpha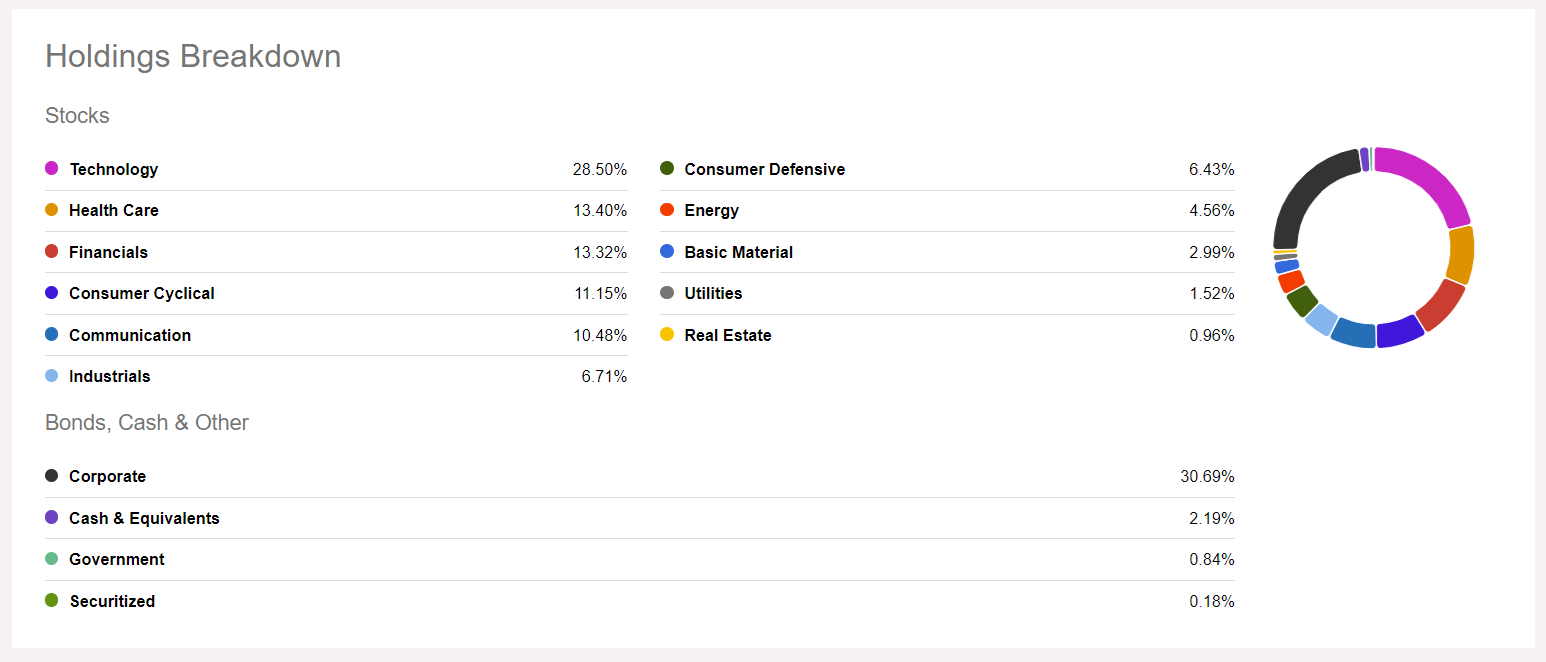
If you are looking for high-income and market-matching total returns, this may be the fund. We are not talking about the valuation at this point. Since this fund is 2/3rd equity (with nearly 29% allocation to technology), it is likely to move up or down with the broader market. One additional factor that can impact the fund is the movement of interest rates due to 31% leverage and exposure to bonds. Below is the snapshot of performance provided by the fund as of Jan.31, 2024.
Table-4:
Author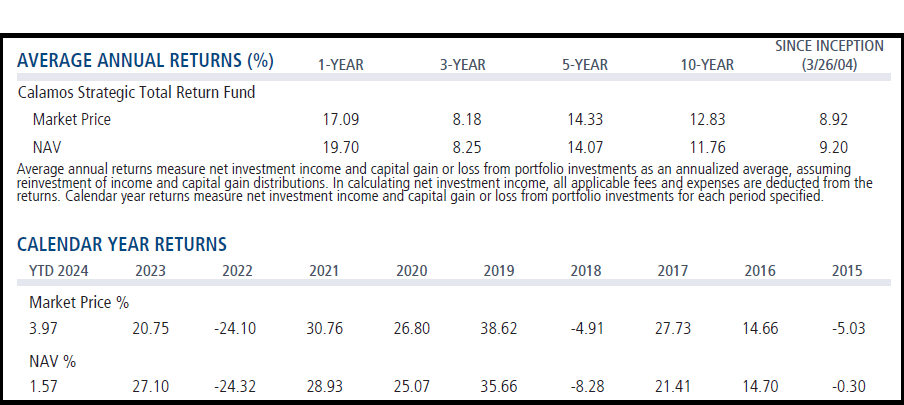
Courtesy: Fund's Literature.
In fact, for most periods, CSQ has nearly matched the performance of the S&P 500 in total returns. All that said, please note the S&P 500 is not the perfect benchmark for CSQ.
Let's see how it compares over the last 20, 10, 5, and 3 years with the S&P 500 and a hypothetical blended fund (to mimic CSQ allocations).
Blended Fund (hypothetical):
Table-5: (Data - period as specified, if not specified then as of Jan.31, 2024)
Item Desc. | CSQ | Blended (66% S&P 500, FCVSX, AGG) | S&P 500 |
Annualized Return [CAGR] From Jan.2008-Jan.2024 | 9.75% | 8.47% | 9.75% |
Annualized Return [CAGR] From April 2004 – Jan 2024 | 9.20% | 8.50% | 9.64% |
Dividend Yield% (as of 02/13/2024) | 7.92% | 1.75% | 1.34% |
Max. Drawdown (2008-2023) | -57% | -40% | -49% |
Std. Deviation (2008-2023) | 22% | 13% | 16% |
10-Year CAGR | 12.84% | 9.95% | 12.46% |
5-Year CAGR | 14.33% | 11.64% | 14.14% |
3-Year CAGR | 8.18% | 6.97% | 10.83% |
Fees (excluding interest) | 1.05% | 0.19% | 0.09% |
Leverage | 31% | 0% | 0% |
No of holdings | 832 | >10,000 | 504 |
Assets | $3.6 Billion | >500 Billion | $484 Billion |
Allocation | 66% Equity, 15% Bonds, 15% Convertibles, 2% Pref. | 66% Equity, 16% Bonds, 16% Convertibles. | Largest 500 US companies |
Note: Some of the data (e.g., number of holdings and leverage) may not be current as of Jan.31, 2024.
Now, the past performance looks very decent, especially long-term past performance. What about the future? After all, we would be investing today for the future performance. In the last couple of years, we have had high inflation and a high-interest rate regime. The high interest rates suppressed the valuation of all kinds of assets, but it was particularly hard on debt securities and bonds. Also, if any fund deployed leverage, they had to pay a lot more in interest expenses than prior to the year 2022.
Though CSQ's NAV suffered in 2022, it recovered somewhat in 2023. Since now, more than likely, we have reached the peak interest rates, and even if there is no immediate rate cut in March or June 2024, there is not likely to be any further increase. As the interest rates start declining, it will give a boost to the valuations of the bond assets. It will also mean less of a burden from interest expenses.
Investors need to be aware of certain risk factors that are associated with this fund and CEFs in general. Risk factors could be summarized as follows:
You may have noticed in the article that CSQ has more or less matched the total return performance of the S&P 500 but with higher volatility (due to leverage). Then, the question would be: why should we even prefer CSQ over the S&P 500? The answer is in one word, that is "income." The S&P 500 currently provides a 1.35% yield, which means an income of $13,500 on a one-million-dollar portfolio. Who can retire on that income? Unless, of course, you have savings of more than $5 million. Sure, some folks would argue that you can always sell shares to generate income. Well, we believe that is not everyone's cup of tea. In fact, a majority of folks can't do that effectively. There are a lot of pitfalls in generating income by selling shares. So, for a common investor, funds like CSQ offer a better choice. In good times or bad, you keep getting a nearly fixed income, which makes it a much easier ride. If you do not need or use all the income, you can reinvest a part of it back.
Sure, past records do not guarantee anything, but if it is any indication, this fund is a survivor. We think the fund is fairly valued (and 'hold') at this time, but it is not cheap to be a screaming buy. The discount/premium is in line with the long-term average. If you are a new buyer, you could buy the first lot of shares as a placeholder to monitor. Eventually, the discount should appear as it has in the past, and that may be a good time to add more shares. Though this fund is paying nearly 8% yield (7.92% to be precise), we recommend reinvesting at least 2-3% back into the fund. The existing owners should hold the shares as we consider this to be a reasonable long-term holding that should serve its owners well.