
Lemon_tm
Lemon_tm
Written by Nick Ackerman, co-produced by Stanford Chemist.
BlackRock Enhanced Capital and Income Fund Inc (NYSE:CII) continues to trade at an attractive discount. The fund's performance has been quite strong thanks to the heavy tech exposure it carries. This is a closed-end fund that benchmarks against the Russell 1000 Index and also implements a covered call strategy on a portion of its portfolio. The covered call strategy can limit some upside potential, but it can also bring in options premiums that can mean higher distribution rates for its shareholders.
Our last update was near the lows of last October, which has seen the fund's performance become quite strong since that time. The fund's discount has also widened out since our last update, which would have seen the total returns a bit higher had that not happened.
CII Performance Since Prior Update (Seeking Alpha)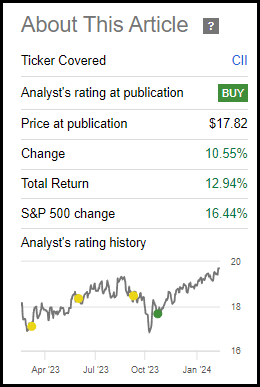
CII has a simple objective and strategy; it "seeks to provide investors with a combination of current income and capital appreciation" by "investing in a portfolio of equity securities of the U.S. and foreign issuers." They will also "employ a strategy of writing call and put options."
The fund takes no leverage in the form of borrowings, which is seen as a positive, in my opinion, in the current environment of higher interest rates. The covered call writing strategy is also a slightly defensive strategy as it brings in option premiums, which can be beneficial to offset some of the losses seen or provide some returns if the market moves sideways.
53.89% of the portfolio was overwritten at the end of January 2024, which was down just a bit from 55.5% in our prior update. This puts them on a more defensive tilt and above their target, given the target overwrites of the fund is between 30-40%.
On a YTD basis, the fund's performance has already been strong. In fact, the fund's total NAV return is a bit higher than the fund's actual total share price returns.
YCharts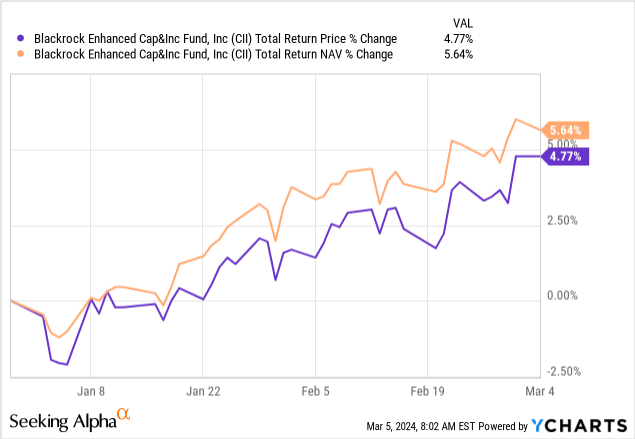
When that situation occurs, it results in a further deepening of the discount on closed-end funds. That's pushed the fund's discount a touch wider on a YTD basis, and that has also been the case since our last update in October 2023.
I believe this is a fairly attractive discount level on a relative basis. Even if the fund's discount isn't as deep as that of other peers. I believe that a relative discount/premium is a more useful metric for trying to find attractively priced CEFs. Over the last year, the fund has moved from flirting with a premium to this current discount. For that reason, we arrive at a negative 1-year z-score that makes the fund look even more appealing on that basis.
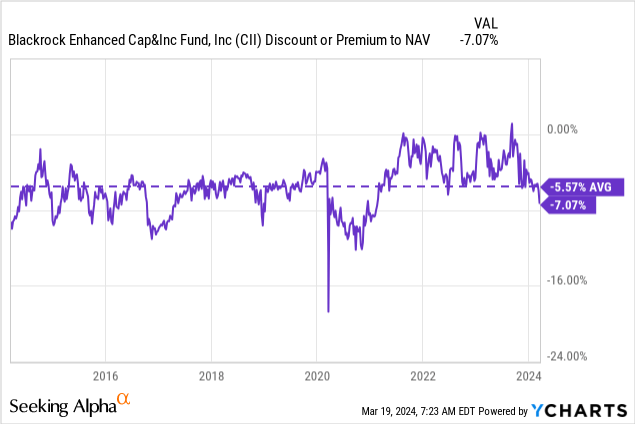
Though the discount isn't at the widest discount levels, it's still trading below its longer-term average with a bit of a drop recently. The fund carries a portfolio mostly made up of what you'd find in the S&P 500 Index. So, if you have a general bullishness for equities over the long term, as they have historically risen over time, the fund can make sense.
This could be especially true if you believe that the market has run up quite significantly more recently. That could make using a dollar-cost averaging approach the most appropriate at this time. The fund's covered call strategy can help deliver some returns even in a sideways market. A covered call strategy can limit some upside during a raging bull market, and that's always worth considering.
That said, the fund's returns have still been quite respectable and competitive against its Russell 1000 Value Index nonetheless. When including the fund's MSCI USA Call Overwrite Index comparisons, then over the last five years, the fund has done quite a bit better as well. Over the last year, CII has been the laggard.
CII Annualized Performance Relative to Benchmark (BlackRock)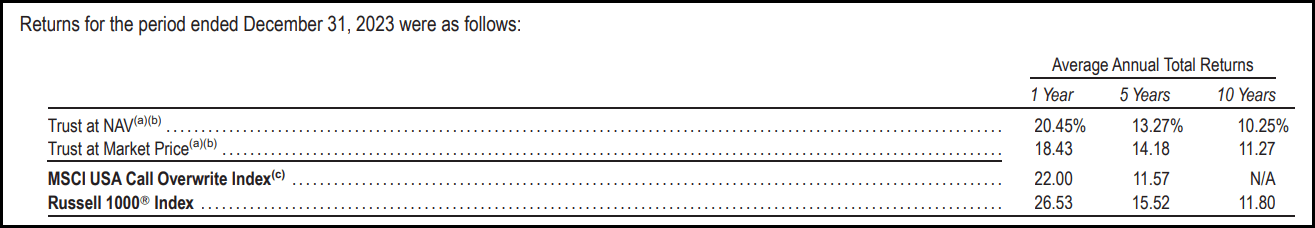
The fund currently pays out a monthly distribution that works out to $1.194 annually, which amounts to a 6.23% distribution rate. On an NAV basis, we are at a rate of 5.76%.
CII Distribution History (CEFConnect)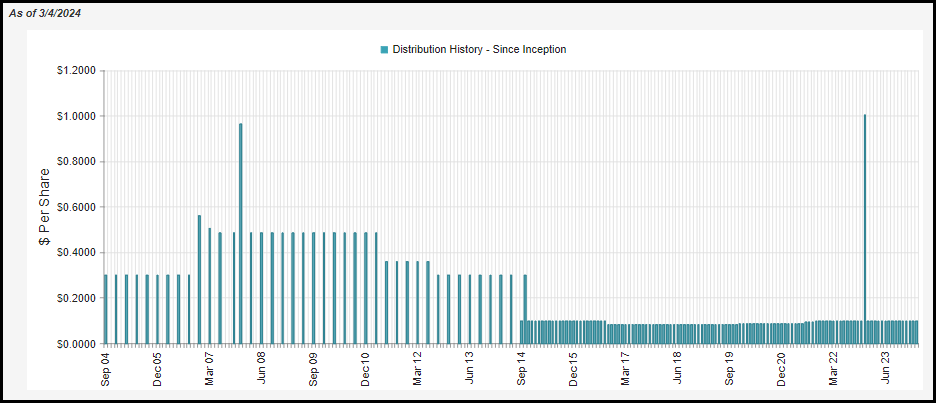
That could be considered fairly low compared to its call-writing peer CEFs and ETFs, but that is thanks to how strong the fund's performance has been. There is nothing wrong with running a bit of a lower yield either, which then gives more room for potential downside in the future. At the same time, it wouldn't surprise me if we saw the fund boost its monthly distribution either.
The strong market performance is directly linked to how strong the distribution can be for CII. This is because, thanks to its fairly tech-heavy portfolio, the fund doesn't generate significant amounts of net investment income. Therefore, the distribution will heavily rely on capital gains to fuel its payout to investors.
That isn't unusual for equity CEFs, but that tech lean can really limit NII as these tech companies don't generally pay out very high yields themselves. Instead, they use their cash flow to generate further growth in the business and, hopefully, in time, generate some appreciation. That said, we have seen a number of companies in the tech space initiate dividends for the first time.
NII coverage for CII's distribution comes to 5.45%. That's up from the prior year, but that's because CII paid out a large special in 2022, which saw more paid out as distributions to shareholders.
CII Annual Report (BlackRock)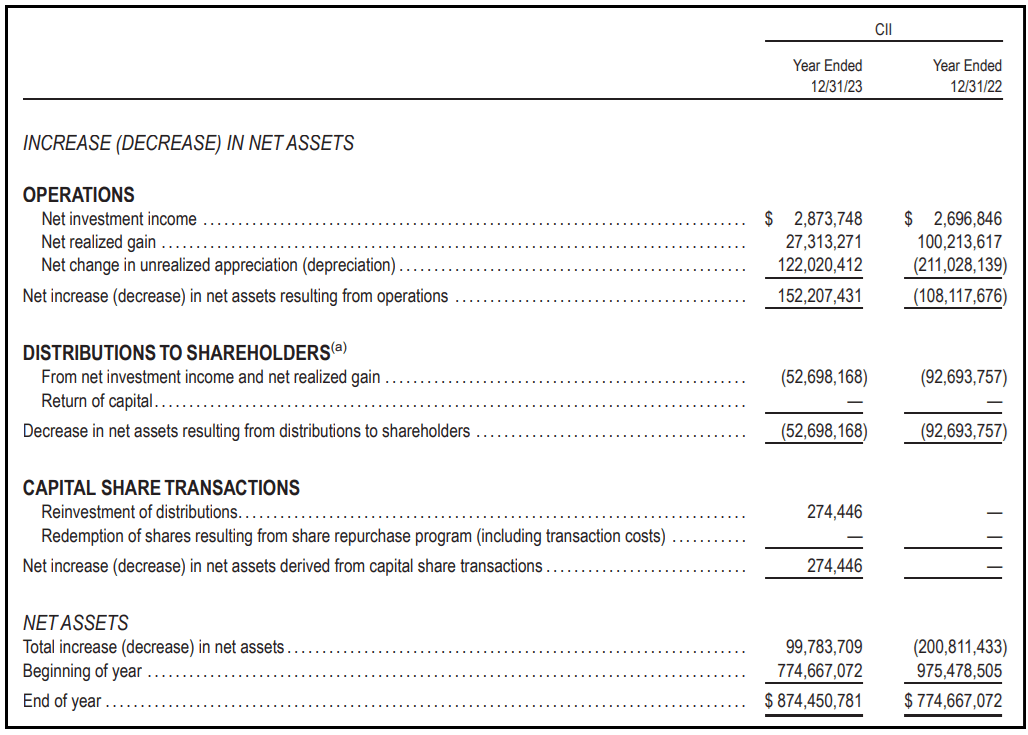
Of course, one of the ways the fund can generate those capital gains that it needs is through writing covered calls. That doesn't always work out as expected, though, and sometimes option writing can create losses. For 2023 being such a strong year, it's something we've seen from a number of option writing funds - that is, the options written are showing realized losses.
That was the case for CII, which saw their options generate about $11 million in losses for the fund. Offsetting those losses were realized gains from the underlying portfolio that were way more than enough to offset those losses.
CII Unrealized/Realized Gains/Losses (BlackRock)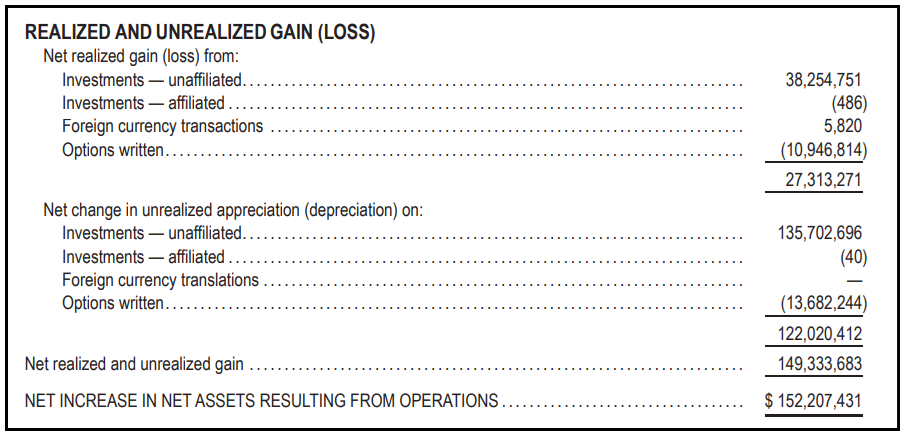
One of the main reasons that the options can generate a loss is because the managers are closing or rolling the positions for a loss. This would be to participate in further upside on a position if they believe it has more room to run.
For tax purposes of the fund's distribution, we are seeing mostly what we would expect. That is, the fund's payout is primarily characterized as long-term capital gains.
CII Distribution Tax Classification (BlackRock)
Historically, a large portion of the fund's distribution that is classified as ordinary income was also considered qualified dividend income. For this reason, along with the tax-friendly nature of LTCG, CII seems appropriate for either a taxable or tax-sheltered account.
The fund's turnover in the last year came to 28%. While the fund benchmarks against the Russell 1000 Index, it holds a portfolio of significantly fewer positions. In fact, the fund's latest data shows there were just 57 holdings at the end of January 31, 2024.
This is one of the reasons why the fund's performance could diverge from its benchmark, but that divergence could also be in terms of outperformance too. Of course, the other reasons besides portfolio positioning would be having an expense ratio and also the covered call strategy.
The largest exposure to the fund in terms of its sector weighting is the information technology sector. This has regularly been the case, but over the last six months or so, the weighting to tech has actually climbed higher.
CII Sector Breakdown (BlackRock)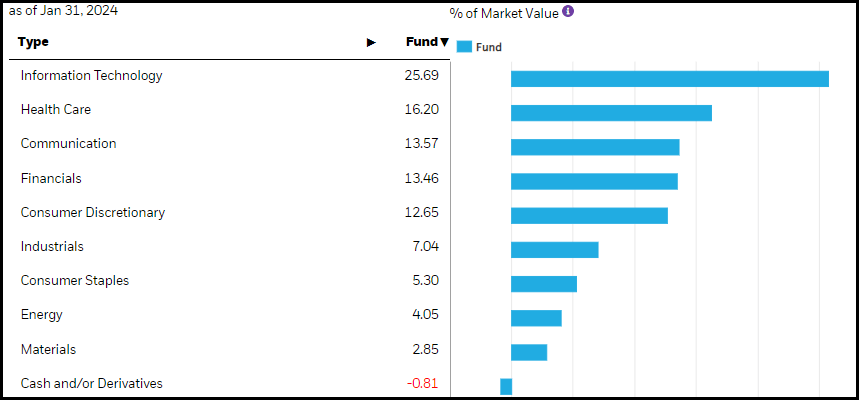
In part, this has been driven by simply letting the portfolio run without rebalancing. The tech sector has seen strong performance thanks to names such as NVIDIA Corporation (NVDA) and Meta Platforms, Inc. (META) really performing strongly last year. In fact, these two, in particular, are also performing incredibly well as we enter into the early parts of 2024.
NVDA wasn't listed as a position in CII as of their last annual report; however, META has been a top ten position for a while - that, along with many of the other strong-performing tech names last year.
CII Top Ten Holdings (BlackRock)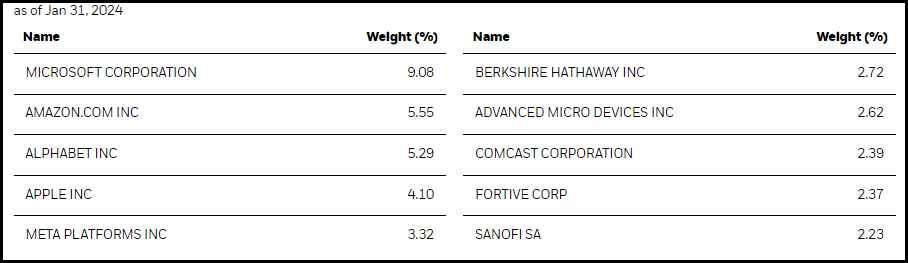
One of the high-flyer mega-cap names that was getting a lot of attention was Tesla, Inc. (TSLA), but that has been reversing sharply. Fortunately, CII hadn't listed TSLA as a position either. Another name that has been performing quite strongly but doesn't always get the most attention is Advanced Micro Devices, Inc. (AMD).
The chart below shows the price performance of these names discussed over the last year. AMD has been able to keep right up with META - though the absolute blowout has been NVDA, leaving everyone else in the dust.
YCharts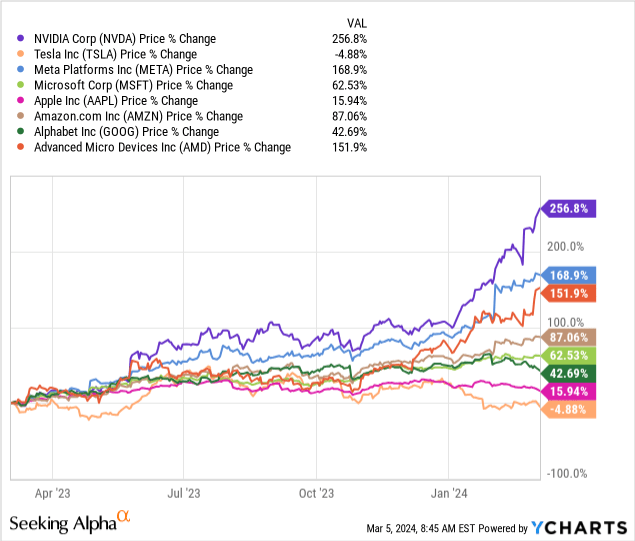
Given the significant weighting of MSFT, AMZN, GOOG, AAPL, META and AMD that comprises CII, where these names go will decide where CII goes in terms of performance. These names make up just a hair under 30% of CII.
Likewise, where these names go is where the broader equity market will be going, too, as they have also become such significant weightings in the S&P 500 Index.
CII has a strong track record and is delivering a solid monthly distribution to investors. The distribution rate is currently quite low, but that isn't necessarily a bad thing either. The fund could choose to raise its distribution or leave it where it is for some 'cushion' for the next market crash. The timing of when the next market correction occurs is never known, but we do know they are guaranteed to happen. It is only a matter of when and not if.
Currently, the market is making new highs, but CII is also trading at an appealing discount. So overall, while I like the fund and consider it a long-term holding for myself, it would seem a dollar-cost average approach would be the most appropriate. Though with the fund's discount, I'll still give the fund a 'Buy' rating here.